| Param | Original file | Final file |
|---|---|---|
| Filename | modeM0/AS1A03_051T01_9000001346_09468cztM0_level2.evt | modeM0/AS1A03_051T01_9000001346_09468cztM0_level2_quad_clean.evt |
| Size (bytes) | 792,411,840 | 133,660,800 |
| Size | 755.7 MB | 127.5 MB |
| Events in quadrant A | 6,705,793 | 849,569 |
| Events in quadrant B | 5,160,810 | 845,770 |
| Events in quadrant C | 4,847,847 | 823,260 |
| Events in quadrant D | 6,562,310 | 790,982 |
| Mode M0 | |||
|---|---|---|---|
| Quadrant | BADHDUFLAG | Total packets | Discarded packets |
| A | 0 | 26825 | 6 |
| B | 0 | 22471 | 3 |
| C | 0 | 22225 | 4 |
| D | 0 | 26891 | 2 |
| Mode M9 | |||
|---|---|---|---|
| Quadrant | BADHDUFLAG | Total packets | Discarded packets |
| A | 0 | 22 | 0 |
| B | 0 | 22 | 0 |
| C | 0 | 22 | 0 |
| D | 0 | 22 | 0 |
| Mode SS | |||
|---|---|---|---|
| Quadrant | BADHDUFLAG | Total packets | Discarded packets |
| A | 0 | 218 | 0 |
| B | 0 | 218 | 0 |
| C | 0 | 218 | 0 |
| D | 0 | 218 | 0 |
| Quadrant | Total seconds | Saturated seconds | Saturation percentage |
|---|---|---|---|
| A | 10656 | 235 | 2.205330% |
| B | 10657 | 107 | 1.004035% |
| C | 10656 | 70 | 0.656907% |
| D | 10657 | 321 | 3.012105% |
Noise dominated data is calculated using 1-second bins in cleaned event files. If a bin has >2000 counts, and if more than 50% of those come from <1% of pixels, then it is considered to be noise-dominated and hence unusable.
| Quadrant | # 1 sec bins | Bins with >0 counts | Bins with >2000 counts | High rate bins dominated by noise | Noise dominated (total time) | Noise dominated (detector-on time) | Marked lightcurve |
|---|---|---|---|---|---|---|---|
| A | 12857 | 10659 | 38 | 38 | 0.30% | 0.36% | 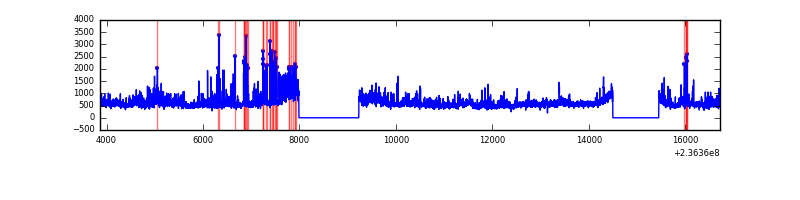 |
| B | 12857 | 10659 | 3 | 3 | 0.02% | 0.03% | 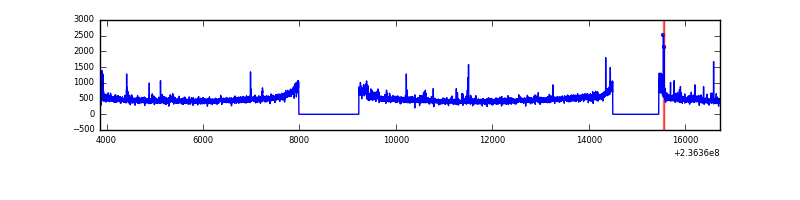 |
| C | 12857 | 10659 | 16 | 16 | 0.12% | 0.15% | 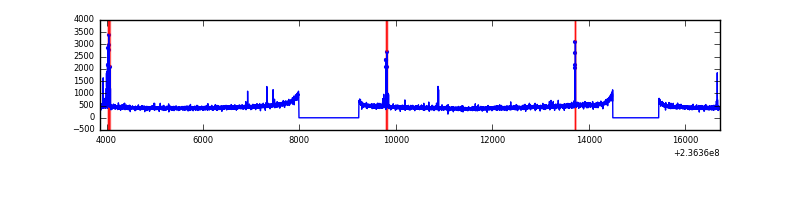 |
| D | 12857 | 10659 | 265 | 265 | 2.06% | 2.49% |  |
Top three noisy pixels from each quadrant. If the there are fewer than three noisy pixels in the level2.evt file, extra rows are filled as -1
| Pixel properties | Quadrant properties | ||||||
|---|---|---|---|---|---|---|---|
| Quadrant | DetID | PixID | Counts | Sigma | Mean | Median | Sigma |
| A | 8 | 5 | 1628390 | 6331.46 | 1271 | 1246 | 257.0 |
| A | 14 | 111 | 87450 | 335.43 | 1271 | 1246 | 257.0 |
| A | 1 | 162 | 45946 | 173.93 | 1271 | 1246 | 257.0 |
| B | 0 | 214 | 50282 | 202.15 | 1273 | 1243 | 242.6 |
| B | 0 | 219 | 49376 | 198.41 | 1273 | 1243 | 242.6 |
| B | 12 | 18 | 32853 | 130.3 | 1273 | 1243 | 242.6 |
| C | 14 | 234 | 107189 | 381.12 | 1213 | 1220 | 278.0 |
| C | 13 | 61 | 9348 | 29.23 | 1213 | 1220 | 278.0 |
| C | 12 | 4 | 7202 | 21.51 | 1213 | 1220 | 278.0 |
| D | 1 | 52 | 1215768 | 3909.46 | 1201 | 1169 | 310.7 |
| D | 8 | 195 | 607157 | 1950.51 | 1201 | 1169 | 310.7 |
| D | 7 | 71 | 78789 | 249.84 | 1201 | 1169 | 310.7 |
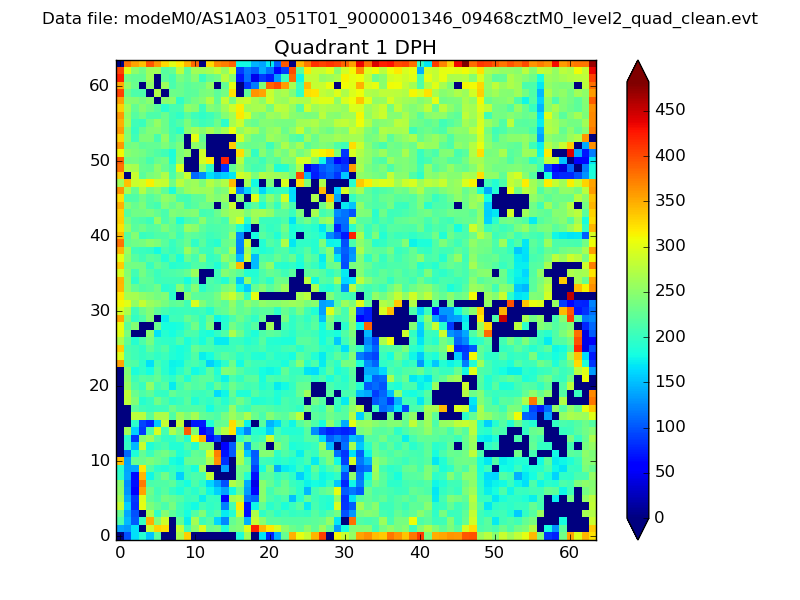
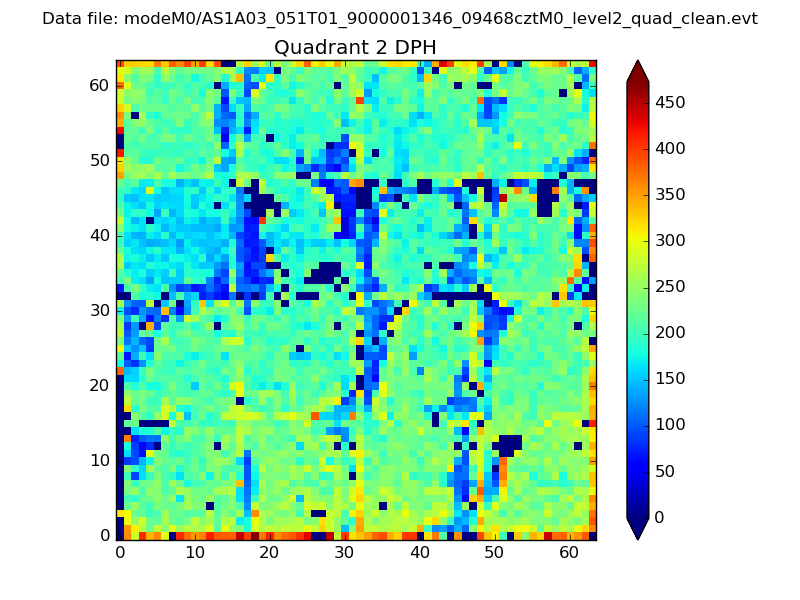
Histogram calculated using DETX and DETY for each event in the final _common_clean file
| Quadrant A | 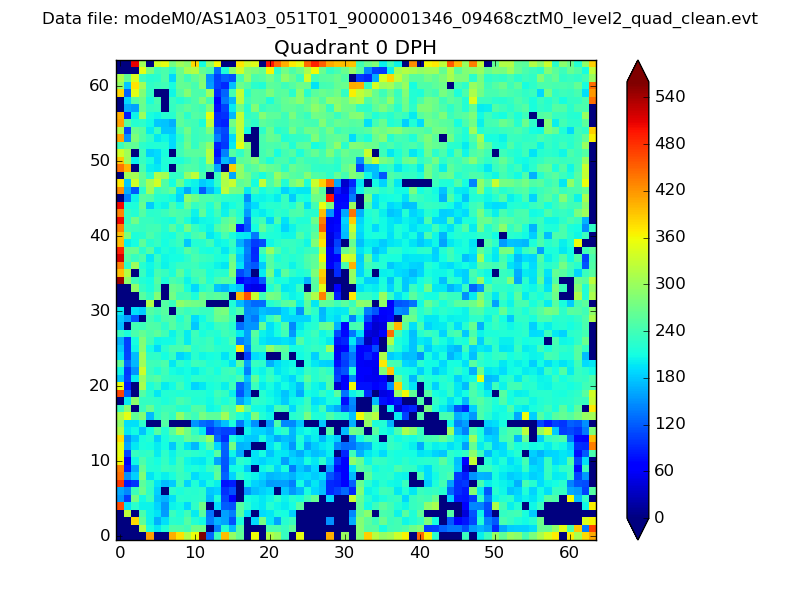 |
 |
Quadrant B |
|---|---|---|---|
| Quadrant D | 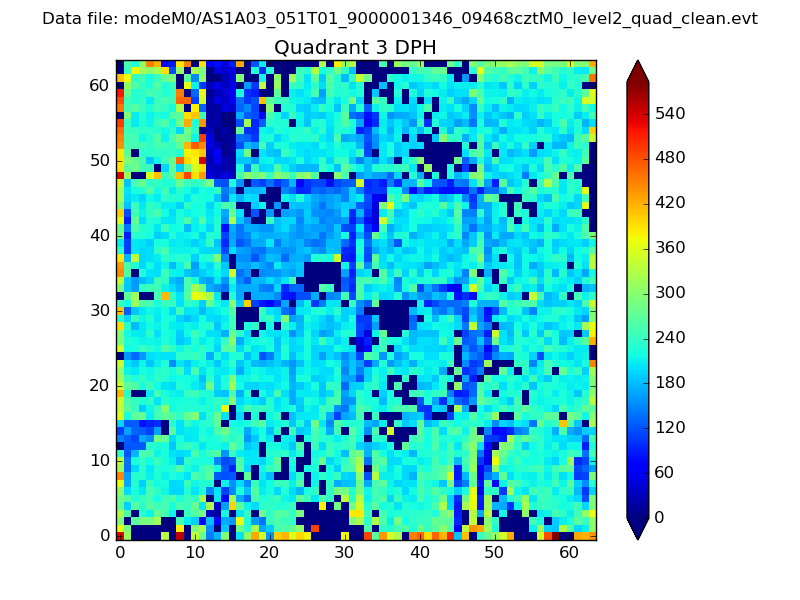 |
 |
Quadrant C |
| Plot type | Count rate plots | Images |
|---|---|---|
| Comparison with Poisson distribution Blue bars denote a histogram of data divided into 1 sec bins. Red curve is a Poisson curve with rate = median count rate of data. |
 |
 |
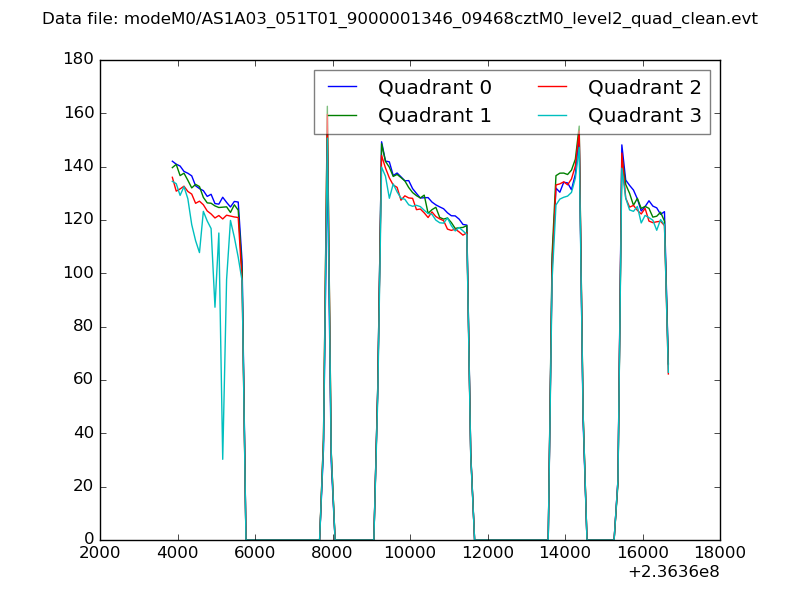
| Quadrant-wise count rates Data is divided into 100 sec bins |
 |
|
| Module-wise count rates for Quadrant A Data is divided into 100 sec bins |
 |
 |
| Module-wise count rates for Quadrant B Data is divided into 100 sec bins |
 |
 |
| Module-wise count rates for Quadrant C Data is divided into 100 sec bins |
 |
 |
| Module-wise count rates for Quadrant D Data is divided into 100 sec bins |
 |
 |
| Parameter | Plot |
|---|---|
| CZT HV Monitor |  |
| D_VDD | 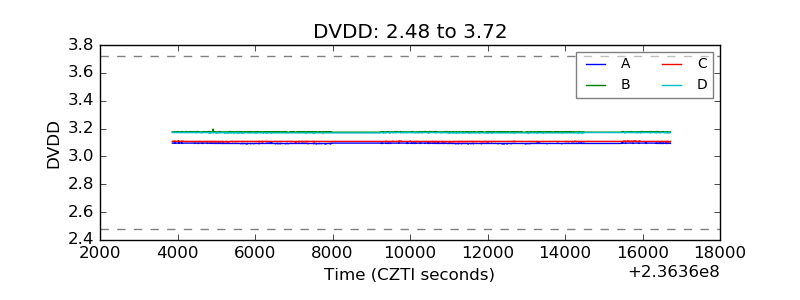 |
| Temperature 1 | 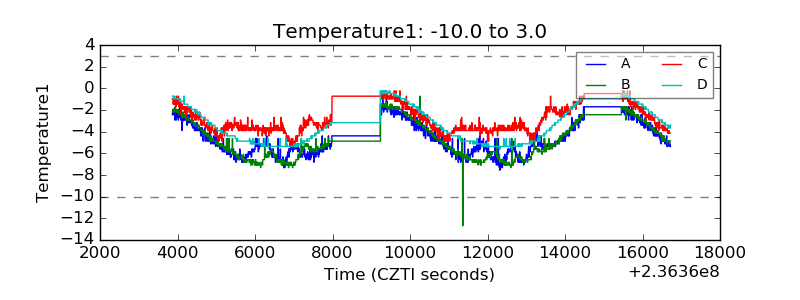 |
| Veto HV Monitor | 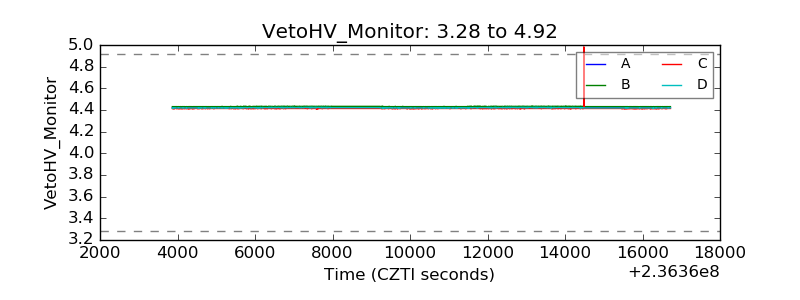 |
| Veto LLD | 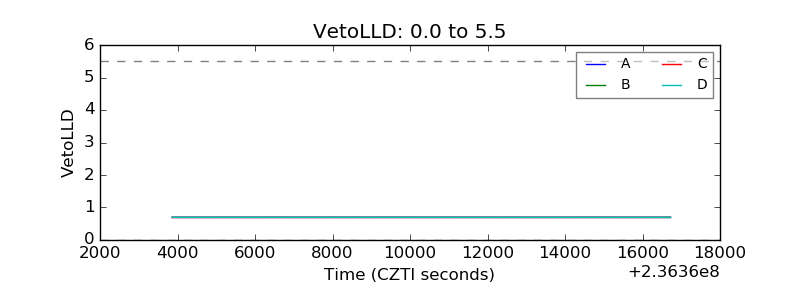 |
| Alpha Counter | 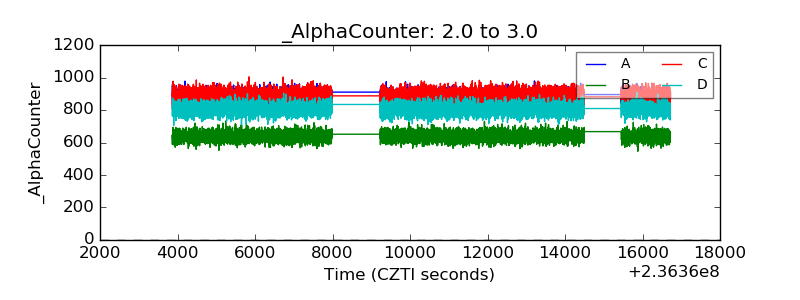 |
| _CPM_Rate | 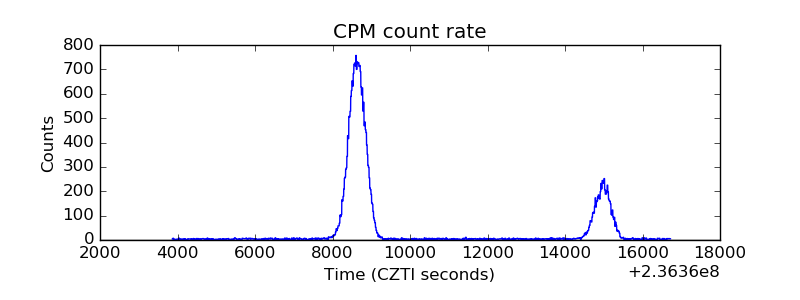 |
| CZT Counter | 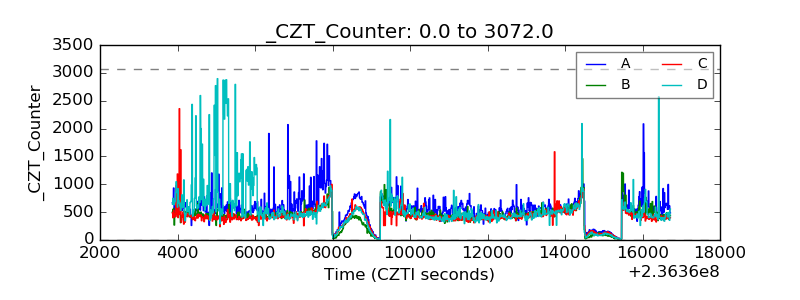 |
| +2.5 Volts monitor | 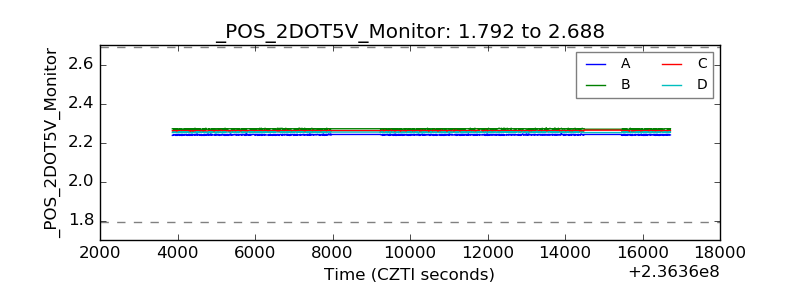 |
| +5 Volts monitor |  |
| _ROLL_ROT | 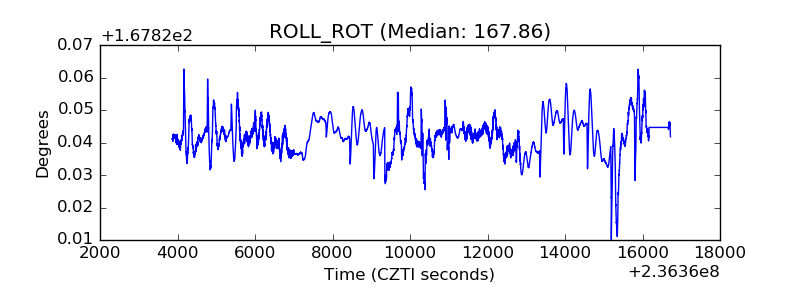 |
| _Roll_DEC | 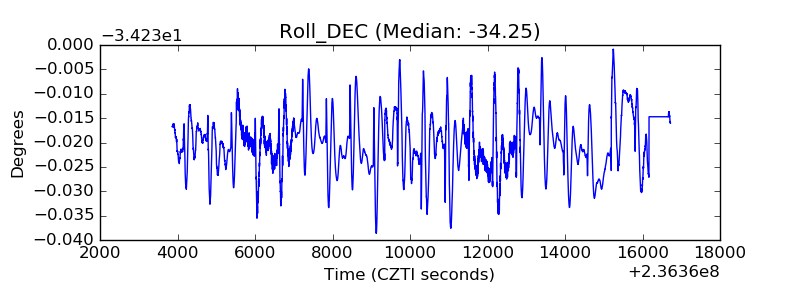 |
| _Roll_RA | 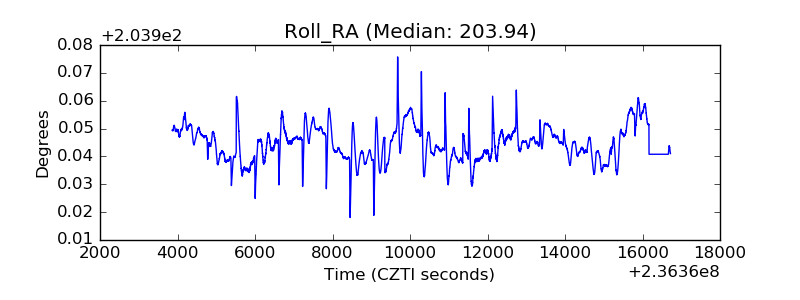 |
| Veto Counter |  |