| Param | Original file | Final file |
|---|---|---|
| Filename | modeM0/AS1A03_051T01_9000001346_09471cztM0_level2.evt | modeM0/AS1A03_051T01_9000001346_09471cztM0_level2_quad_clean.evt |
| Size (bytes) | 548,231,040 | 93,199,680 |
| Size | 522.8 MB | 88.9 MB |
| Events in quadrant A | 4,678,051 | 578,816 |
| Events in quadrant B | 3,560,203 | 584,266 |
| Events in quadrant C | 3,364,336 | 573,389 |
| Events in quadrant D | 4,488,904 | 561,060 |
| Mode M0 | |||
|---|---|---|---|
| Quadrant | BADHDUFLAG | Total packets | Discarded packets |
| A | 0 | 19198 | 339 |
| B | 0 | 16066 | 259 |
| C | 0 | 15863 | 241 |
| D | 0 | 18913 | 290 |
| Mode M9 | |||
|---|---|---|---|
| Quadrant | BADHDUFLAG | Total packets | Discarded packets |
| A | 0 | 4 | 0 |
| B | 0 | 4 | 0 |
| C | 0 | 4 | 0 |
| D | 0 | 4 | 0 |
| Mode SS | |||
|---|---|---|---|
| Quadrant | BADHDUFLAG | Total packets | Discarded packets |
| A | 0 | 154 | 2 |
| B | 0 | 154 | 0 |
| C | 0 | 154 | 0 |
| D | 0 | 154 | 0 |
| Quadrant | Total seconds | Saturated seconds | Saturation percentage |
|---|---|---|---|
| A | 7524 | 191 | 2.538543% |
| B | 7538 | 124 | 1.644999% |
| C | 7544 | 57 | 0.755567% |
| D | 7541 | 143 | 1.896300% |
Noise dominated data is calculated using 1-second bins in cleaned event files. If a bin has >2000 counts, and if more than 50% of those come from <1% of pixels, then it is considered to be noise-dominated and hence unusable.
| Quadrant | # 1 sec bins | Bins with >0 counts | Bins with >2000 counts | High rate bins dominated by noise | Noise dominated (total time) | Noise dominated (detector-on time) | Marked lightcurve |
|---|---|---|---|---|---|---|---|
| A | 7921 | 7646 | 27 | 27 | 0.34% | 0.35% | 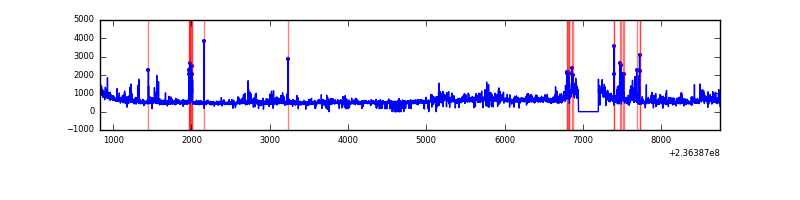 |
| B | 7921 | 7646 | 1 | 1 | 0.01% | 0.01% | 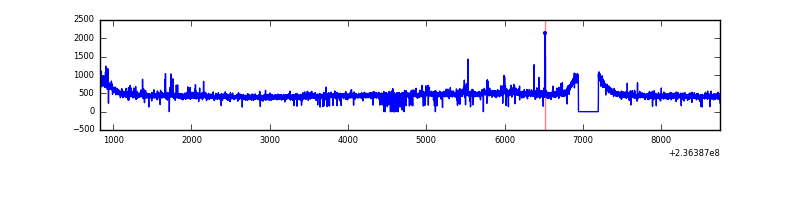 |
| C | 7921 | 7646 | 3 | 3 | 0.04% | 0.04% | 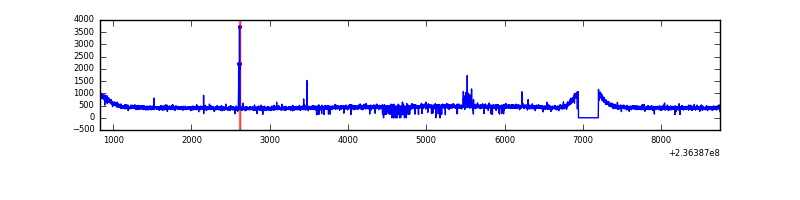 |
| D | 7921 | 7654 | 77 | 77 | 0.97% | 1.01% | 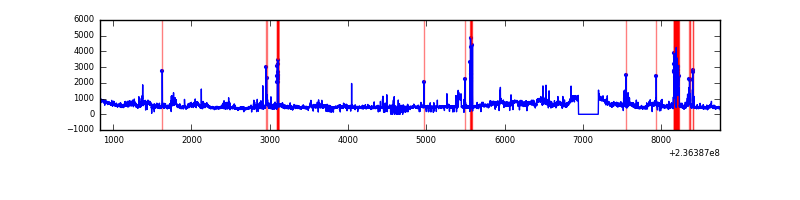 |
Top three noisy pixels from each quadrant. If the there are fewer than three noisy pixels in the level2.evt file, extra rows are filled as -1
| Pixel properties | Quadrant properties | ||||||
|---|---|---|---|---|---|---|---|
| Quadrant | DetID | PixID | Counts | Sigma | Mean | Median | Sigma |
| A | 8 | 5 | 1145862 | 6278.11 | 880 | 860 | 182.4 |
| A | 1 | 162 | 83695 | 454.19 | 880 | 860 | 182.4 |
| A | 1 | 178 | 20994 | 110.4 | 880 | 860 | 182.4 |
| B | 0 | 214 | 33365 | 188.36 | 887 | 865 | 172.5 |
| B | 0 | 219 | 31292 | 176.35 | 887 | 865 | 172.5 |
| B | 4 | 173 | 19377 | 107.29 | 887 | 865 | 172.5 |
| C | 14 | 234 | 34420 | 168.3 | 853 | 856 | 199.4 |
| C | 13 | 61 | 6403 | 27.81 | 853 | 856 | 199.4 |
| C | 8 | 222 | 3314 | 12.33 | 853 | 856 | 199.4 |
| D | 8 | 195 | 785288 | 3469.04 | 847 | 822 | 226.1 |
| D | 13 | 104 | 277066 | 1221.59 | 847 | 822 | 226.1 |
| D | 7 | 71 | 75921 | 332.1 | 847 | 822 | 226.1 |
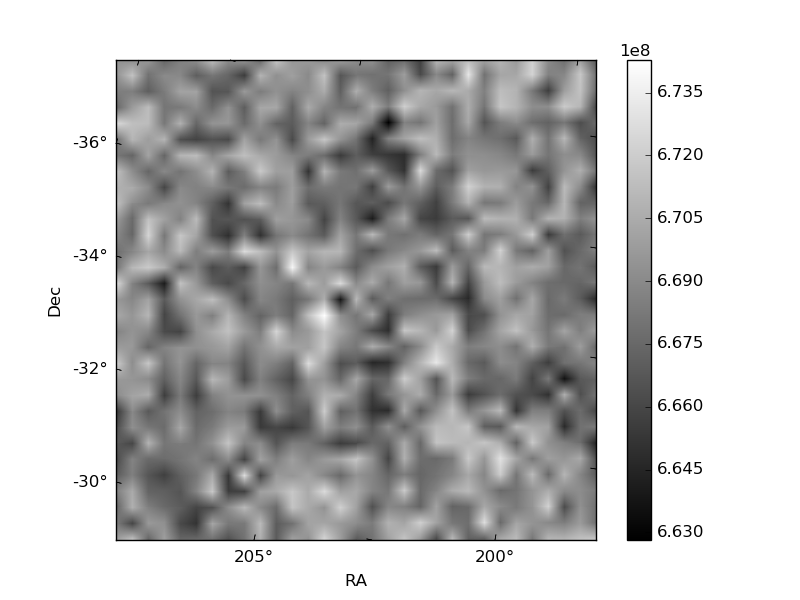
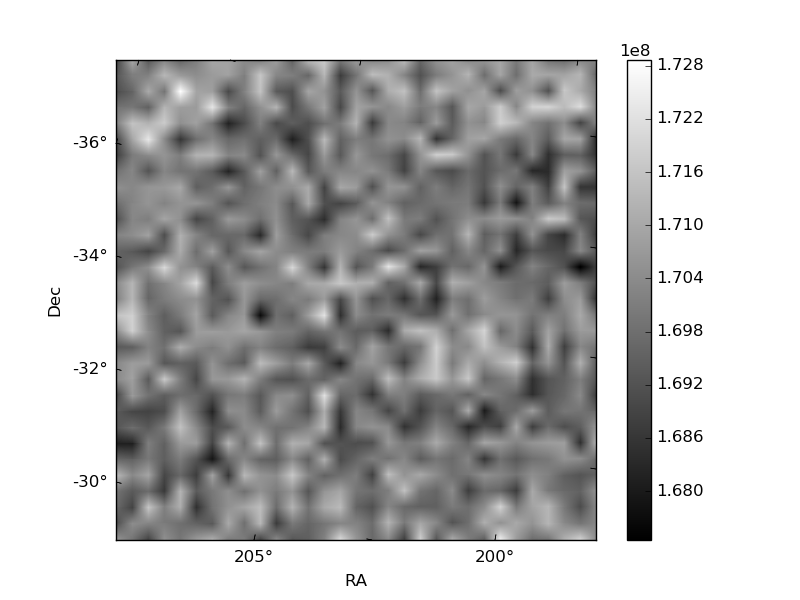
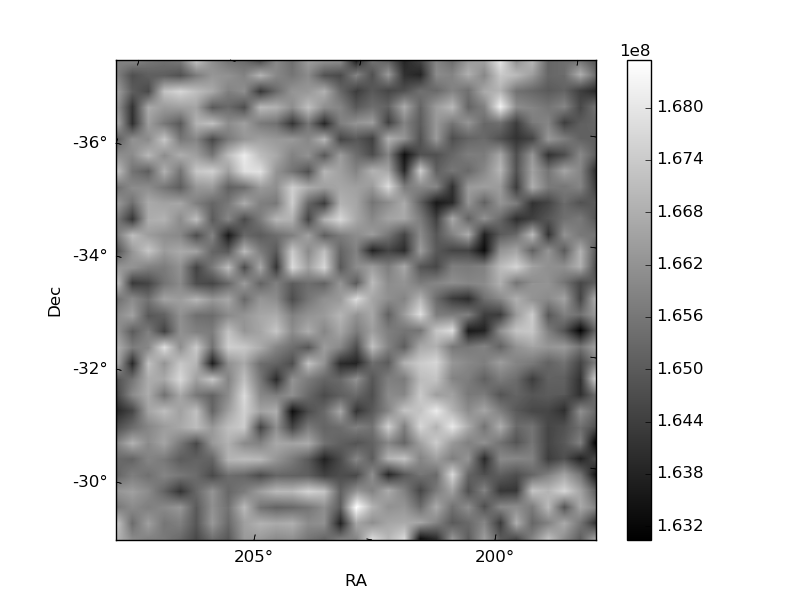
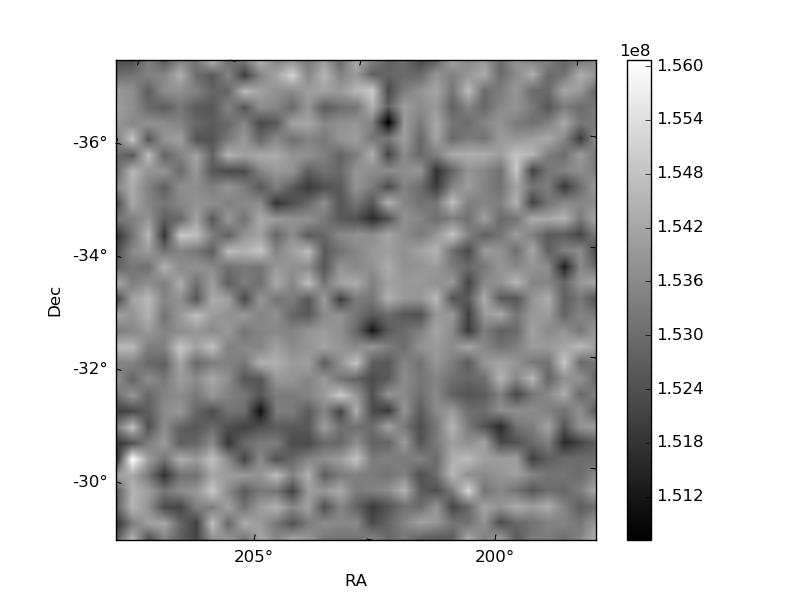
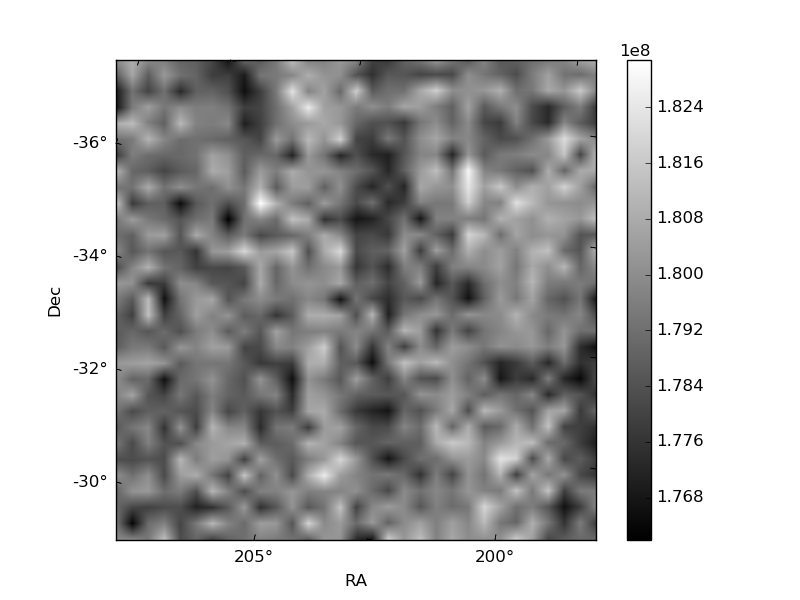
Histogram calculated using DETX and DETY for each event in the final _common_clean file
| Quadrant A | 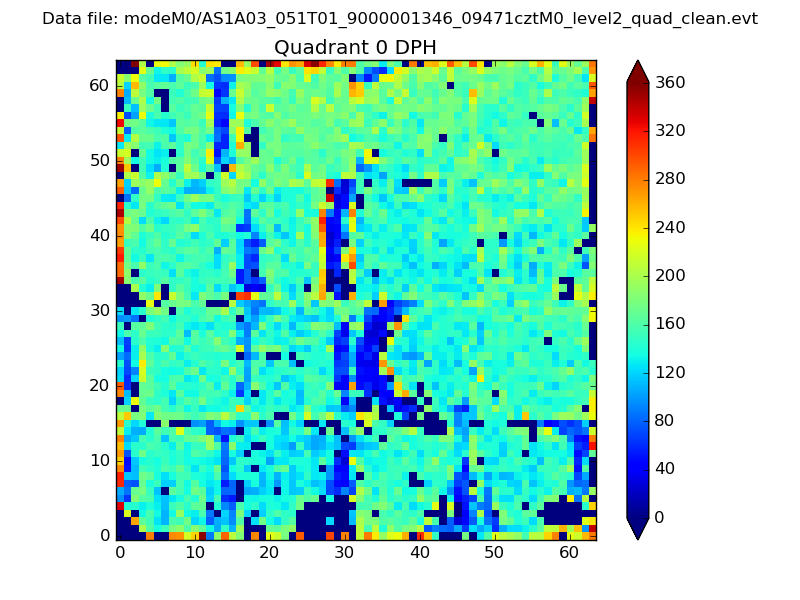 |
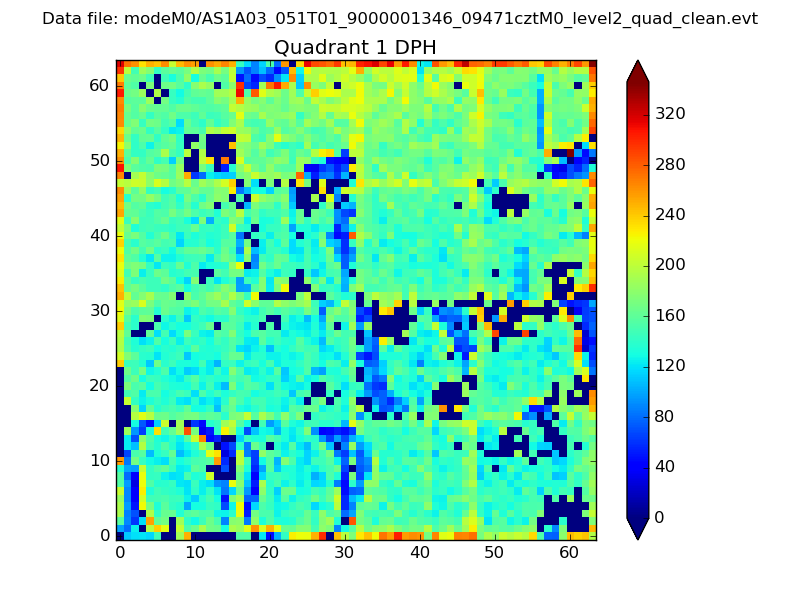 |
Quadrant B |
|---|---|---|---|
| Quadrant D | 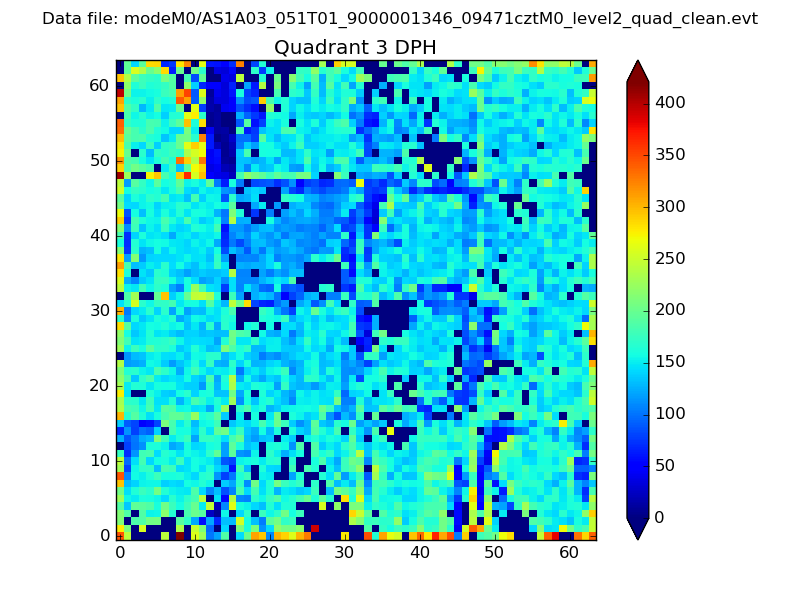 |
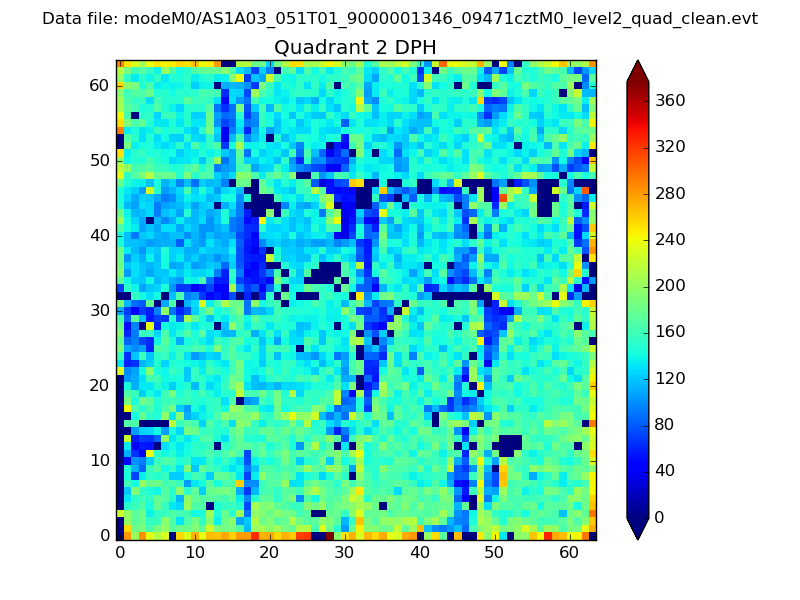 |
Quadrant C |
| Plot type | Count rate plots | Images |
|---|---|---|
| Comparison with Poisson distribution Blue bars denote a histogram of data divided into 1 sec bins. Red curve is a Poisson curve with rate = median count rate of data. |
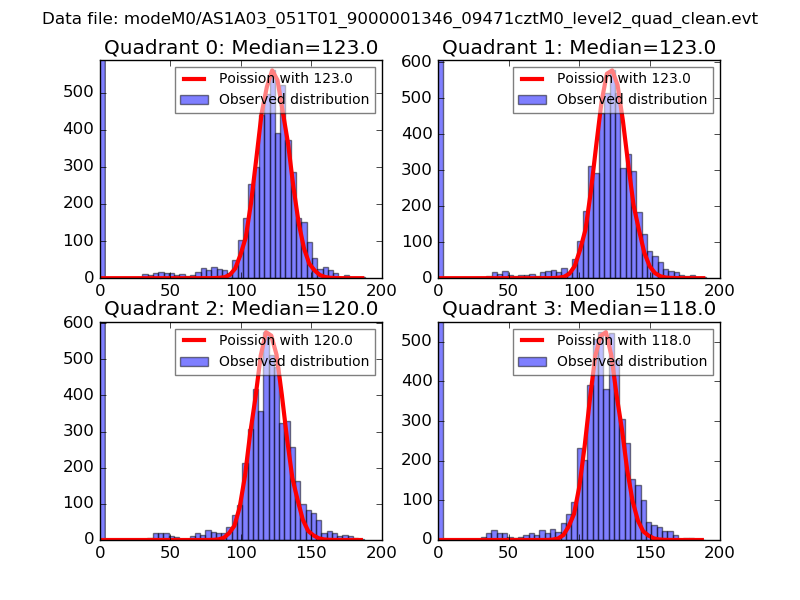 |
 |
| Quadrant-wise count rates Data is divided into 100 sec bins |
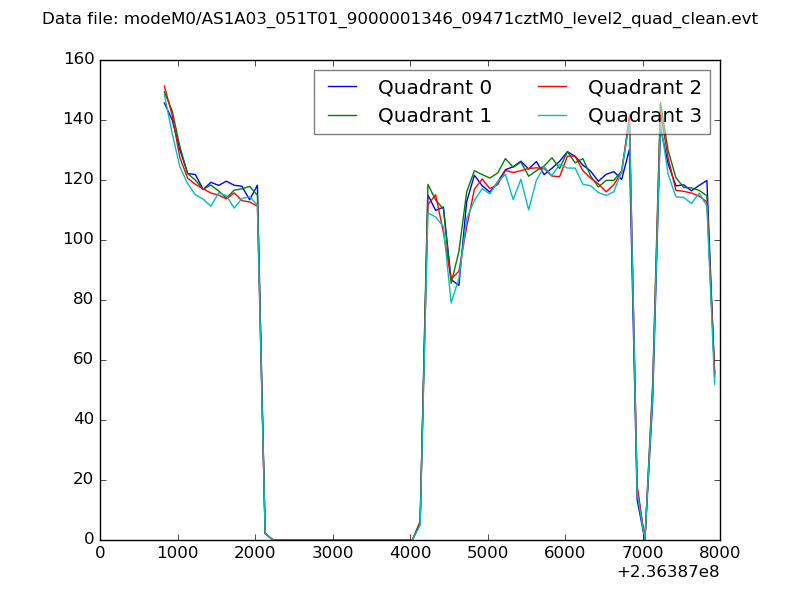 |
|
| Module-wise count rates for Quadrant A Data is divided into 100 sec bins |
 |
 |
| Module-wise count rates for Quadrant B Data is divided into 100 sec bins |
 |
 |
| Module-wise count rates for Quadrant C Data is divided into 100 sec bins |
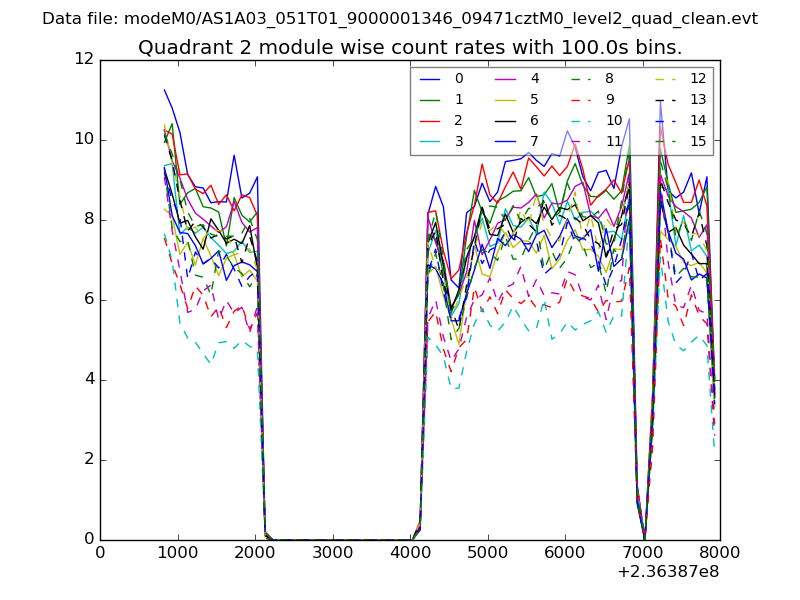 |
 |
| Module-wise count rates for Quadrant D Data is divided into 100 sec bins |
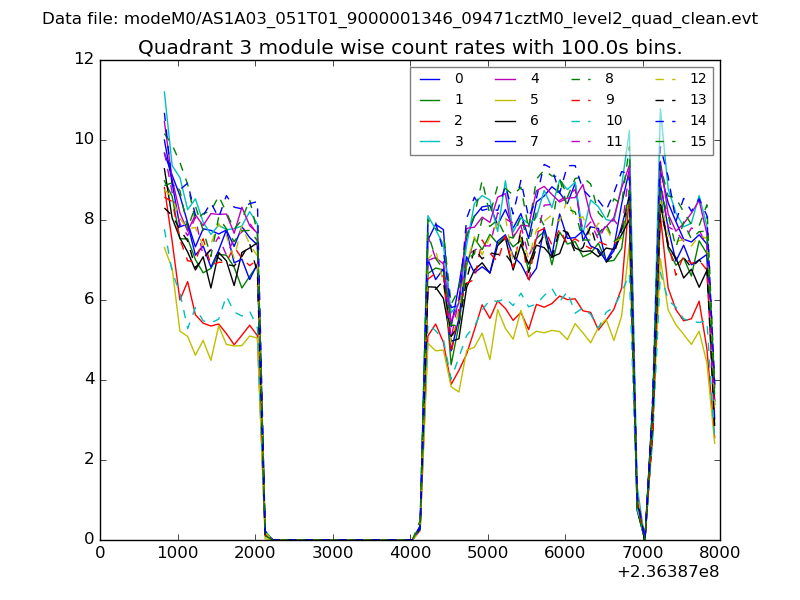 |
 |
| Parameter | Plot |
|---|---|
| CZT HV Monitor | 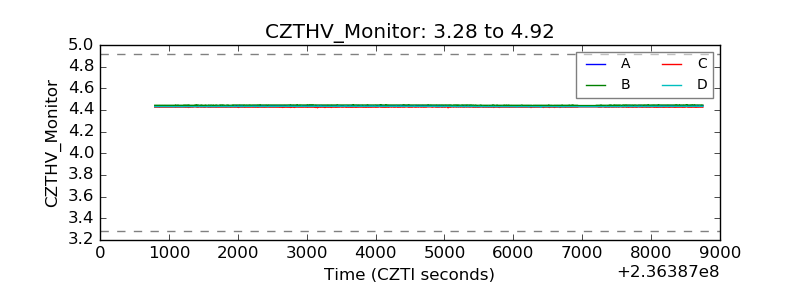 |
| D_VDD | 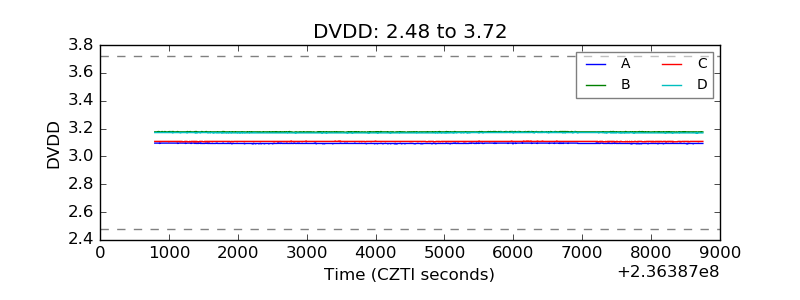 |
| Temperature 1 | 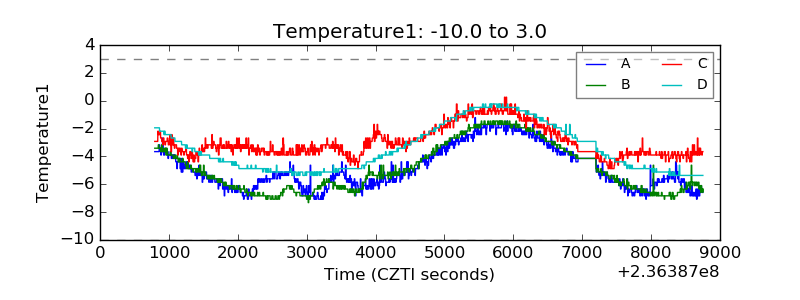 |
| Veto HV Monitor | 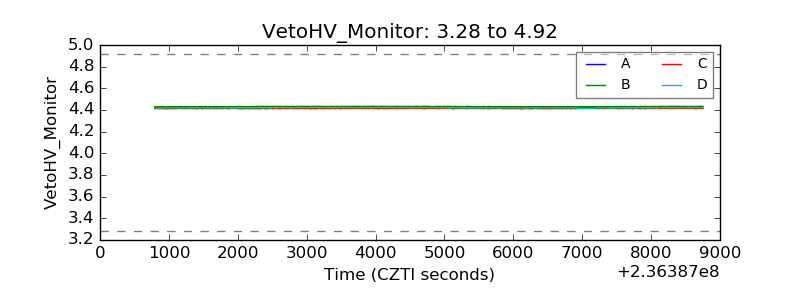 |
| Veto LLD | 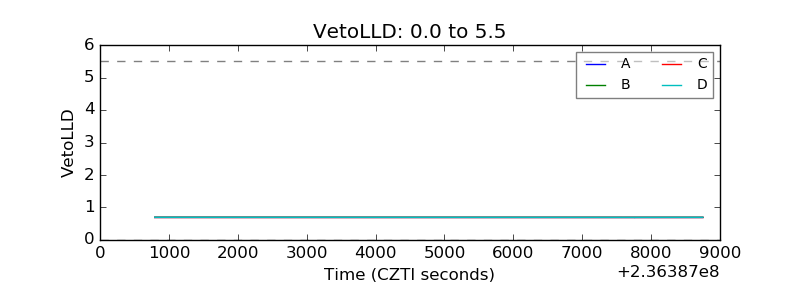 |
| Alpha Counter | 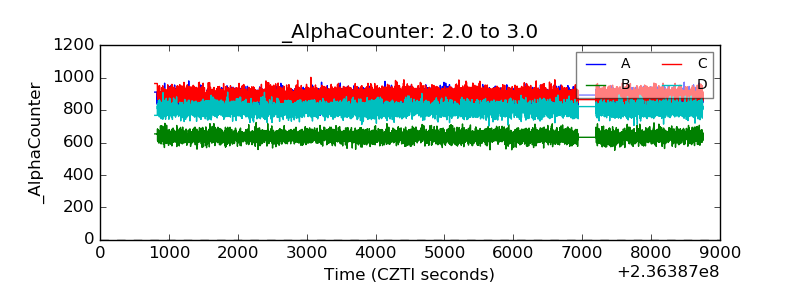 |
| _CPM_Rate | 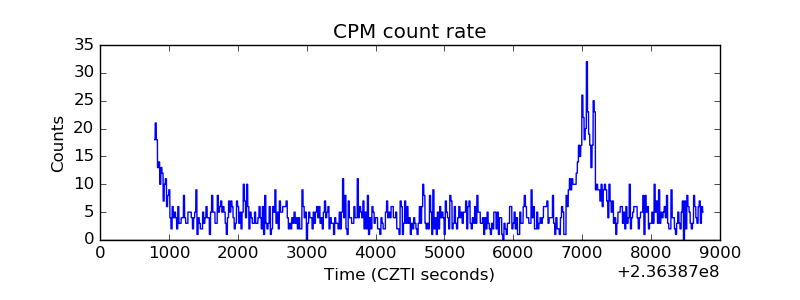 |
| CZT Counter | 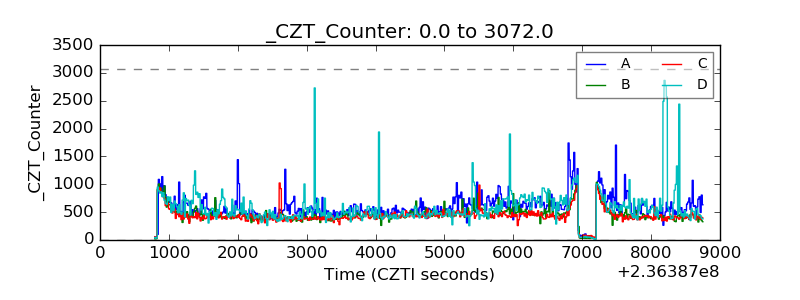 |
| +2.5 Volts monitor |  |
| +5 Volts monitor |  |
| _ROLL_ROT | 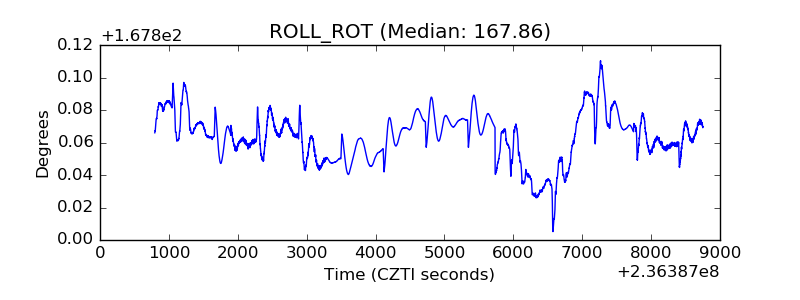 |
| _Roll_DEC | 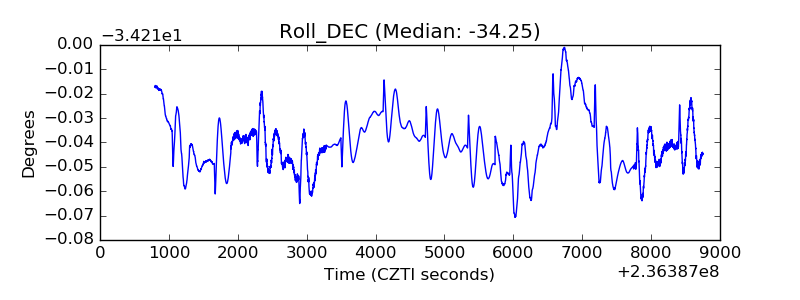 |
| _Roll_RA | 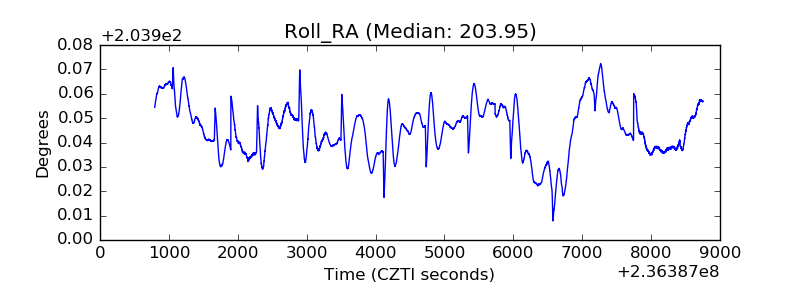 |
| Veto Counter | 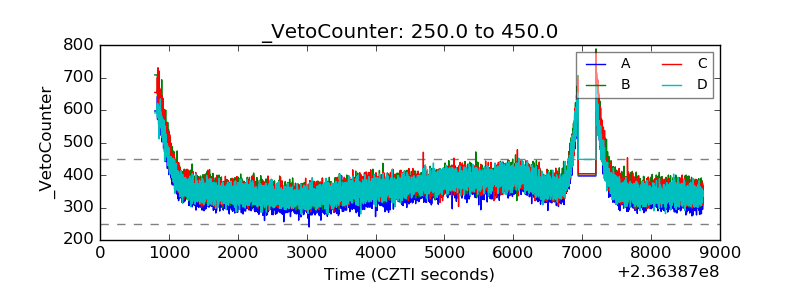 |