| Param | Original file | Final file |
|---|---|---|
| Filename | modeM0/AS1A03_051T01_9000001346_09474cztM0_level2.evt | modeM0/AS1A03_051T01_9000001346_09474cztM0_level2_quad_clean.evt |
| Size (bytes) | 567,411,840 | 99,063,360 |
| Size | 541.1 MB | 94.5 MB |
| Events in quadrant A | 4,676,162 | 568,644 |
| Events in quadrant B | 3,943,202 | 624,253 |
| Events in quadrant C | 3,828,076 | 631,125 |
| Events in quadrant D | 4,164,812 | 594,039 |
| Mode M0 | |||
|---|---|---|---|
| Quadrant | BADHDUFLAG | Total packets | Discarded packets |
| A | 0 | 45809 | 26847 |
| B | 0 | 37613 | 20166 |
| C | 0 | 37553 | 19962 |
| D | 0 | 43876 | 25879 |
| Mode M9 | |||
|---|---|---|---|
| Quadrant | BADHDUFLAG | Total packets | Discarded packets |
| A | 0 | 23 | 8 |
| B | 0 | 23 | 5 |
| C | 0 | 23 | 4 |
| D | 0 | 23 | 7 |
| Mode SS | |||
|---|---|---|---|
| Quadrant | BADHDUFLAG | Total packets | Discarded packets |
| A | 0 | 372 | 185 |
| B | 0 | 375 | 192 |
| C | 0 | 375 | 205 |
| D | 0 | 375 | 178 |
| Quadrant | Total seconds | Saturated seconds | Saturation percentage |
|---|---|---|---|
| A | 7804 | 80 | 1.025115% |
| B | 8527 | 79 | 0.926469% |
| C | 8633 | 48 | 0.556006% |
| D | 8161 | 69 | 0.845485% |
Noise dominated data is calculated using 1-second bins in cleaned event files. If a bin has >2000 counts, and if more than 50% of those come from <1% of pixels, then it is considered to be noise-dominated and hence unusable.
| Quadrant | # 1 sec bins | Bins with >0 counts | Bins with >2000 counts | High rate bins dominated by noise | Noise dominated (total time) | Noise dominated (detector-on time) | Marked lightcurve |
|---|---|---|---|---|---|---|---|
| A | 20747 | 11139 | 2 | 2 | 0.01% | 0.02% | 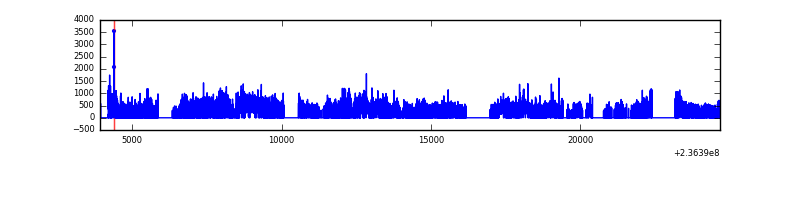 |
| B | 20746 | 11899 | 0 | 0 | 0.00% | 0.00% | 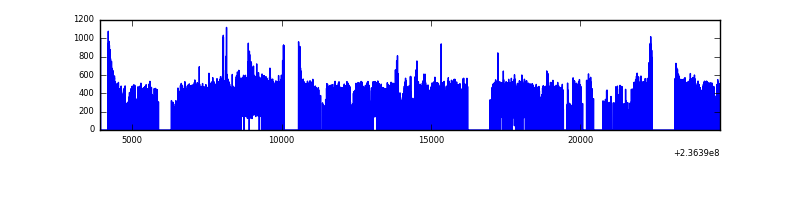 |
| C | 20740 | 12033 | 0 | 0 | 0.00% | 0.00% | 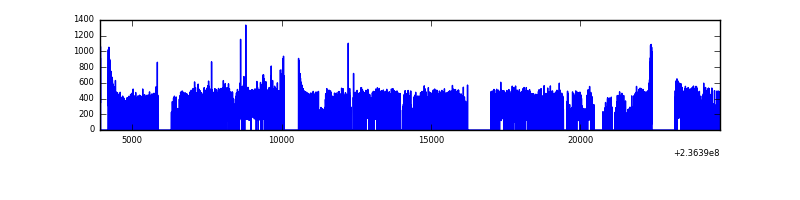 |
| D | 20730 | 11407 | 6 | 6 | 0.03% | 0.05% | 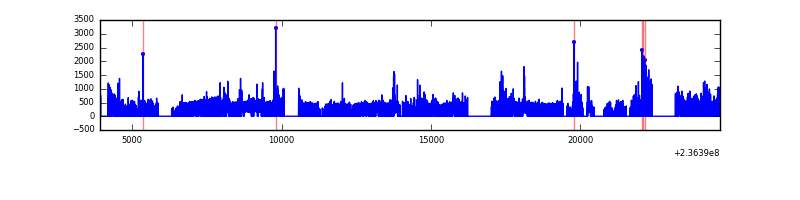 |
Top three noisy pixels from each quadrant. If the there are fewer than three noisy pixels in the level2.evt file, extra rows are filled as -1
| Pixel properties | Quadrant properties | ||||||
|---|---|---|---|---|---|---|---|
| Quadrant | DetID | PixID | Counts | Sigma | Mean | Median | Sigma |
| A | 8 | 5 | 1061508 | 5695.96 | 907 | 885 | 186.2 |
| A | 1 | 162 | 68552 | 363.4 | 907 | 885 | 186.2 |
| A | 1 | 178 | 23184 | 119.75 | 907 | 885 | 186.2 |
| B | 0 | 214 | 47975 | 245.94 | 995 | 971 | 191.1 |
| B | 12 | 111 | 21083 | 105.23 | 995 | 971 | 191.1 |
| B | 11 | 111 | 17306 | 85.47 | 995 | 971 | 191.1 |
| C | 5 | 128 | 17642 | 73.26 | 973 | 977 | 227.5 |
| C | 13 | 61 | 7322 | 27.89 | 973 | 977 | 227.5 |
| C | 12 | 4 | 4797 | 16.79 | 973 | 977 | 227.5 |
| D | 8 | 195 | 290289 | 1275.53 | 915 | 890 | 226.9 |
| D | 1 | 52 | 242186 | 1063.51 | 915 | 890 | 226.9 |
| D | 13 | 104 | 65698 | 285.64 | 915 | 890 | 226.9 |
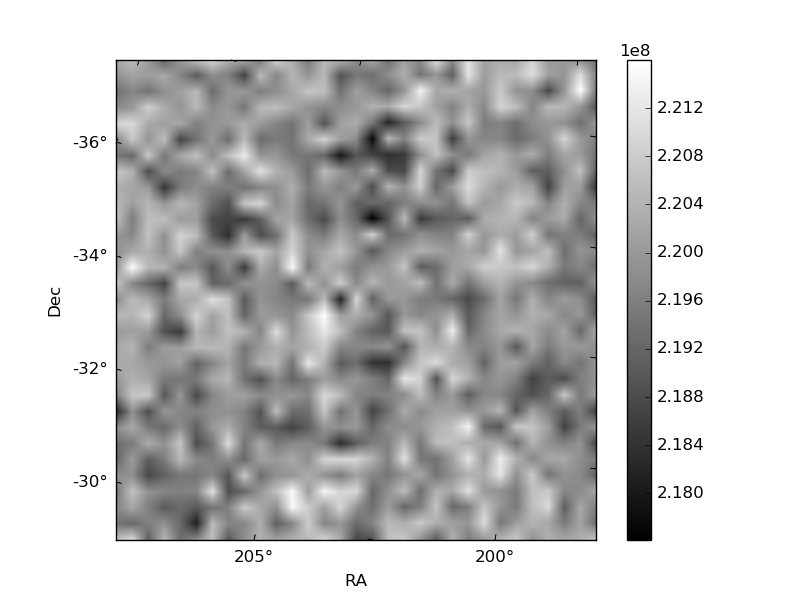
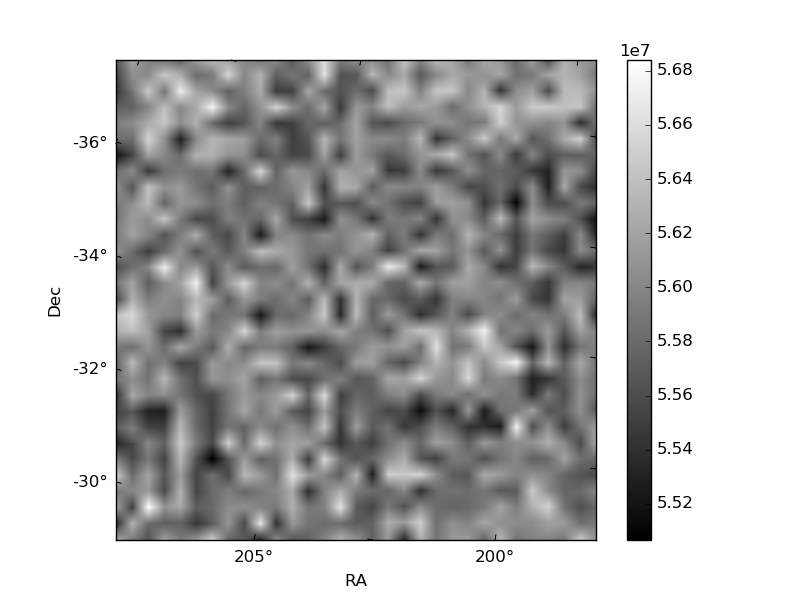
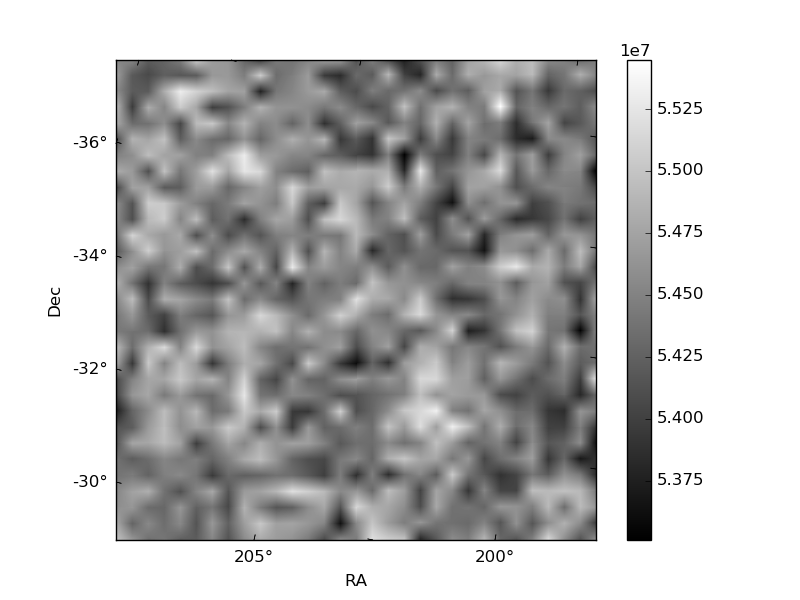
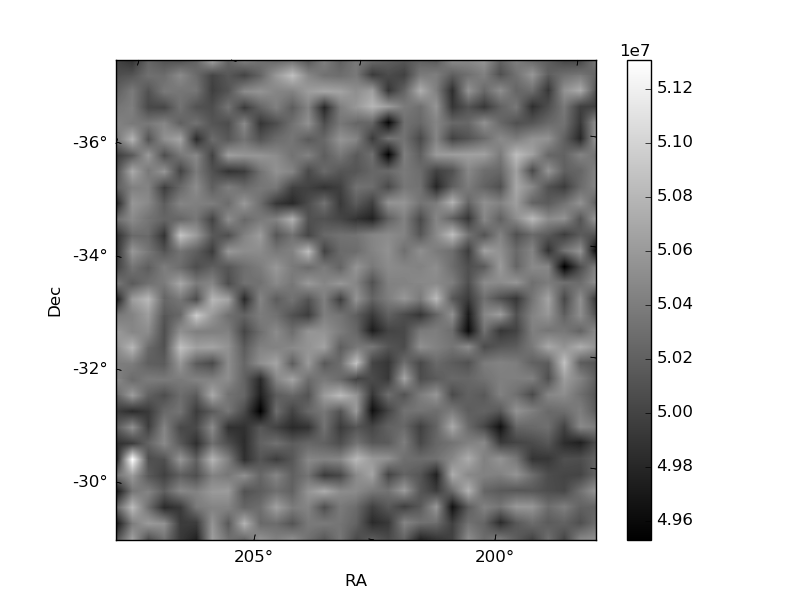
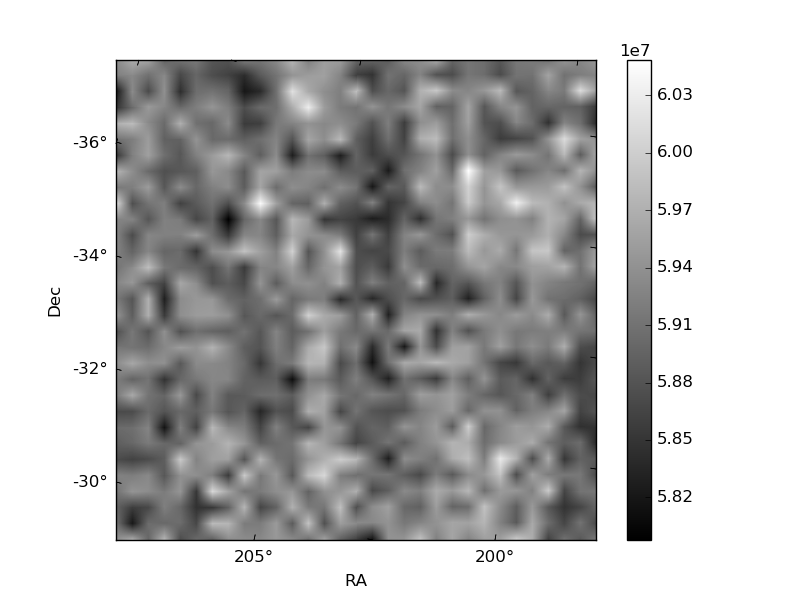
Histogram calculated using DETX and DETY for each event in the final _common_clean file
| Quadrant A | 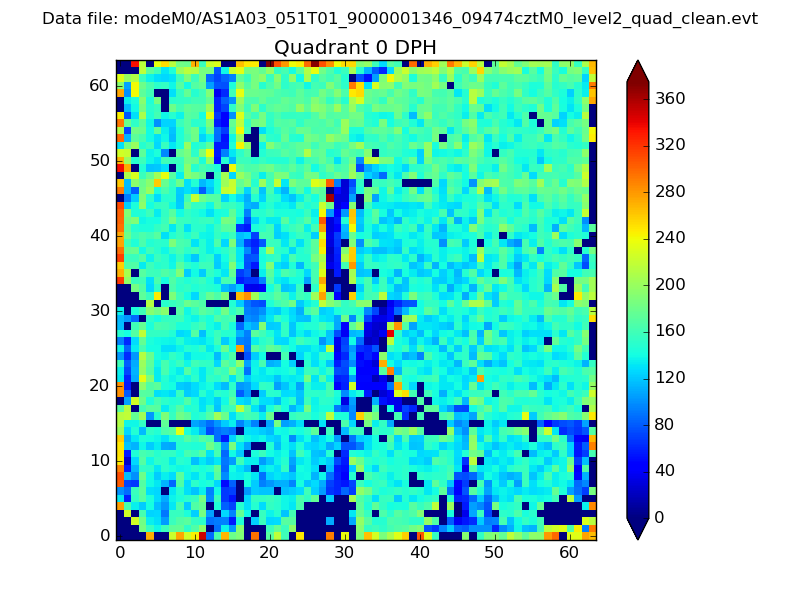 |
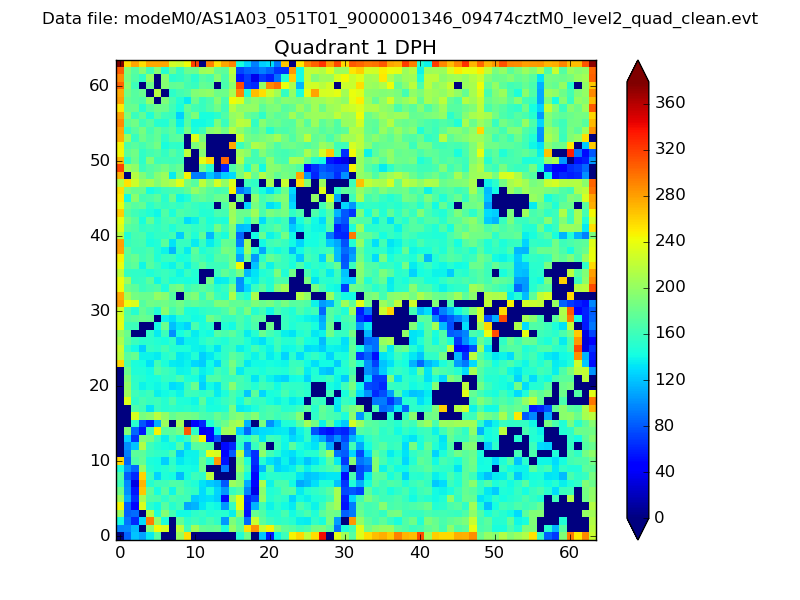 |
Quadrant B |
|---|---|---|---|
| Quadrant D | 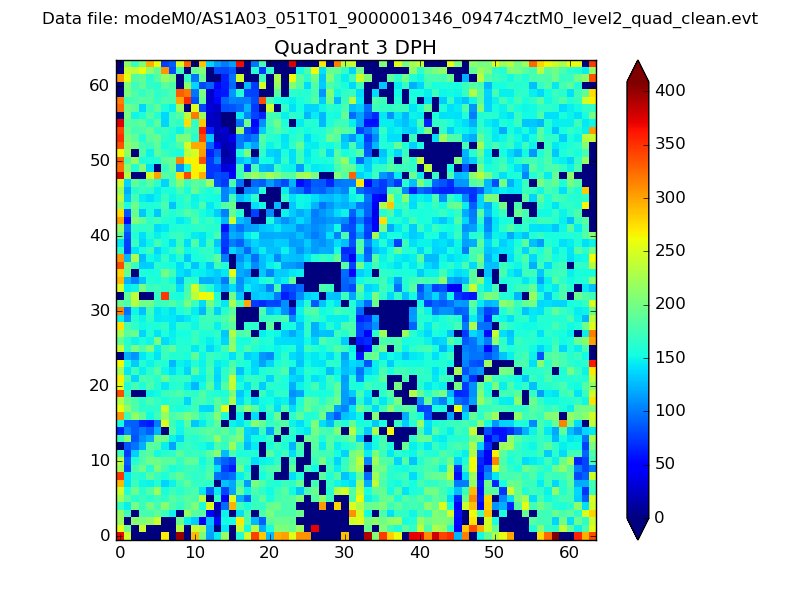 |
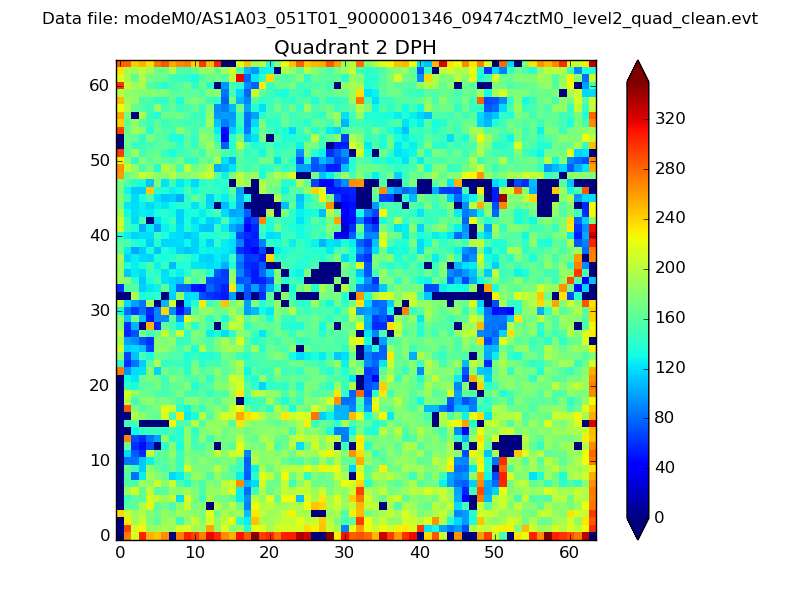 |
Quadrant C |
| Plot type | Count rate plots | Images |
|---|---|---|
| Comparison with Poisson distribution Blue bars denote a histogram of data divided into 1 sec bins. Red curve is a Poisson curve with rate = median count rate of data. |
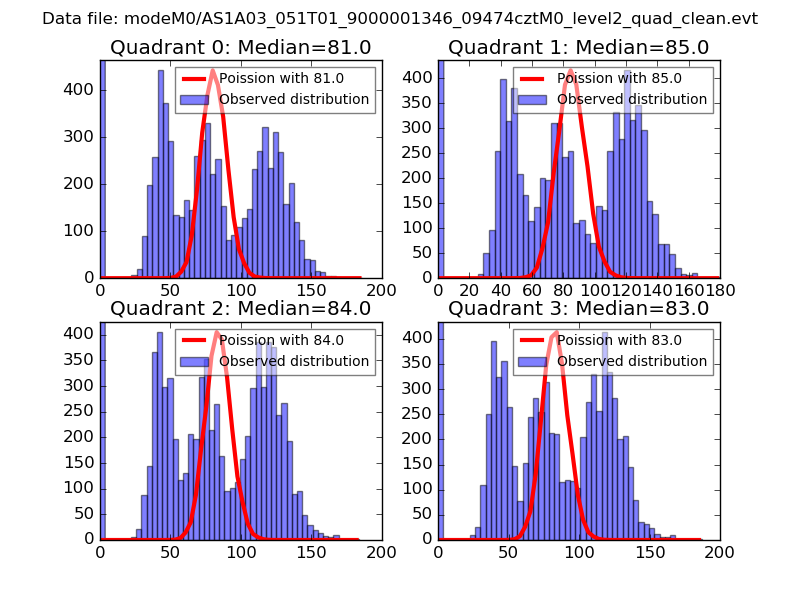 |
 |
| Quadrant-wise count rates Data is divided into 100 sec bins |
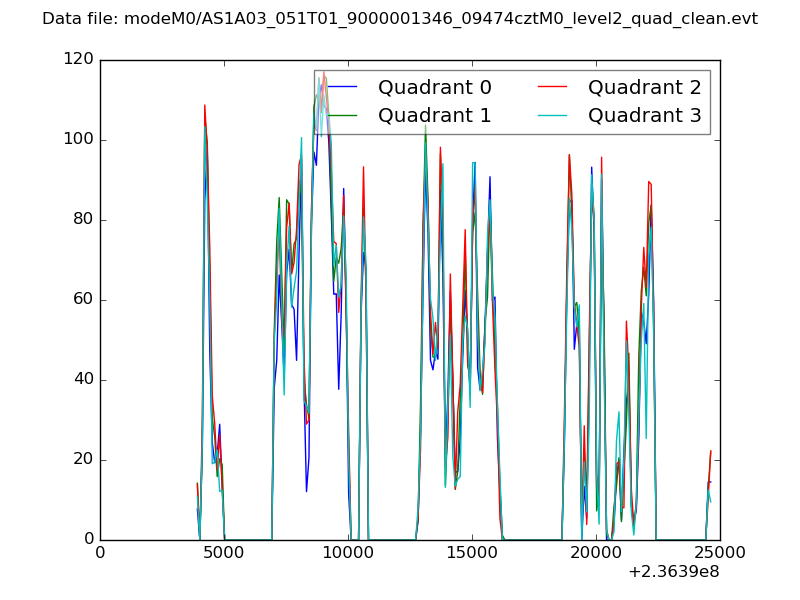 |
|
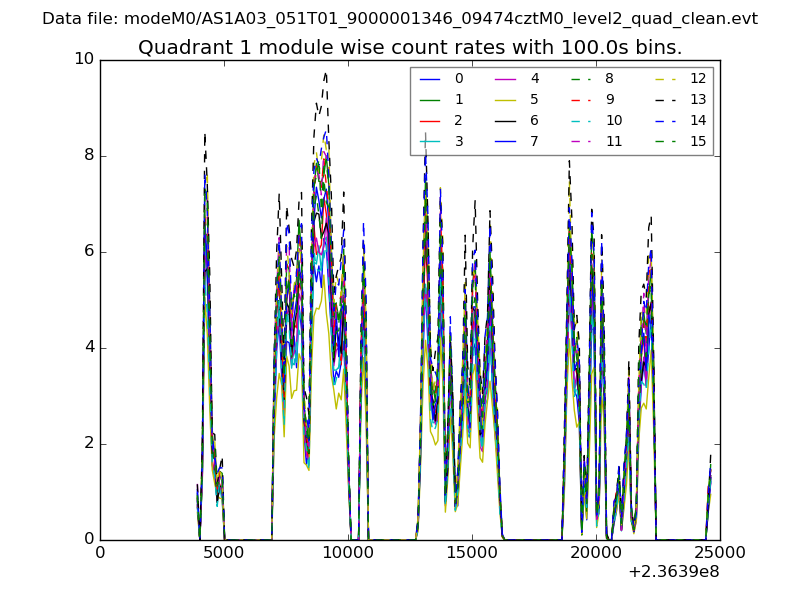
| Module-wise count rates for Quadrant A Data is divided into 100 sec bins |
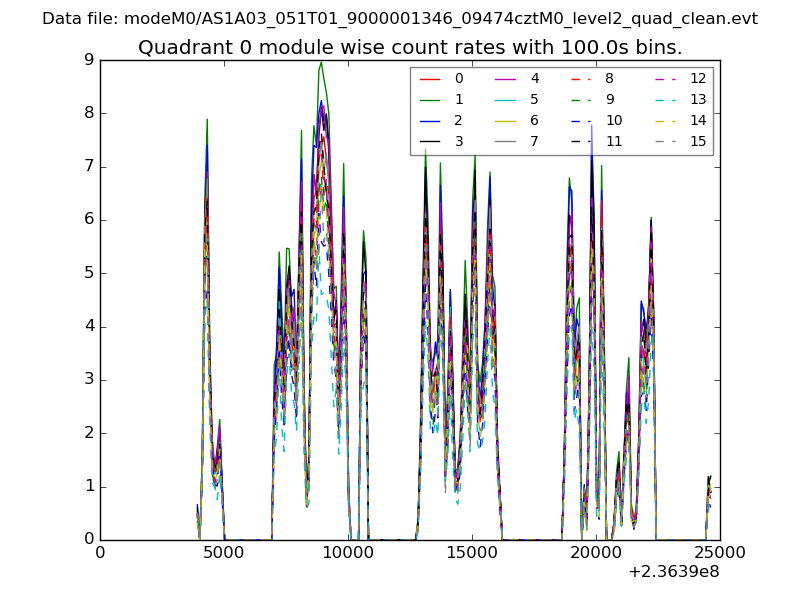 |
 |
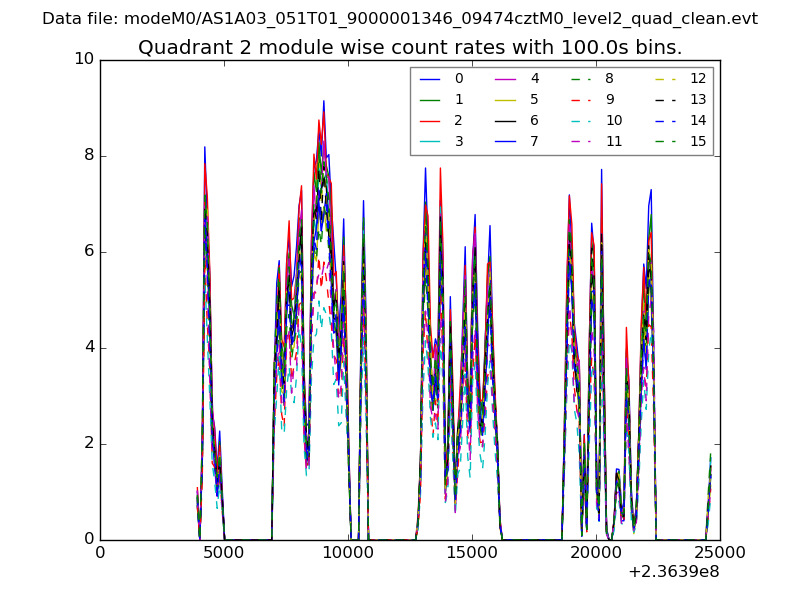
| Module-wise count rates for Quadrant B Data is divided into 100 sec bins |
 |
 |
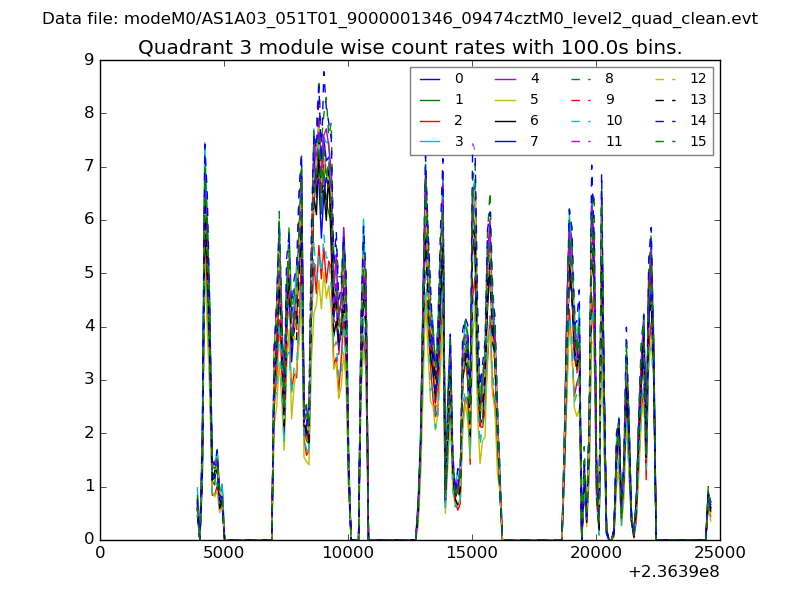
| Module-wise count rates for Quadrant C Data is divided into 100 sec bins |
 |
 |
| Module-wise count rates for Quadrant D Data is divided into 100 sec bins |
 |
 |
| Parameter | Plot |
|---|---|
| CZT HV Monitor | 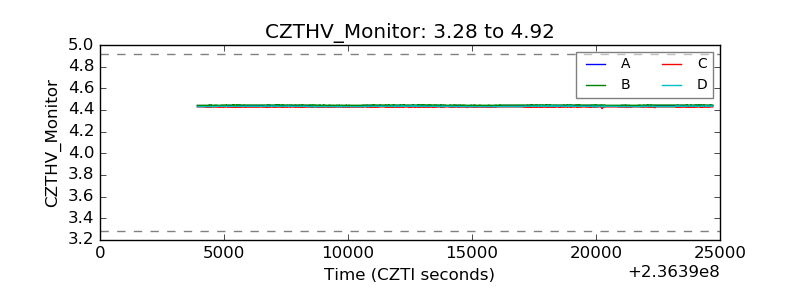 |
| D_VDD | 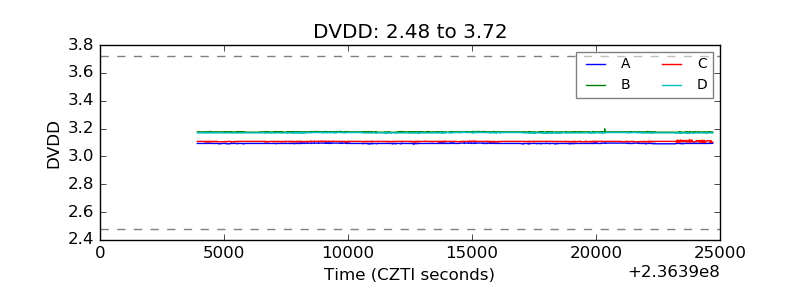 |
| Temperature 1 | 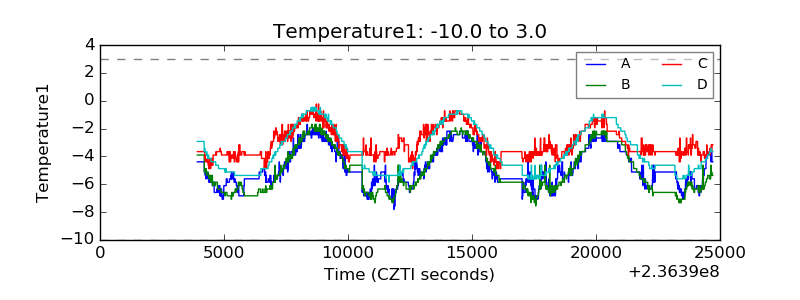 |
| Veto HV Monitor |  |
| Veto LLD | 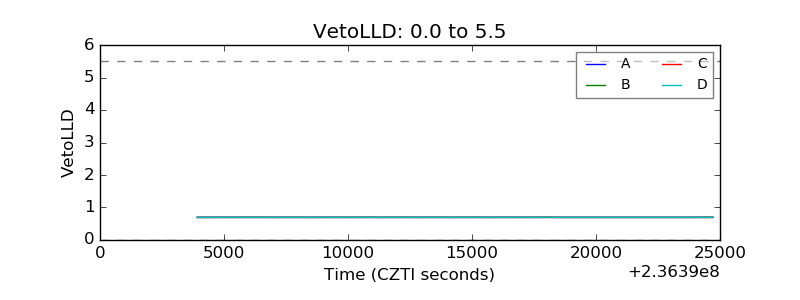 |
| Alpha Counter | 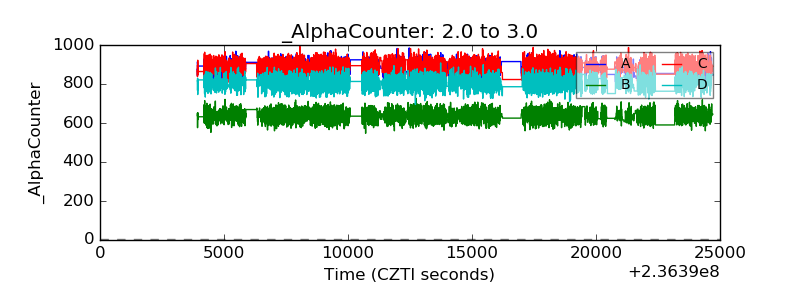 |
| _CPM_Rate | 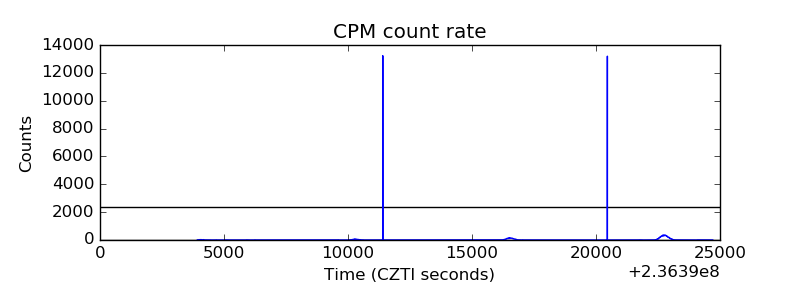 |
| CZT Counter | 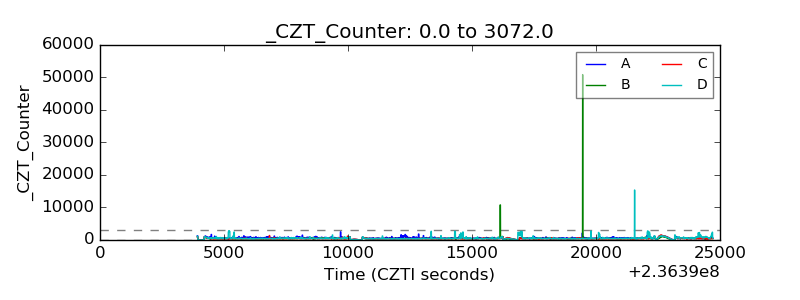 |
| +2.5 Volts monitor |  |
| +5 Volts monitor | 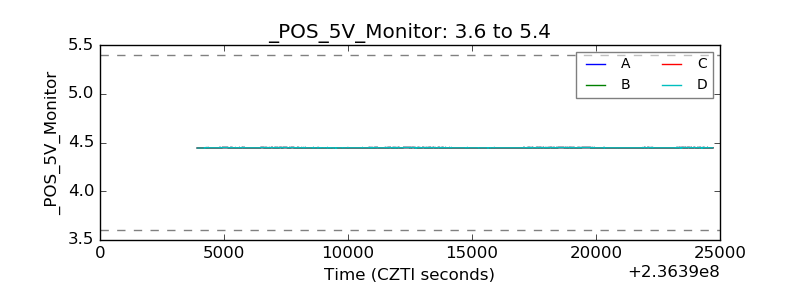 |
| _ROLL_ROT | 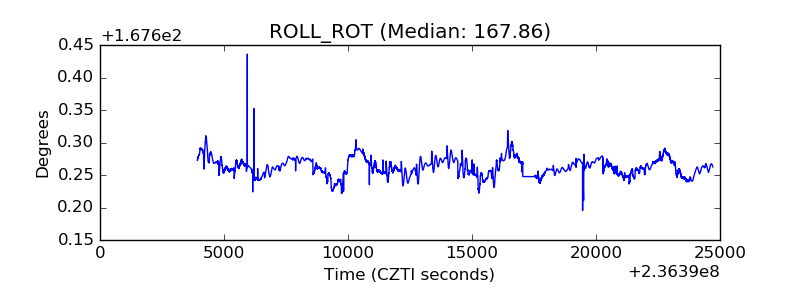 |
| _Roll_DEC | 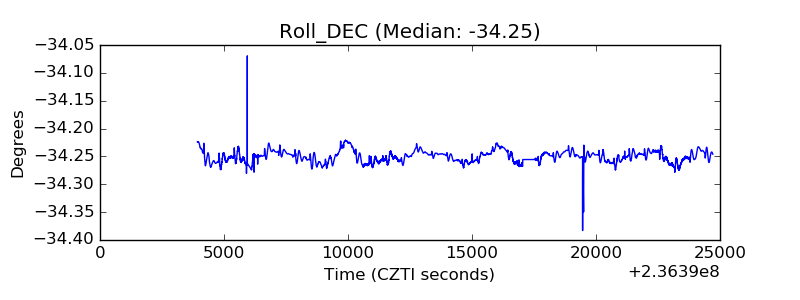 |
| _Roll_RA | 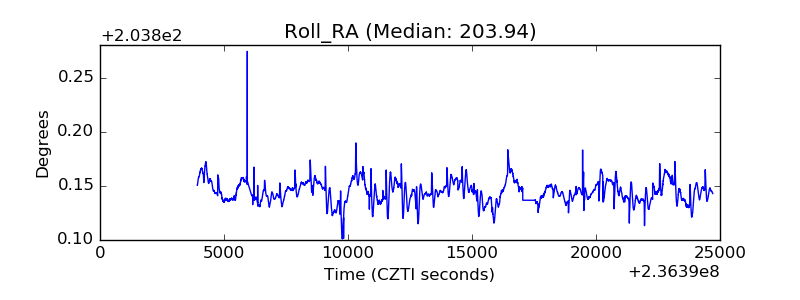 |
| Veto Counter | 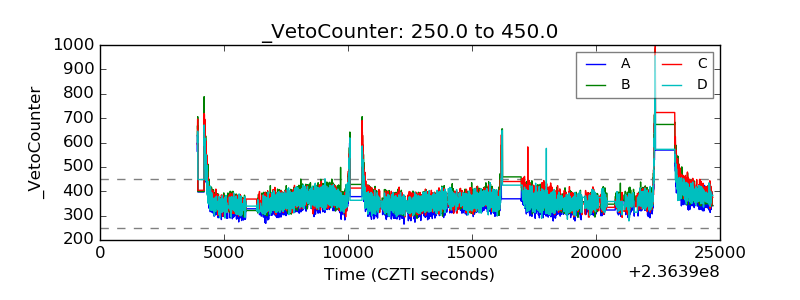 |