| Param | Original file | Final file |
|---|---|---|
| Filename | modeM0/AS1A03_051T01_9000001346_09475cztM0_level2.evt | modeM0/AS1A03_051T01_9000001346_09475cztM0_level2_quad_clean.evt |
| Size (bytes) | 20,511,360 | 3,862,080 |
| Size | 19.6 MB | 3.7 MB |
| Events in quadrant A | 147,583 | 21,327 |
| Events in quadrant B | 169,764 | 25,834 |
| Events in quadrant C | 151,359 | 24,424 |
| Events in quadrant D | 128,397 | 15,905 |
| Mode M0 | |||
|---|---|---|---|
| Quadrant | BADHDUFLAG | Total packets | Discarded packets |
| A | 0 | 14972 | 14383 |
| B | 0 | 12929 | 12215 |
| C | 0 | 13208 | 12560 |
| D | 0 | 19720 | 19189 |
| Mode M9 | |||
|---|---|---|---|
| Quadrant | BADHDUFLAG | Total packets | Discarded packets |
| A | 0 | 9 | 8 |
| B | 0 | 9 | 4 |
| C | 0 | 8 | 5 |
| D | 0 | 10 | 8 |
| Mode SS | |||
|---|---|---|---|
| Quadrant | BADHDUFLAG | Total packets | Discarded packets |
| A | 0 | 131 | 125 |
| B | 0 | 133 | 125 |
| C | 0 | 128 | 118 |
| D | 0 | 131 | 128 |
| Quadrant | Total seconds | Saturated seconds | Saturation percentage |
|---|---|---|---|
| A | 272 | 1 | 0.367647% |
| B | 352 | 4 | 1.136364% |
| C | 310 | 0 | 0.000000% |
| D | 234 | 1 | 0.427350% |
Noise dominated data is calculated using 1-second bins in cleaned event files. If a bin has >2000 counts, and if more than 50% of those come from <1% of pixels, then it is considered to be noise-dominated and hence unusable.
| Quadrant | # 1 sec bins | Bins with >0 counts | Bins with >2000 counts | High rate bins dominated by noise | Noise dominated (total time) | Noise dominated (detector-on time) | Marked lightcurve |
|---|---|---|---|---|---|---|---|
| A | 6195 | 477 | 0 | 0 | 0.00% | 0.00% | 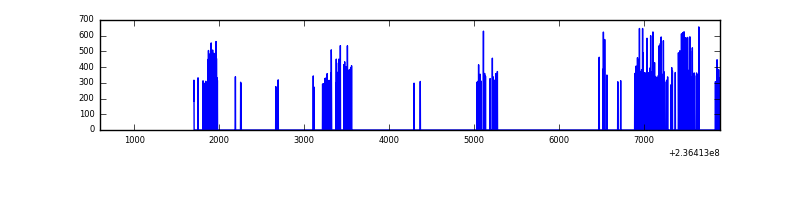 |
| B | 6224 | 644 | 0 | 0 | 0.00% | 0.00% | 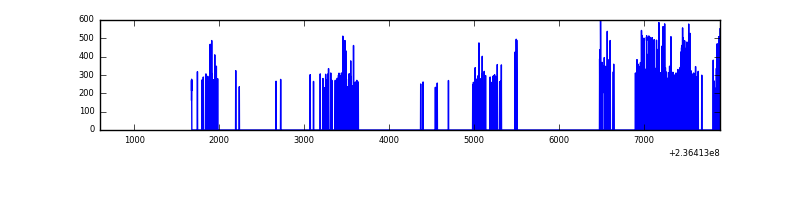 |
| C | 7296 | 556 | 0 | 0 | 0.00% | 0.00% | 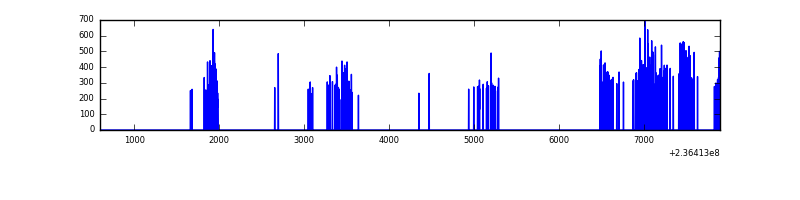 |
| D | 6077 | 403 | 0 | 0 | 0.00% | 0.00% | 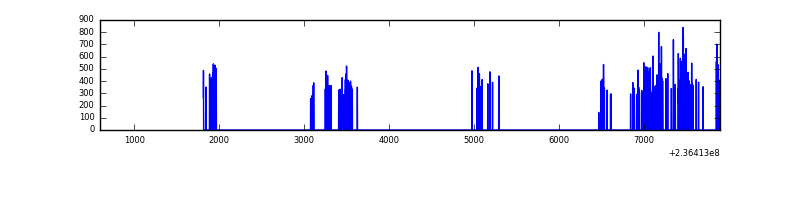 |
Top three noisy pixels from each quadrant. If the there are fewer than three noisy pixels in the level2.evt file, extra rows are filled as -1
| Pixel properties | Quadrant properties | ||||||
|---|---|---|---|---|---|---|---|
| Quadrant | DetID | PixID | Counts | Sigma | Mean | Median | Sigma |
| A | 8 | 5 | 20244 | 2281.94 | 32 | 32 | 8.9 |
| A | 1 | 162 | 730 | 78.8 | 32 | 32 | 8.9 |
| A | 12 | 194 | 275 | 27.43 | 32 | 32 | 8.9 |
| B | 12 | 111 | 930 | 84.23 | 43 | 42 | 10.5 |
| B | 0 | 214 | 779 | 69.91 | 43 | 42 | 10.5 |
| B | 11 | 111 | 734 | 65.64 | 43 | 42 | 10.5 |
| C | 9 | 68 | 6435 | 614.08 | 36 | 36 | 10.4 |
| C | 14 | 234 | 895 | 82.43 | 36 | 36 | 10.4 |
| C | 8 | 128 | 352 | 30.33 | 36 | 36 | 10.4 |
| D | 8 | 195 | 16637 | 1994.32 | 27 | 26 | 8.3 |
| D | 1 | 52 | 6373 | 762.02 | 27 | 26 | 8.3 |
| D | 2 | 234 | 1008 | 117.9 | 27 | 26 | 8.3 |
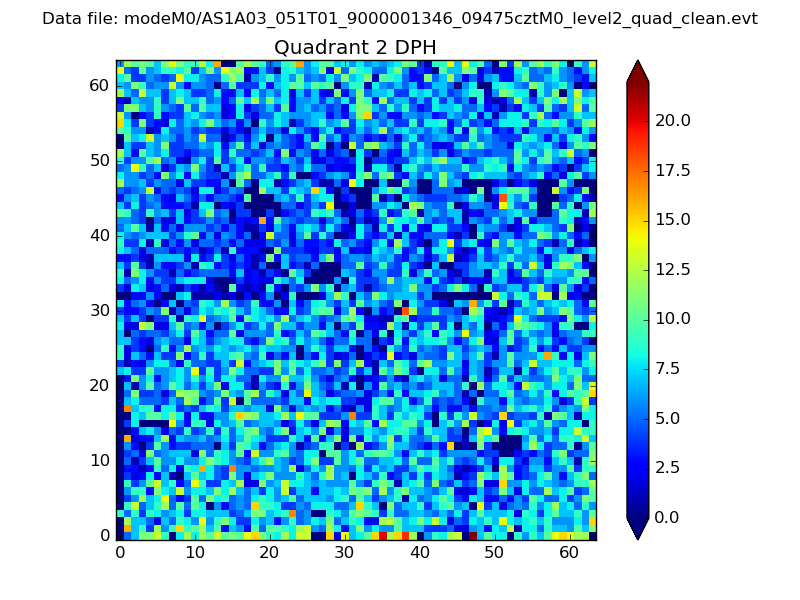
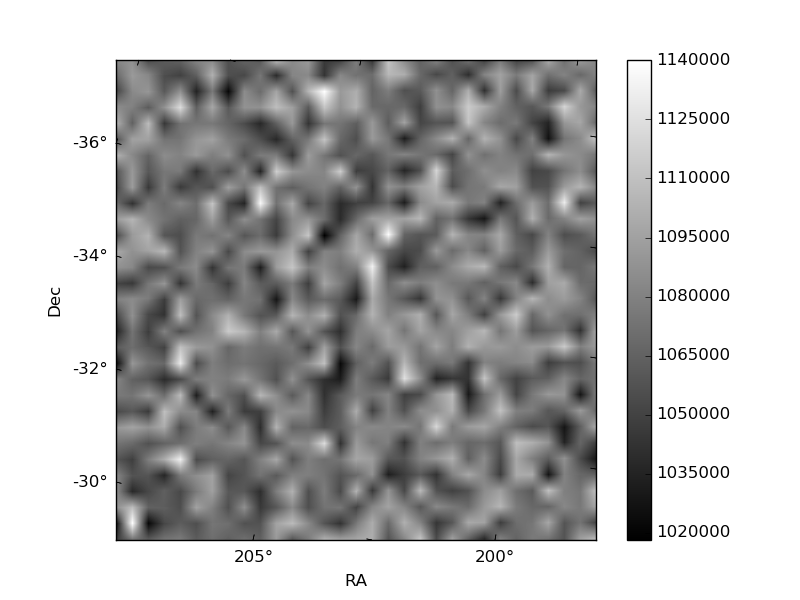
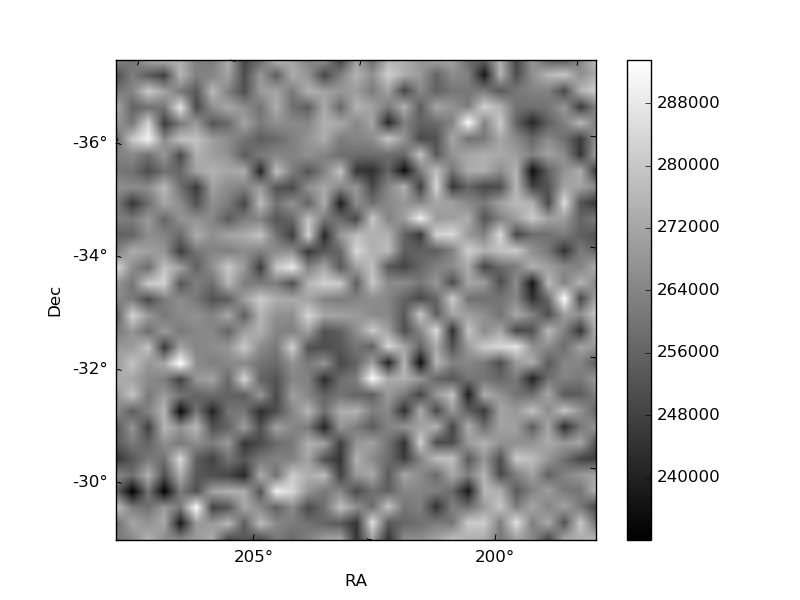
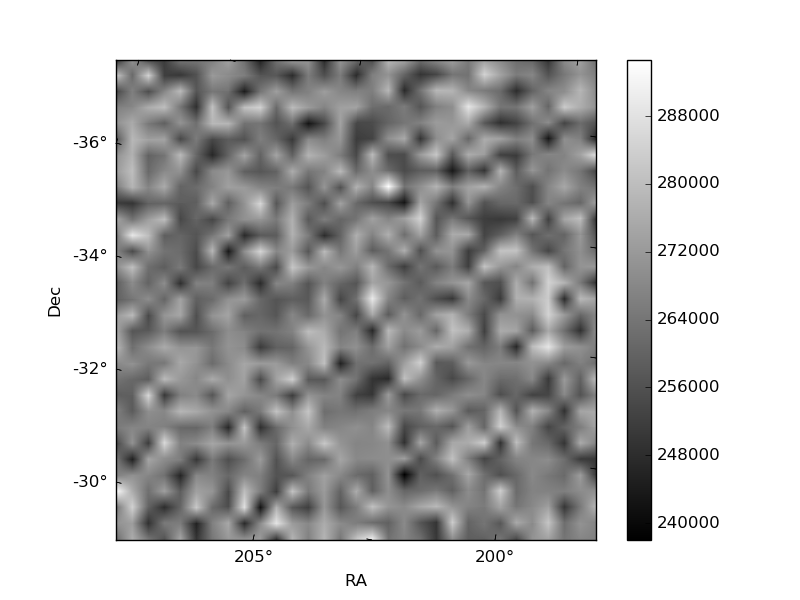
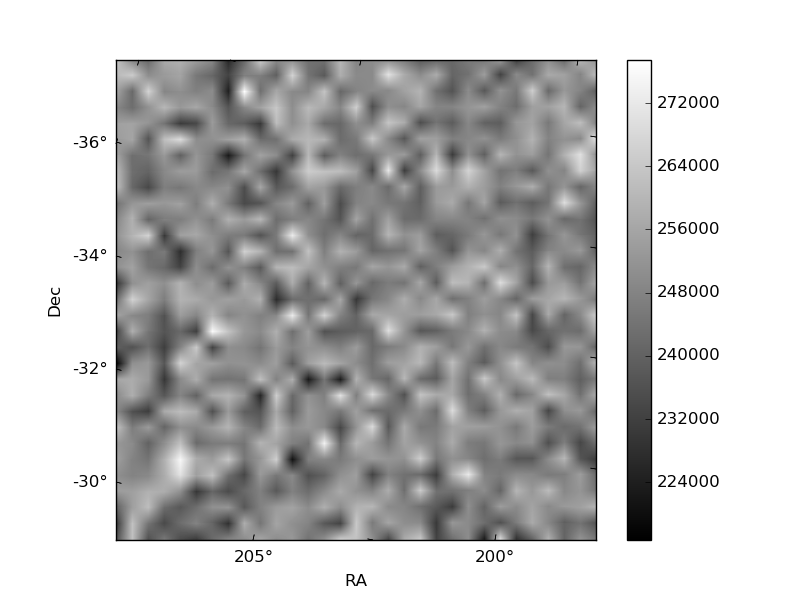
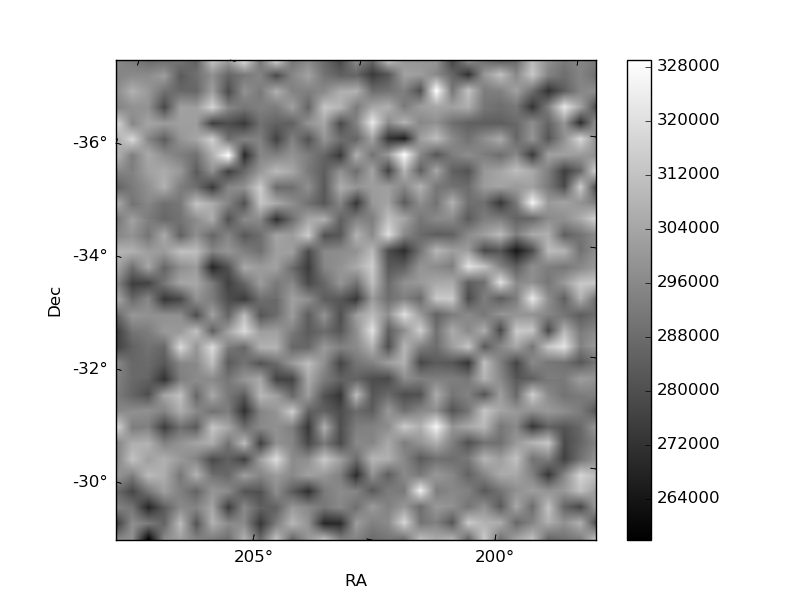
Histogram calculated using DETX and DETY for each event in the final _common_clean file
| Quadrant A | 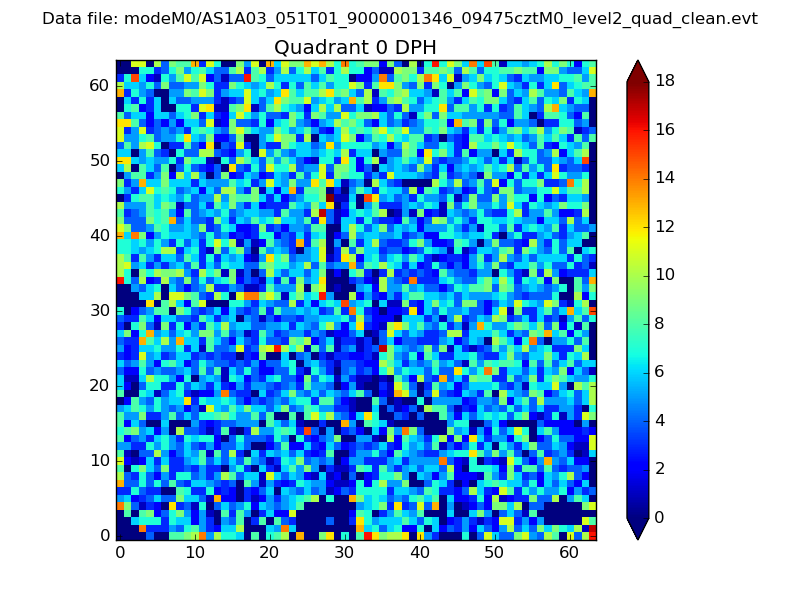 |
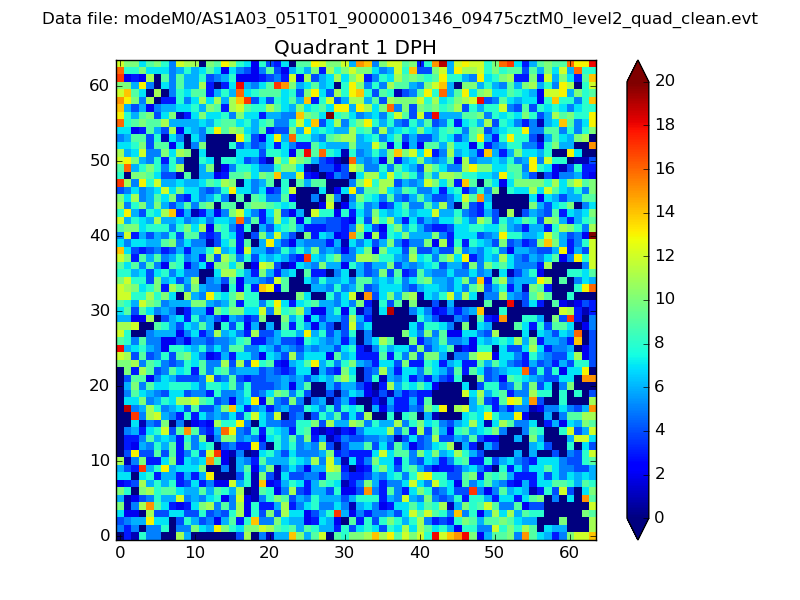 |
Quadrant B |
|---|---|---|---|
| Quadrant D | 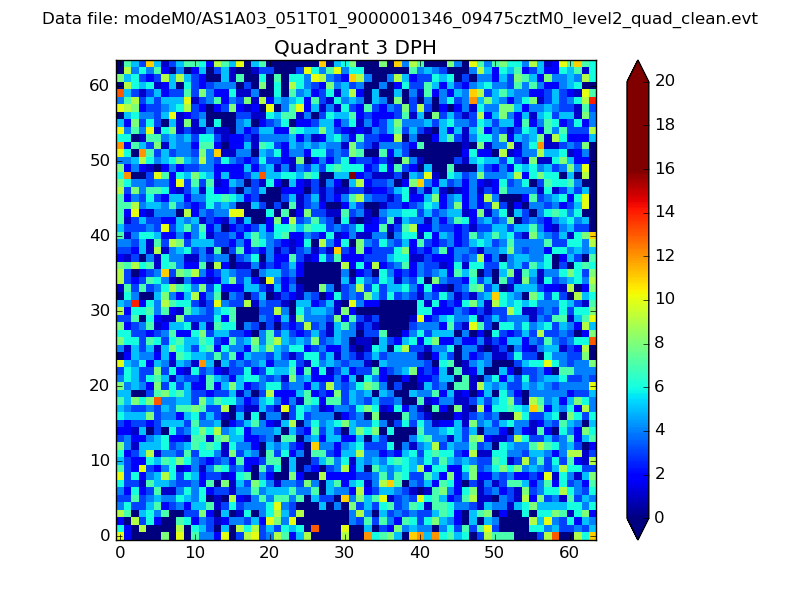 |
 |
Quadrant C |
| Plot type | Count rate plots | Images |
|---|---|---|
| Comparison with Poisson distribution Blue bars denote a histogram of data divided into 1 sec bins. Red curve is a Poisson curve with rate = median count rate of data. |
 |
 |
| Quadrant-wise count rates Data is divided into 100 sec bins |
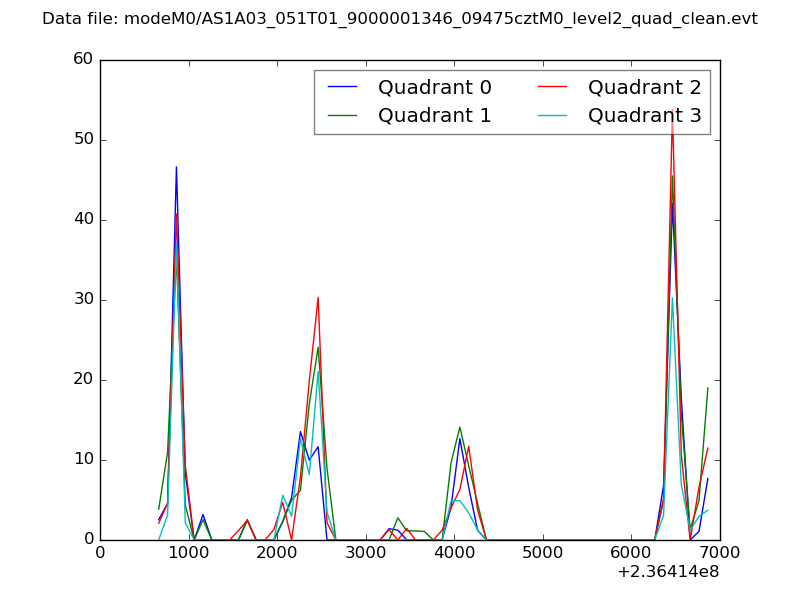 |
|
| Module-wise count rates for Quadrant A Data is divided into 100 sec bins |
 |
 |
| Module-wise count rates for Quadrant B Data is divided into 100 sec bins |
 |
 |
| Module-wise count rates for Quadrant C Data is divided into 100 sec bins |
 |
 |
| Module-wise count rates for Quadrant D Data is divided into 100 sec bins |
 |
 |
| Parameter | Plot |
|---|---|
| CZT HV Monitor | 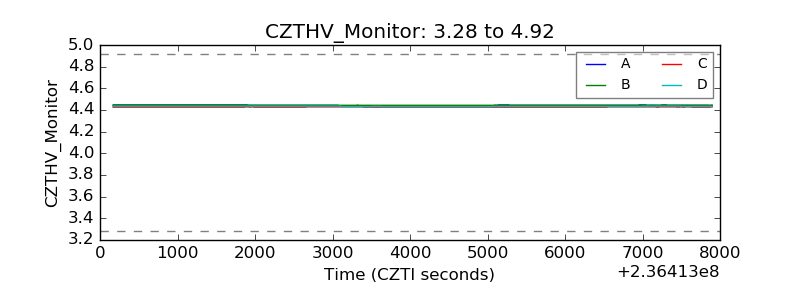 |
| D_VDD | 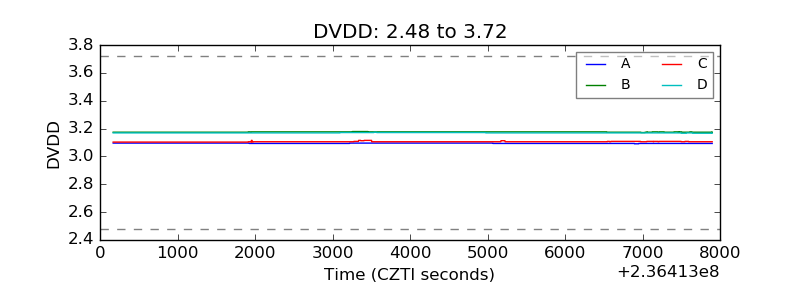 |
| Temperature 1 |  |
| Veto HV Monitor | 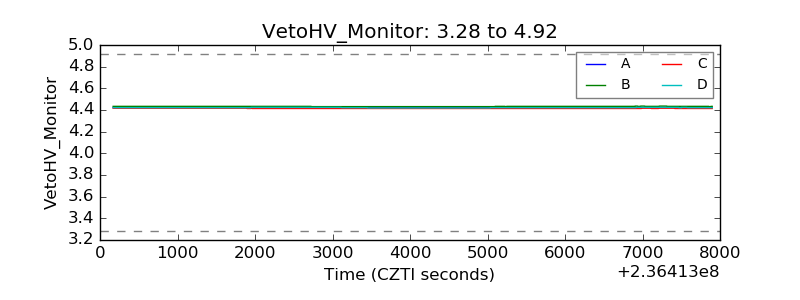 |
| Veto LLD | 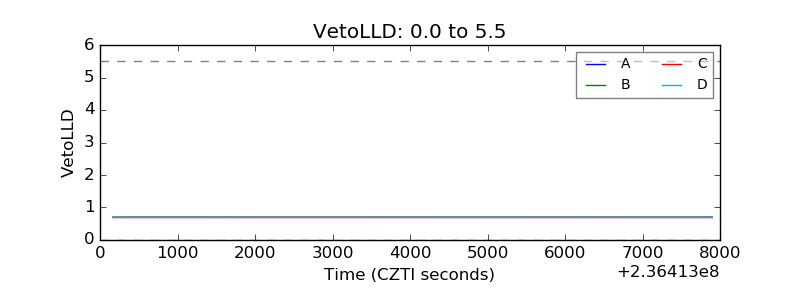 |
| Alpha Counter | 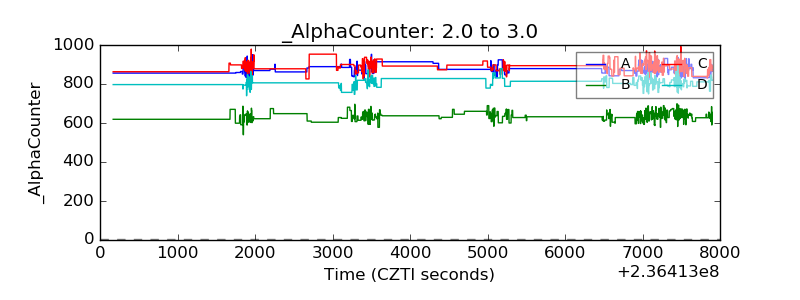 |
| _CPM_Rate | 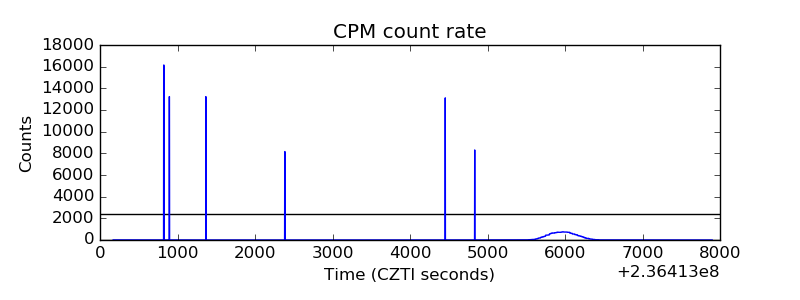 |
| CZT Counter |  |
| +2.5 Volts monitor |  |
| +5 Volts monitor |  |
| _ROLL_ROT |  |
| _Roll_DEC |  |
| _Roll_RA | 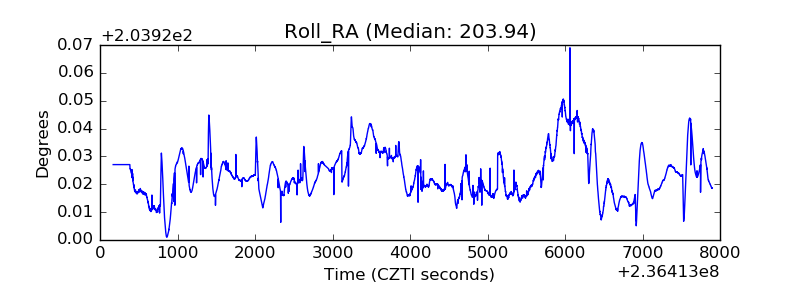 |
| Veto Counter |  |