| Param | Original file | Final file |
|---|---|---|
| Filename | modeM0/AS1A03_051T01_9000001346_09479cztM0_level2.evt | modeM0/AS1A03_051T01_9000001346_09479cztM0_level2_quad_clean.evt |
| Size (bytes) | 225,673,920 | 55,215,360 |
| Size | 215.2 MB | 52.7 MB |
| Events in quadrant A | 1,601,773 | 382,464 |
| Events in quadrant B | 1,459,682 | 377,745 |
| Events in quadrant C | 1,338,542 | 366,167 |
| Events in quadrant D | 2,248,891 | 351,651 |
| Mode M0 | |||
|---|---|---|---|
| Quadrant | BADHDUFLAG | Total packets | Discarded packets |
| A | 0 | 6549 | 1 |
| B | 0 | 6079 | 1 |
| C | 0 | 5779 | 1 |
| D | 0 | 8707 | 1 |
| Mode SS | |||
|---|---|---|---|
| Quadrant | BADHDUFLAG | Total packets | Discarded packets |
| A | 0 | 54 | 0 |
| B | 0 | 54 | 0 |
| C | 0 | 54 | 0 |
| D | 0 | 54 | 0 |
| Quadrant | Total seconds | Saturated seconds | Saturation percentage |
|---|---|---|---|
| A | 2709 | 14 | 0.516796% |
| B | 2709 | 16 | 0.590624% |
| C | 2709 | 4 | 0.147656% |
| D | 2710 | 121 | 4.464945% |
Noise dominated data is calculated using 1-second bins in cleaned event files. If a bin has >2000 counts, and if more than 50% of those come from <1% of pixels, then it is considered to be noise-dominated and hence unusable.
| Quadrant | # 1 sec bins | Bins with >0 counts | Bins with >2000 counts | High rate bins dominated by noise | Noise dominated (total time) | Noise dominated (detector-on time) | Marked lightcurve |
|---|---|---|---|---|---|---|---|
| A | 2709 | 2709 | 2 | 2 | 0.07% | 0.07% | 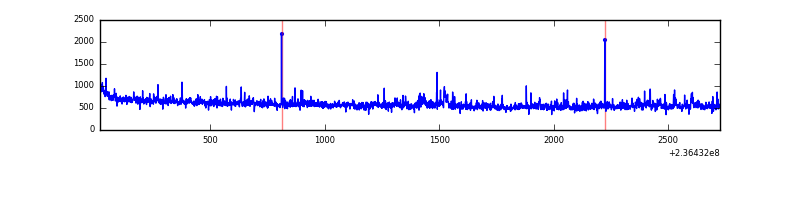 |
| B | 2709 | 2709 | 0 | 0 | 0.00% | 0.00% | 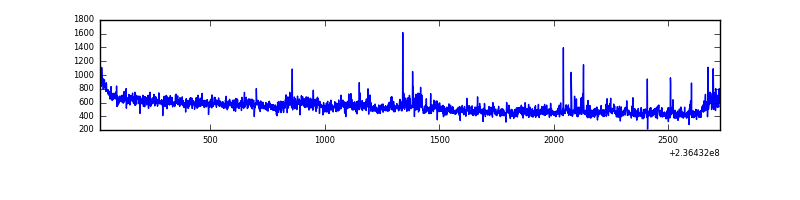 |
| C | 2709 | 2709 | 0 | 0 | 0.00% | 0.00% | 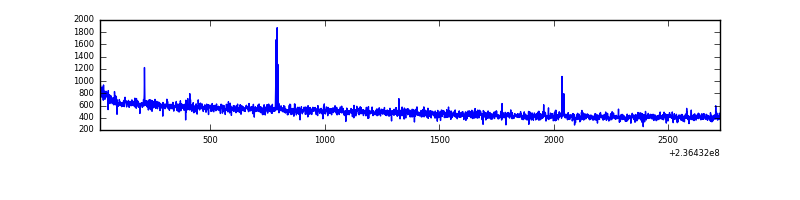 |
| D | 2710 | 2710 | 109 | 109 | 4.02% | 4.02% | 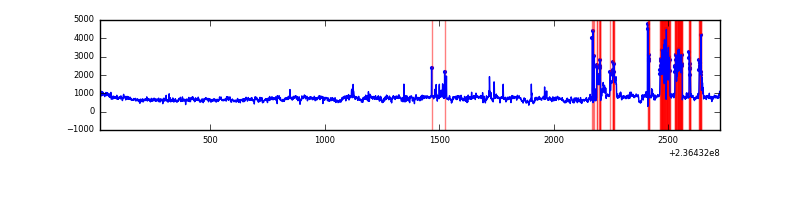 |
Top three noisy pixels from each quadrant. If the there are fewer than three noisy pixels in the level2.evt file, extra rows are filled as -1
| Pixel properties | Quadrant properties | ||||||
|---|---|---|---|---|---|---|---|
| Quadrant | DetID | PixID | Counts | Sigma | Mean | Median | Sigma |
| A | 8 | 5 | 186566 | 2518.05 | 364 | 357 | 73.9 |
| A | 1 | 162 | 10139 | 132.28 | 364 | 357 | 73.9 |
| A | 0 | 226 | 3433 | 41.6 | 364 | 357 | 73.9 |
| B | 4 | 173 | 35483 | 520.25 | 352 | 345 | 67.5 |
| B | 0 | 219 | 26902 | 393.2 | 352 | 345 | 67.5 |
| B | 0 | 187 | 15507 | 224.49 | 352 | 345 | 67.5 |
| C | 14 | 234 | 8667 | 105.41 | 340 | 341 | 79.0 |
| C | 13 | 61 | 2542 | 27.87 | 340 | 341 | 79.0 |
| C | 9 | 68 | 1807 | 18.56 | 340 | 341 | 79.0 |
| D | 8 | 195 | 527688 | 6182.59 | 344 | 335 | 85.3 |
| D | 7 | 71 | 319189 | 3738.19 | 344 | 335 | 85.3 |
| D | 13 | 169 | 34016 | 394.87 | 344 | 335 | 85.3 |
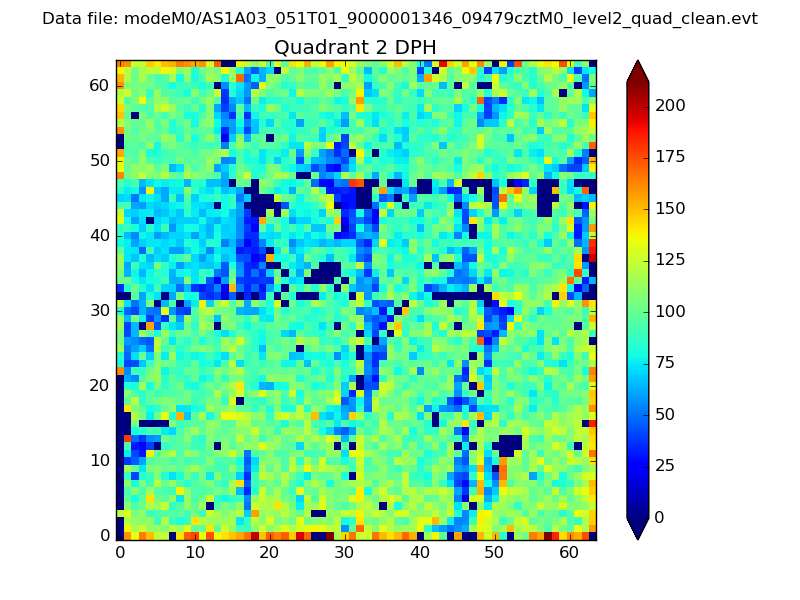
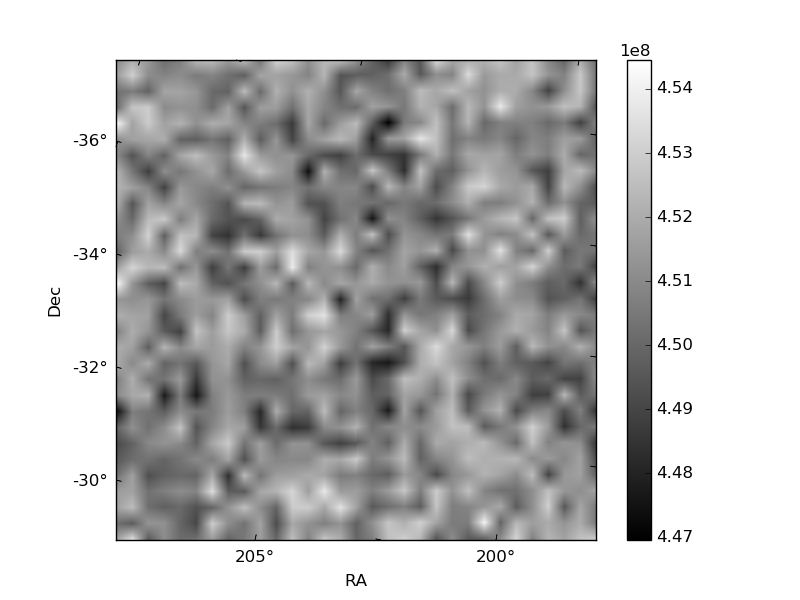
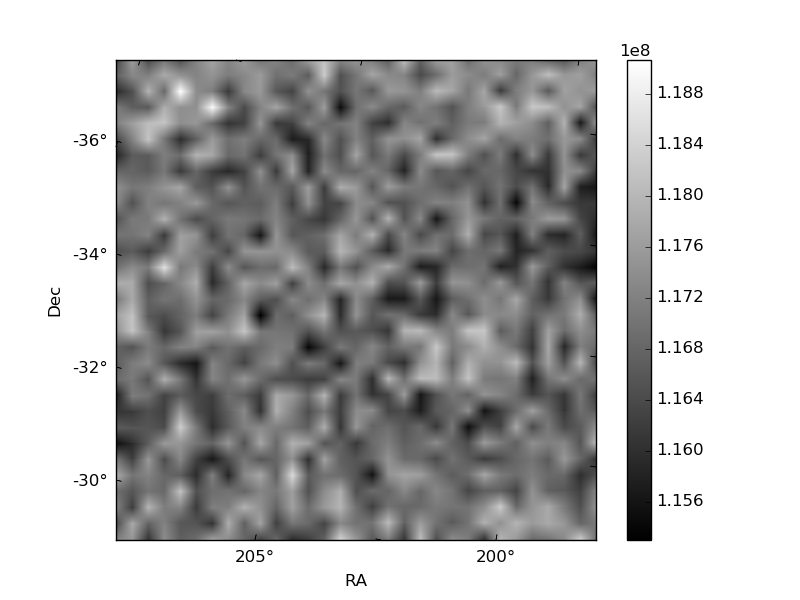
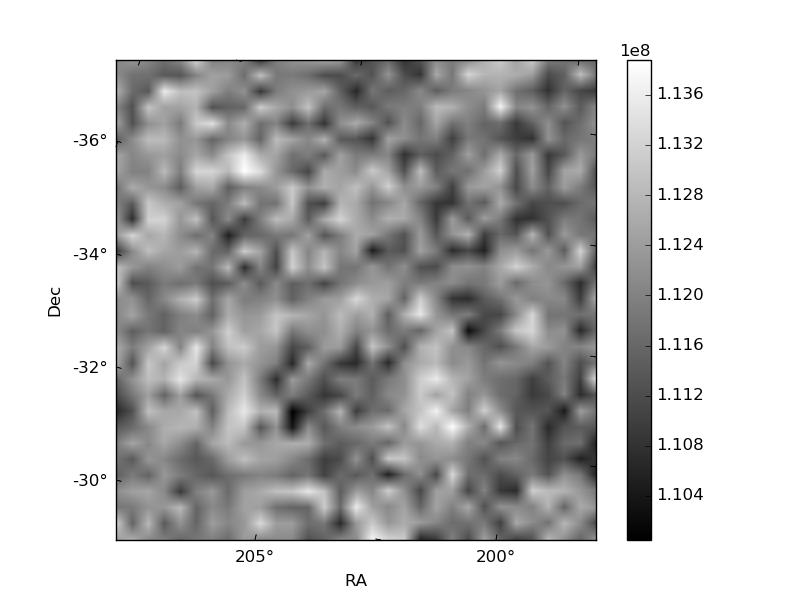
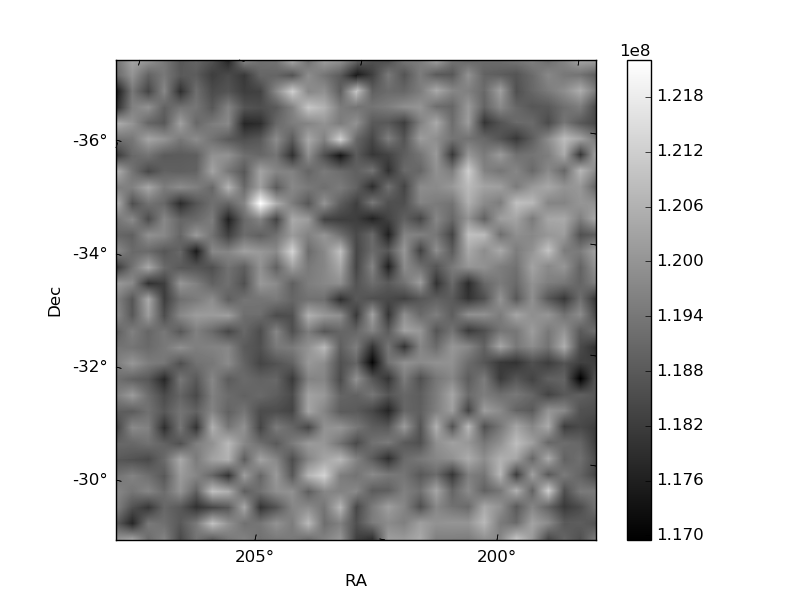
Histogram calculated using DETX and DETY for each event in the final _common_clean file
| Quadrant A | 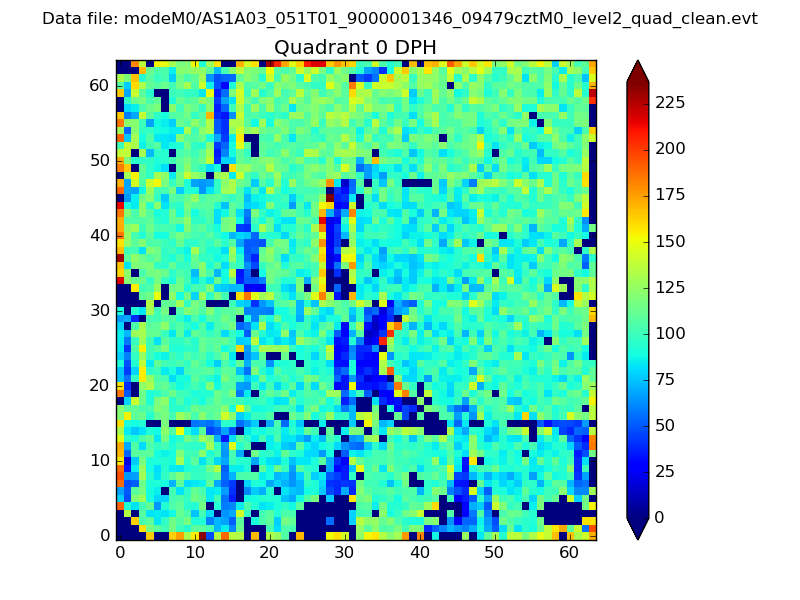 |
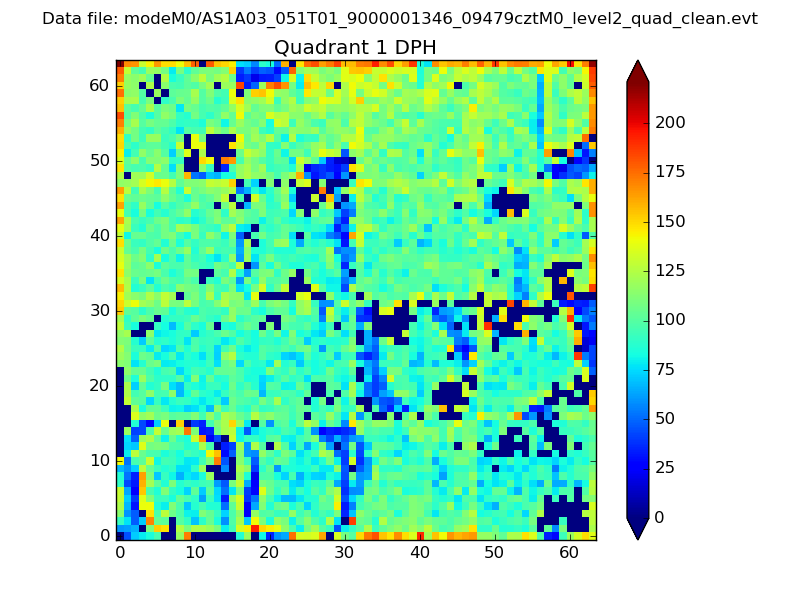 |
Quadrant B |
|---|---|---|---|
| Quadrant D | 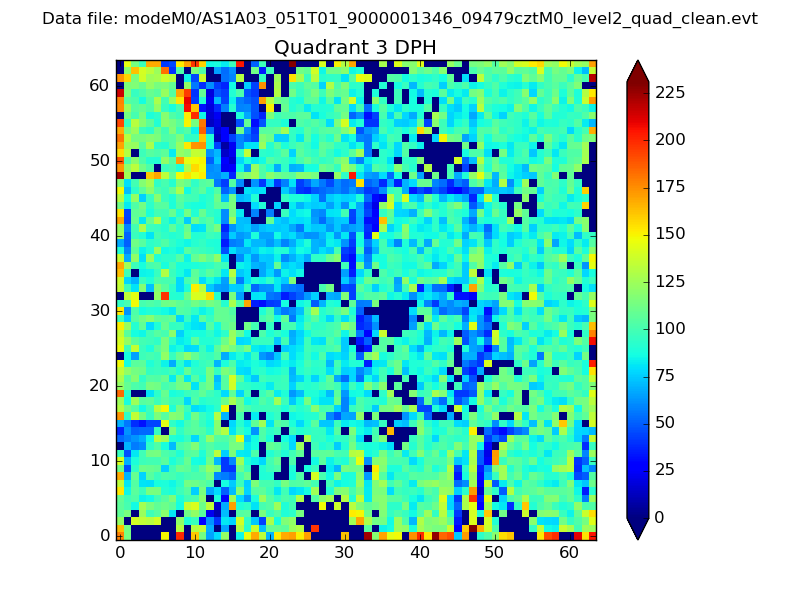 |
 |
Quadrant C |
| Plot type | Count rate plots | Images |
|---|---|---|
| Comparison with Poisson distribution Blue bars denote a histogram of data divided into 1 sec bins. Red curve is a Poisson curve with rate = median count rate of data. |
 |
 |
| Quadrant-wise count rates Data is divided into 100 sec bins |
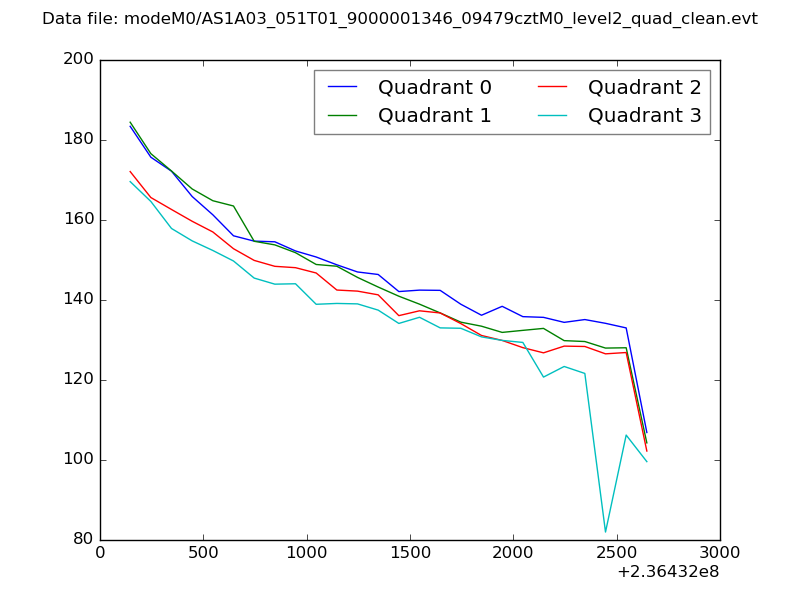 |
|
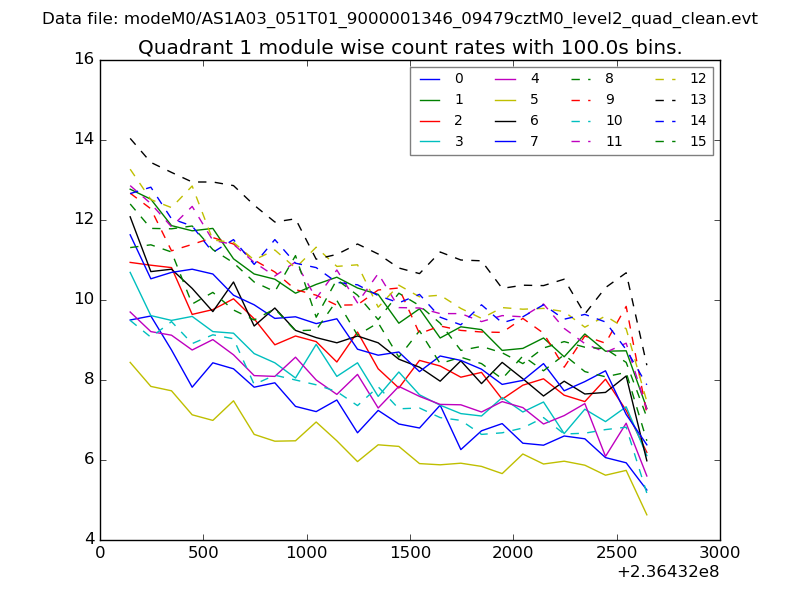
| Module-wise count rates for Quadrant A Data is divided into 100 sec bins |
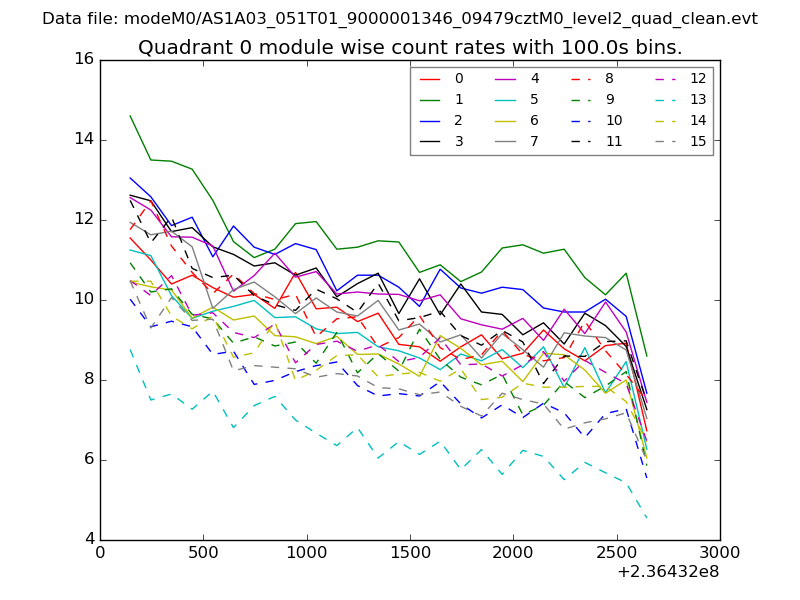 |
 |
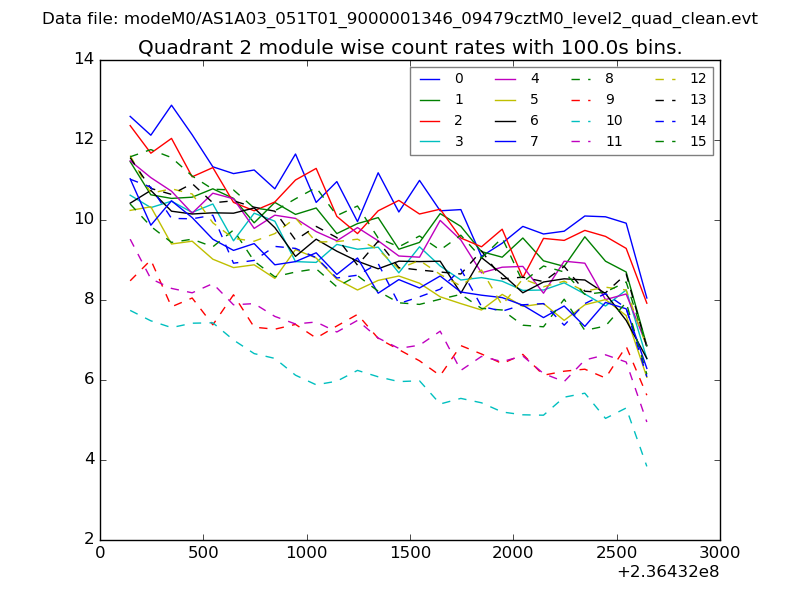
| Module-wise count rates for Quadrant B Data is divided into 100 sec bins |
 |
 |
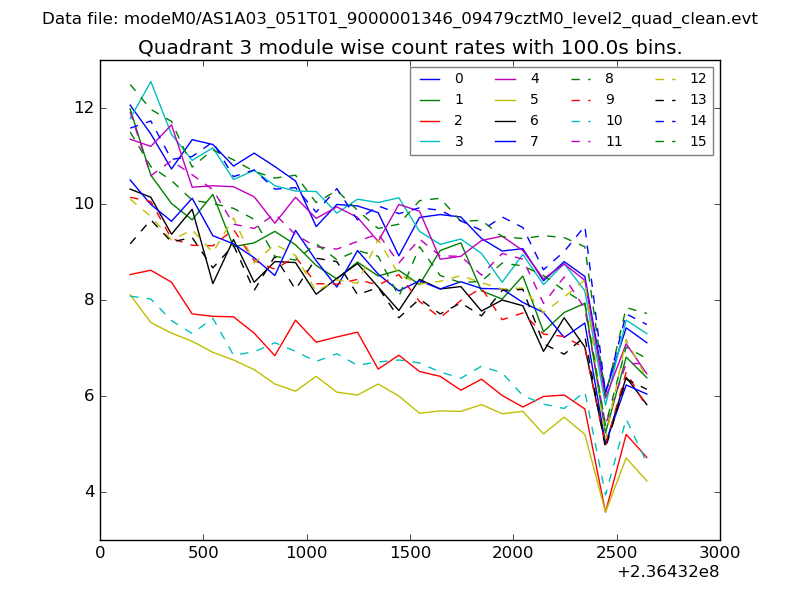
| Module-wise count rates for Quadrant C Data is divided into 100 sec bins |
 |
 |
| Module-wise count rates for Quadrant D Data is divided into 100 sec bins |
 |
 |
| Parameter | Plot |
|---|---|
| CZT HV Monitor | 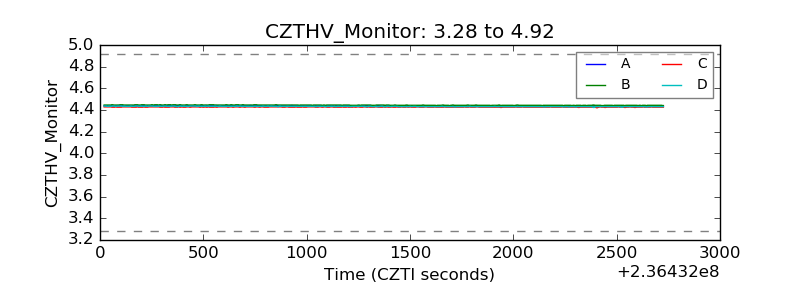 |
| D_VDD | 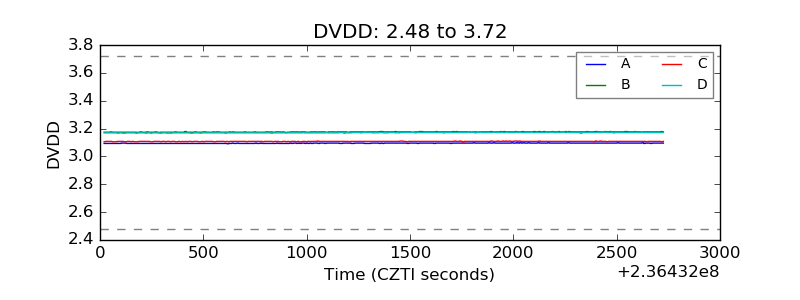 |
| Temperature 1 | 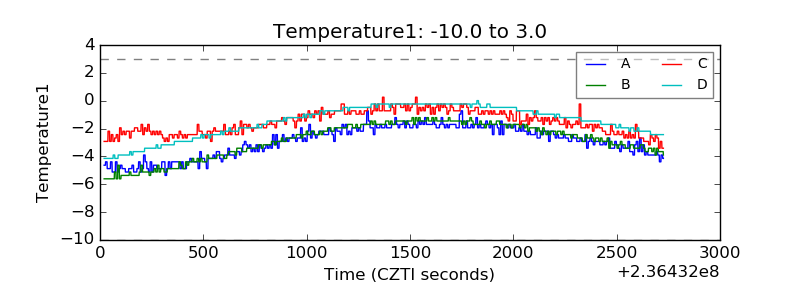 |
| Veto HV Monitor | 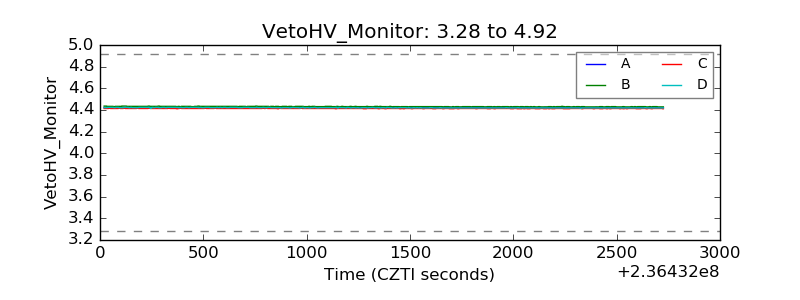 |
| Veto LLD | 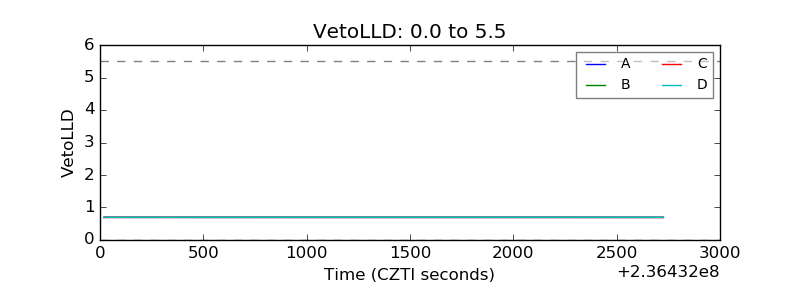 |
| Alpha Counter | 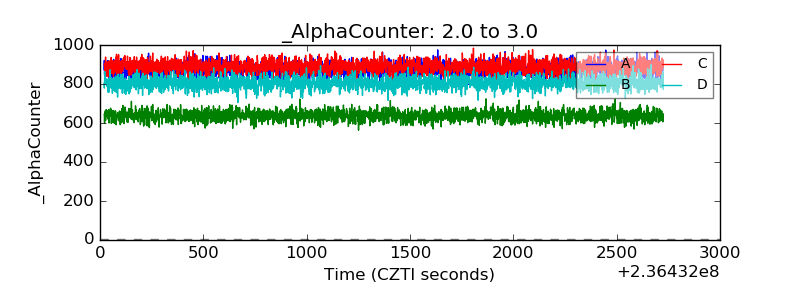 |
| _CPM_Rate | 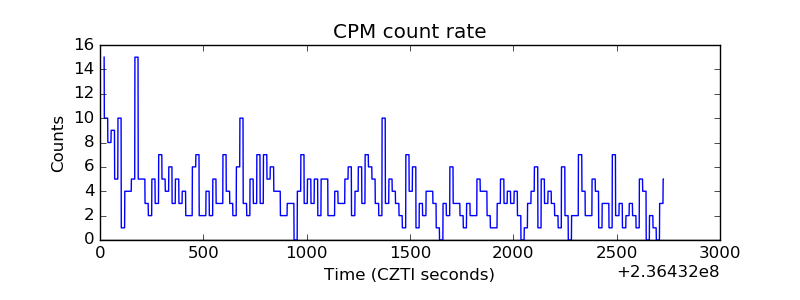 |
| CZT Counter | 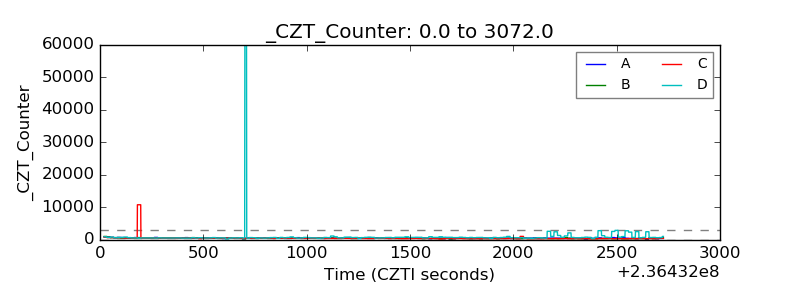 |
| +2.5 Volts monitor |  |
| +5 Volts monitor | 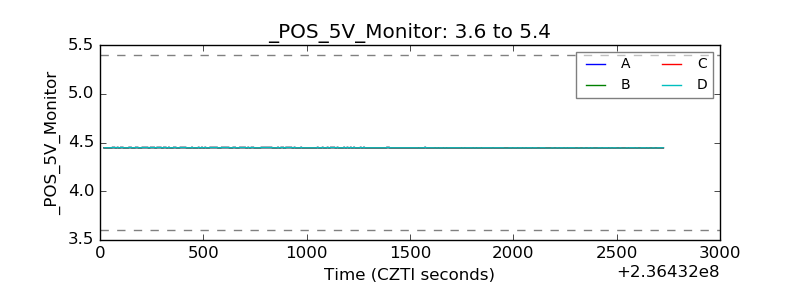 |
| _ROLL_ROT | 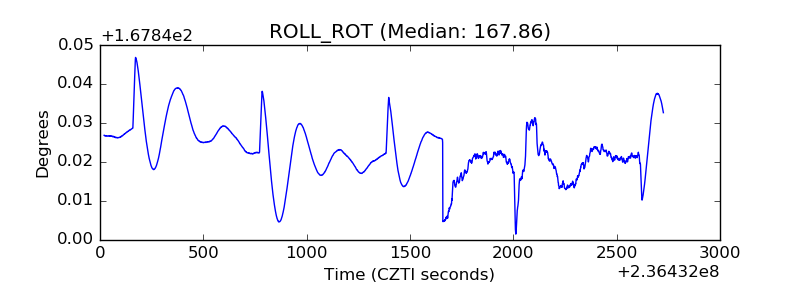 |
| _Roll_DEC | 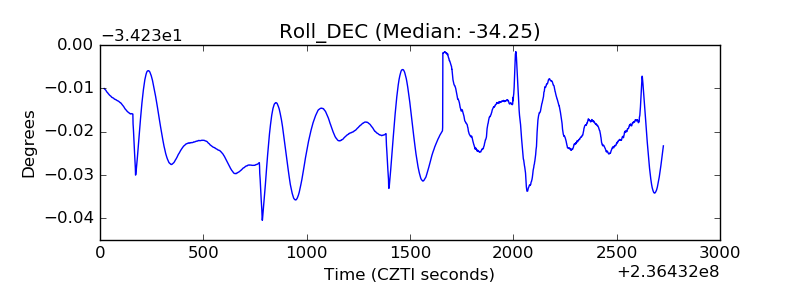 |
| _Roll_RA | 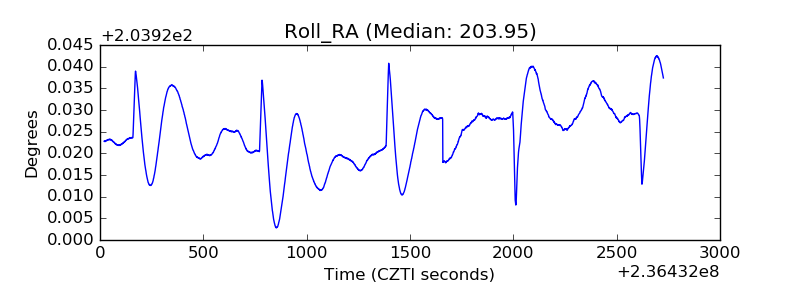 |
| Veto Counter | 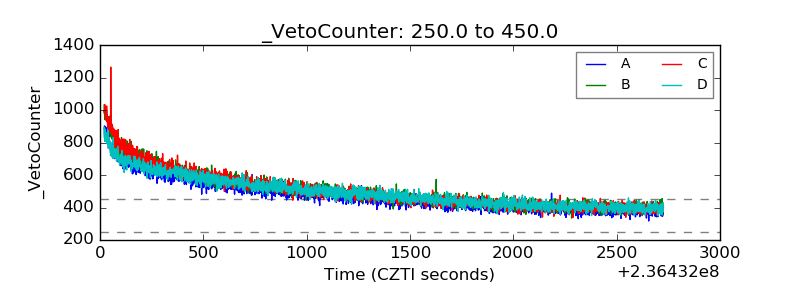 |