| Param | Original file | Final file |
|---|---|---|
| Filename | modeM0/AS1A03_051T01_9000001346_09480cztM0_level2.evt | modeM0/AS1A03_051T01_9000001346_09480cztM0_level2_quad_clean.evt |
| Size (bytes) | 1,065,081,600 | 192,816,000 |
| Size | 1015.7 MB | 183.9 MB |
| Events in quadrant A | 9,454,879 | 1,206,744 |
| Events in quadrant B | 6,988,388 | 1,212,364 |
| Events in quadrant C | 6,689,507 | 1,191,645 |
| Events in quadrant D | 8,082,021 | 1,166,899 |
| Mode M0 | |||
|---|---|---|---|
| Quadrant | BADHDUFLAG | Total packets | Discarded packets |
| A | 0 | 38412 | 3 |
| B | 0 | 31312 | 2 |
| C | 0 | 31254 | 2 |
| D | 0 | 34797 | 2 |
| Mode M9 | |||
|---|---|---|---|
| Quadrant | BADHDUFLAG | Total packets | Discarded packets |
| A | 0 | 12 | 0 |
| B | 0 | 12 | 0 |
| C | 0 | 12 | 0 |
| D | 0 | 12 | 0 |
| Mode SS | |||
|---|---|---|---|
| Quadrant | BADHDUFLAG | Total packets | Discarded packets |
| A | 0 | 312 | 0 |
| B | 0 | 312 | 0 |
| C | 0 | 312 | 0 |
| D | 0 | 312 | 0 |
| Quadrant | Total seconds | Saturated seconds | Saturation percentage |
|---|---|---|---|
| A | 15394 | 87 | 0.565155% |
| B | 15394 | 70 | 0.454723% |
| C | 15394 | 36 | 0.233857% |
| D | 15394 | 260 | 1.688970% |
Noise dominated data is calculated using 1-second bins in cleaned event files. If a bin has >2000 counts, and if more than 50% of those come from <1% of pixels, then it is considered to be noise-dominated and hence unusable.
| Quadrant | # 1 sec bins | Bins with >0 counts | Bins with >2000 counts | High rate bins dominated by noise | Noise dominated (total time) | Noise dominated (detector-on time) | Marked lightcurve |
|---|---|---|---|---|---|---|---|
| A | 16554 | 15396 | 16 | 16 | 0.10% | 0.10% | 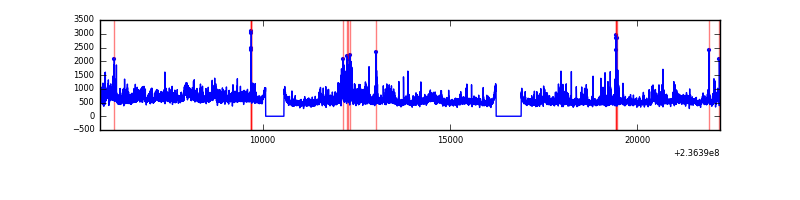 |
| B | 16554 | 15396 | 1 | 1 | 0.01% | 0.01% | 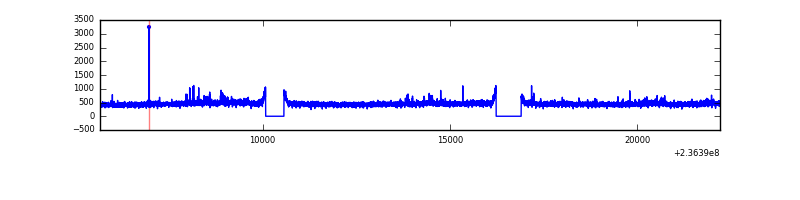 |
| C | 16554 | 15396 | 5 | 5 | 0.03% | 0.03% |  |
| D | 16554 | 15396 | 194 | 194 | 1.17% | 1.26% | 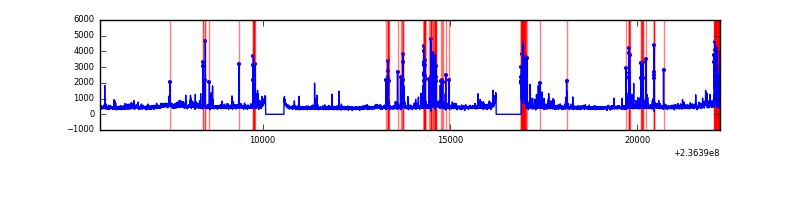 |
Top three noisy pixels from each quadrant. If the there are fewer than three noisy pixels in the level2.evt file, extra rows are filled as -1
| Pixel properties | Quadrant properties | ||||||
|---|---|---|---|---|---|---|---|
| Quadrant | DetID | PixID | Counts | Sigma | Mean | Median | Sigma |
| A | 8 | 5 | 2403602 | 6681.73 | 1760 | 1721 | 359.5 |
| A | 1 | 162 | 149764 | 411.84 | 1760 | 1721 | 359.5 |
| A | 1 | 178 | 51150 | 137.51 | 1760 | 1721 | 359.5 |
| B | 0 | 214 | 106693 | 312.38 | 1757 | 1715 | 336.1 |
| B | 12 | 111 | 36537 | 103.62 | 1757 | 1715 | 336.1 |
| B | 11 | 111 | 30280 | 85.0 | 1757 | 1715 | 336.1 |
| C | 5 | 128 | 45039 | 110.66 | 1693 | 1700 | 391.6 |
| C | 14 | 234 | 30035 | 72.35 | 1693 | 1700 | 391.6 |
| C | 13 | 61 | 12694 | 28.07 | 1693 | 1700 | 391.6 |
| D | 1 | 52 | 689199 | 1639.72 | 1687 | 1641 | 419.3 |
| D | 8 | 195 | 450551 | 1070.58 | 1687 | 1641 | 419.3 |
| D | 12 | 233 | 208906 | 494.29 | 1687 | 1641 | 419.3 |
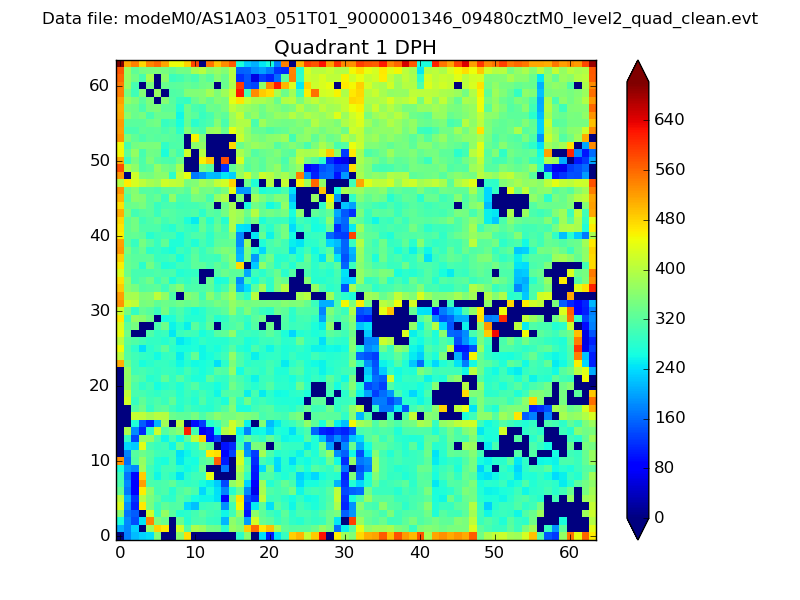
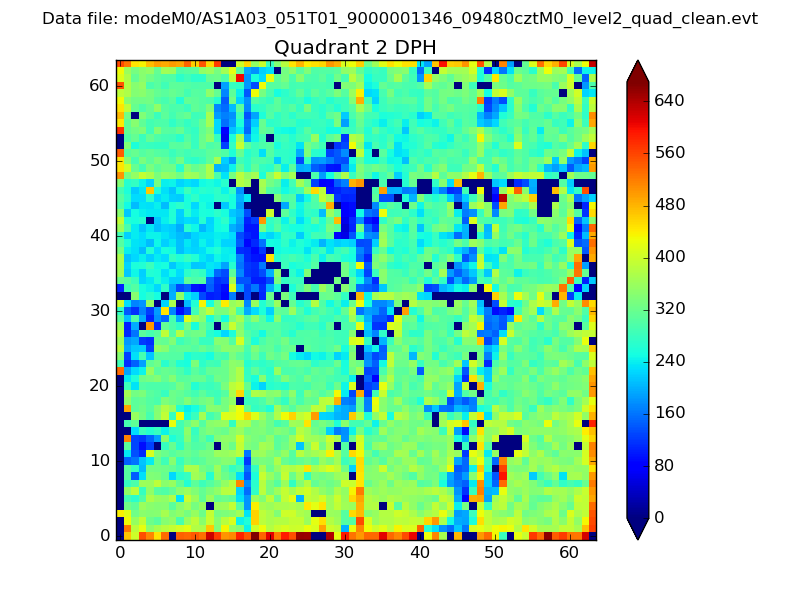
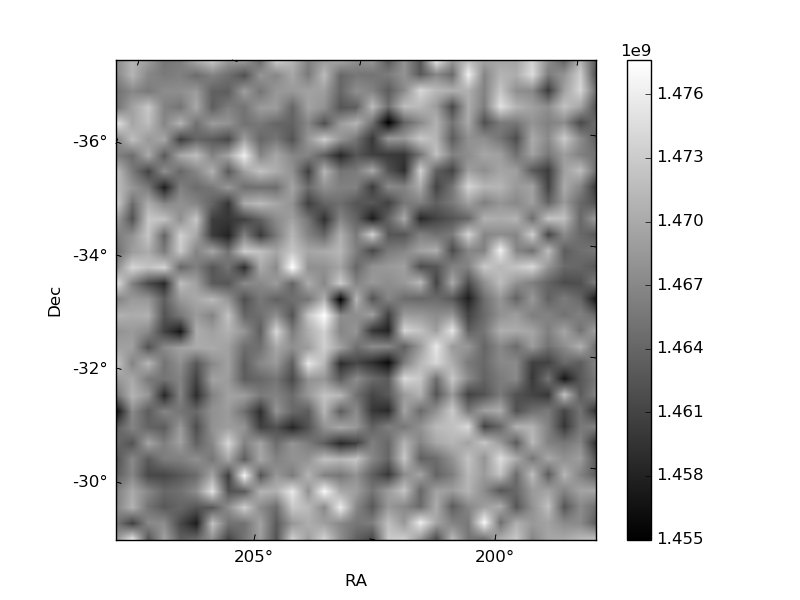
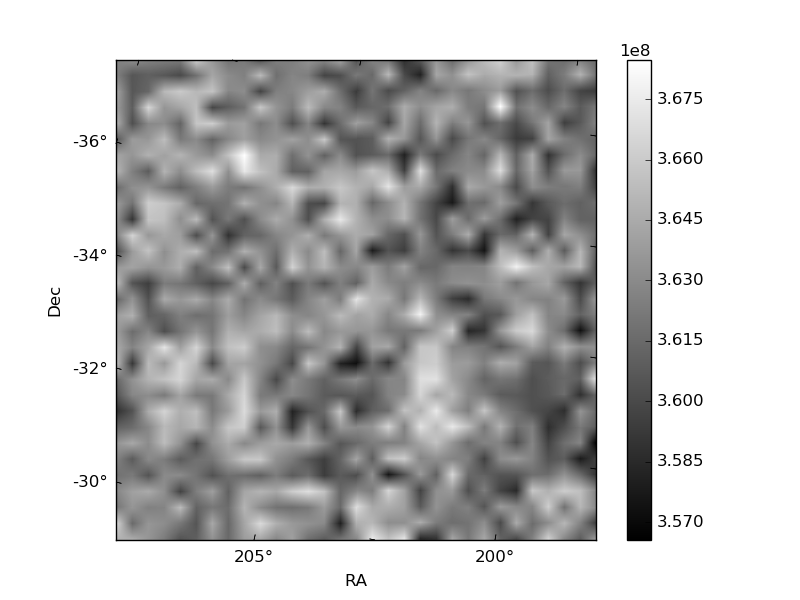
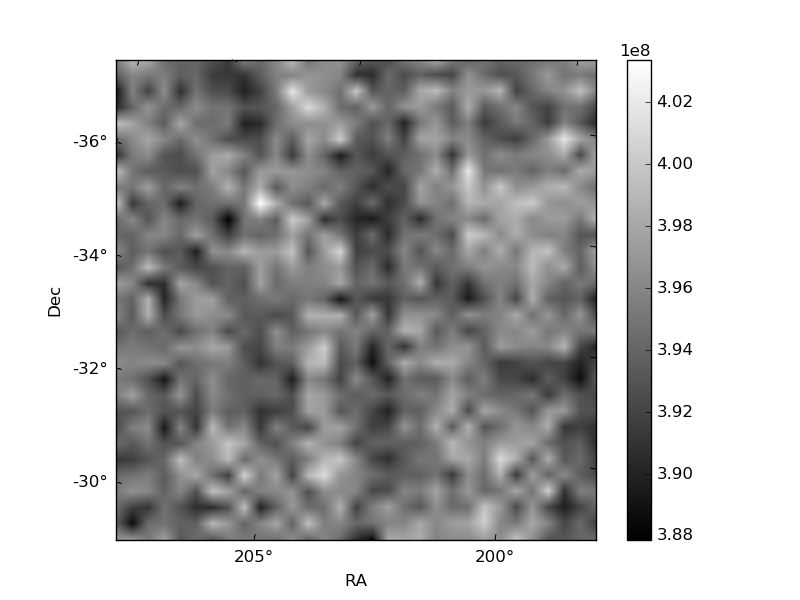
Histogram calculated using DETX and DETY for each event in the final _common_clean file
| Quadrant A | 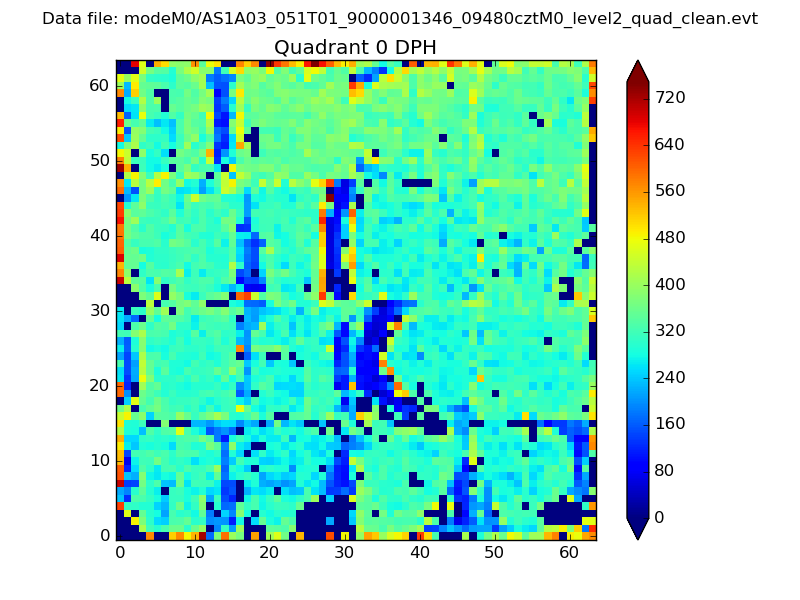 |
 |
Quadrant B |
|---|---|---|---|
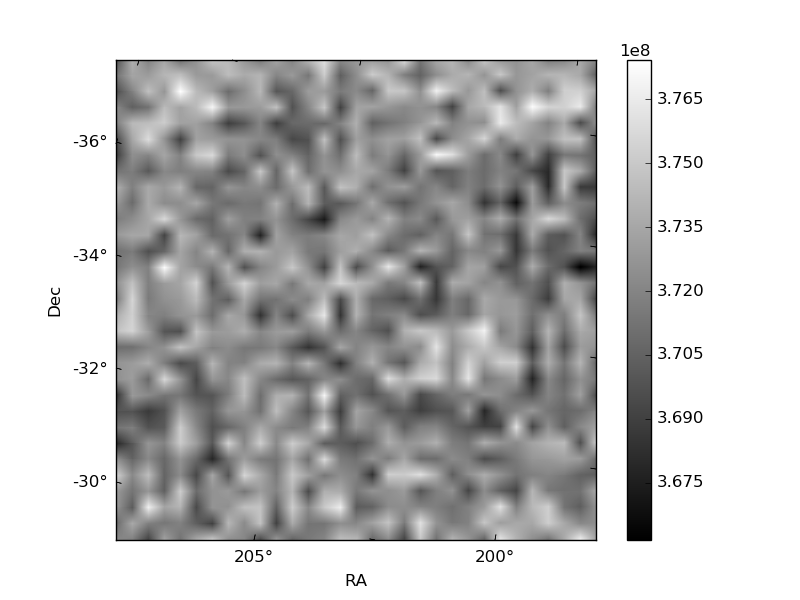
| Quadrant D | 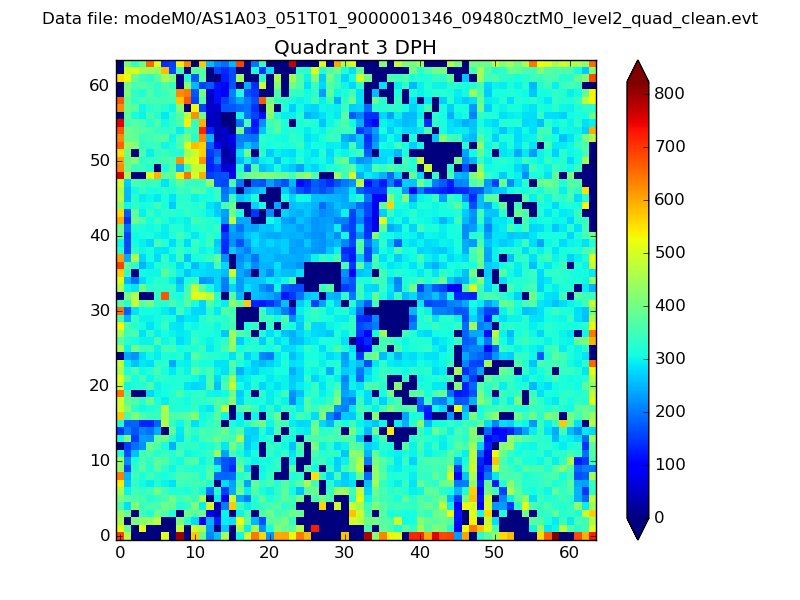 |
 |
Quadrant C |
| Plot type | Count rate plots | Images |
|---|---|---|
| Comparison with Poisson distribution Blue bars denote a histogram of data divided into 1 sec bins. Red curve is a Poisson curve with rate = median count rate of data. |
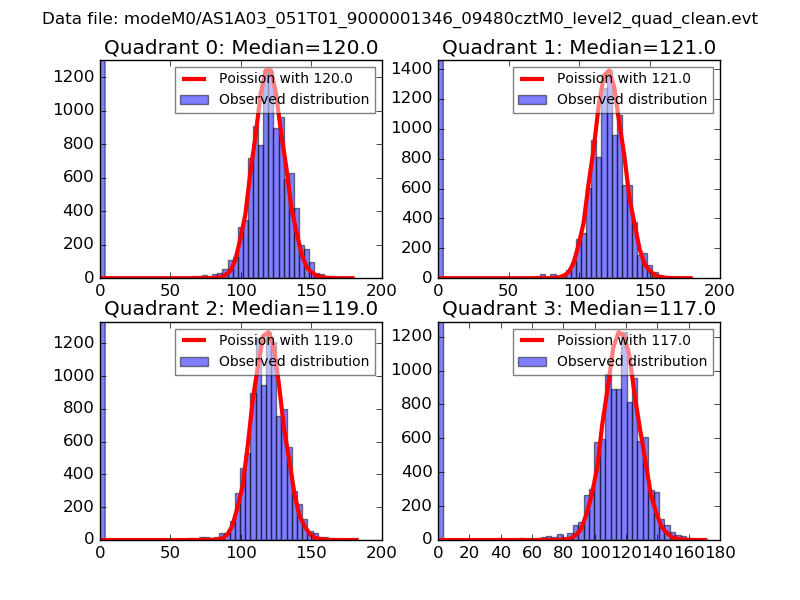 |
 |
| Quadrant-wise count rates Data is divided into 100 sec bins |
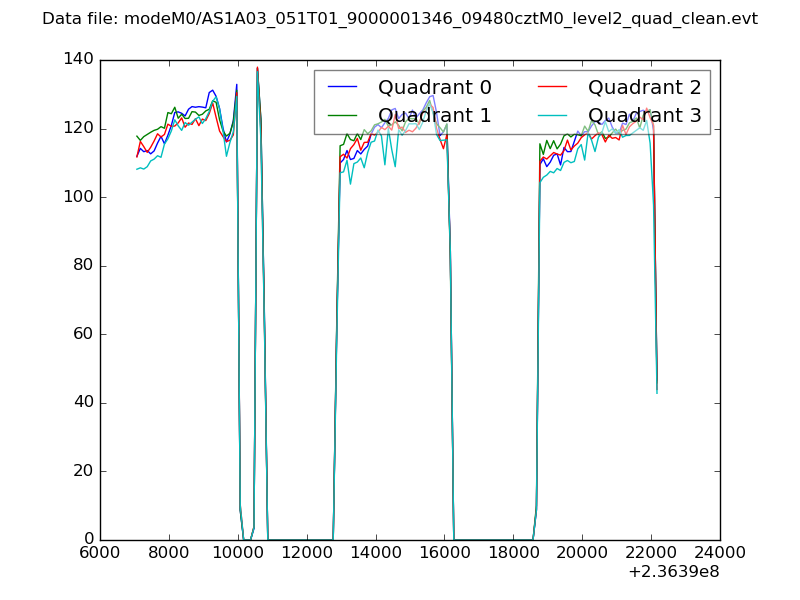 |
|
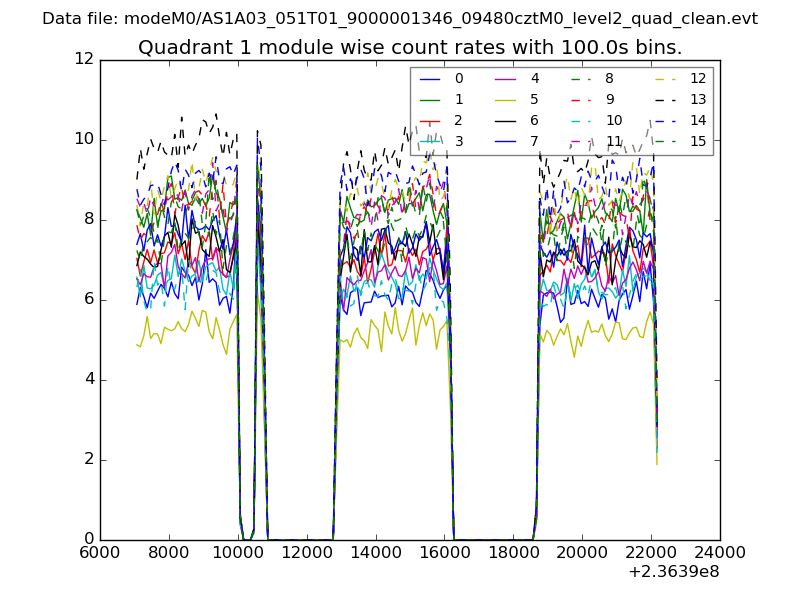
| Module-wise count rates for Quadrant A Data is divided into 100 sec bins |
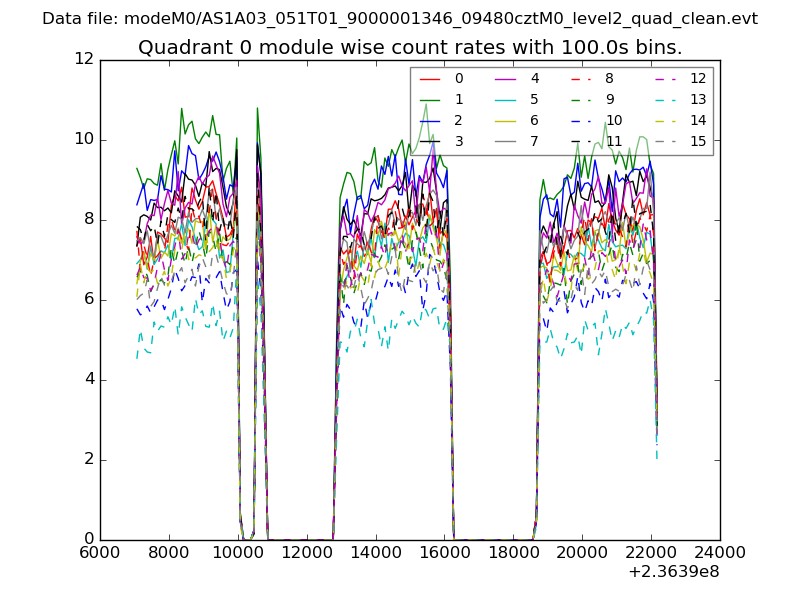 |
 |
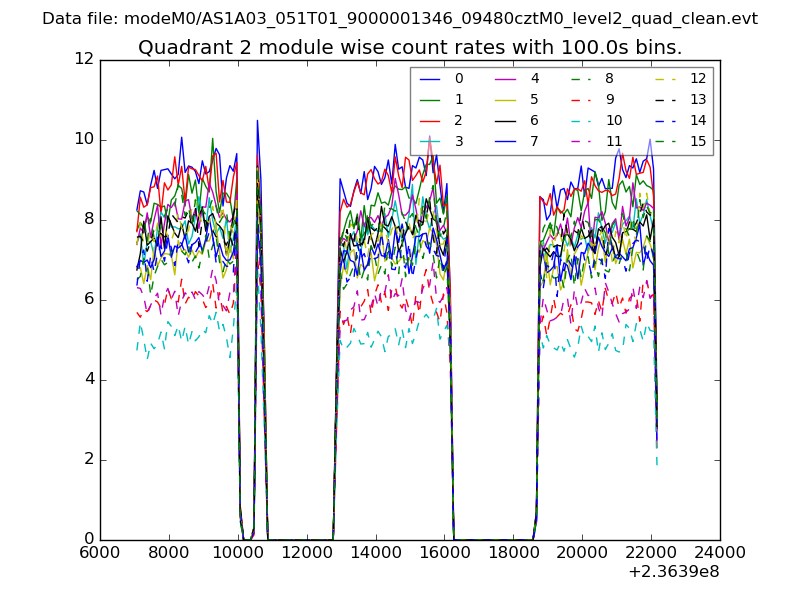
| Module-wise count rates for Quadrant B Data is divided into 100 sec bins |
 |
 |
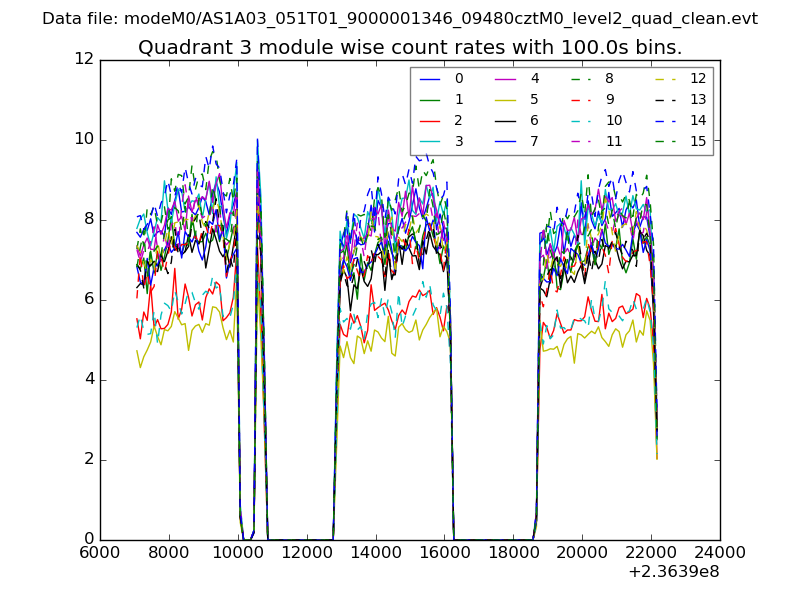
| Module-wise count rates for Quadrant C Data is divided into 100 sec bins |
 |
 |
| Module-wise count rates for Quadrant D Data is divided into 100 sec bins |
 |
 |
| Parameter | Plot |
|---|---|
| CZT HV Monitor | 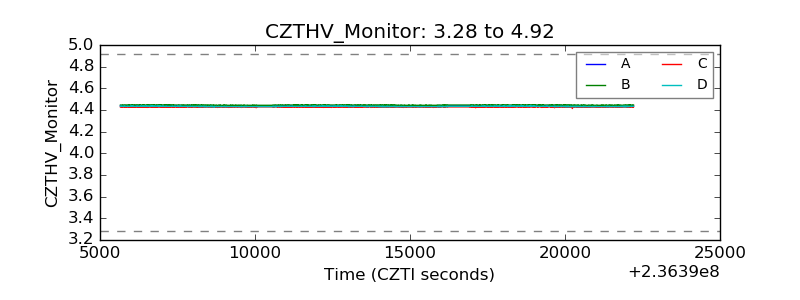 |
| D_VDD | 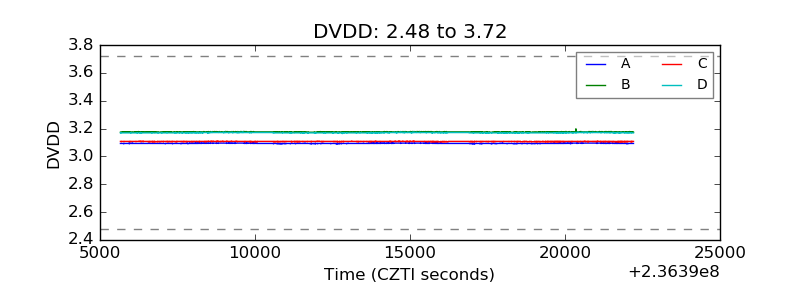 |
| Temperature 1 | 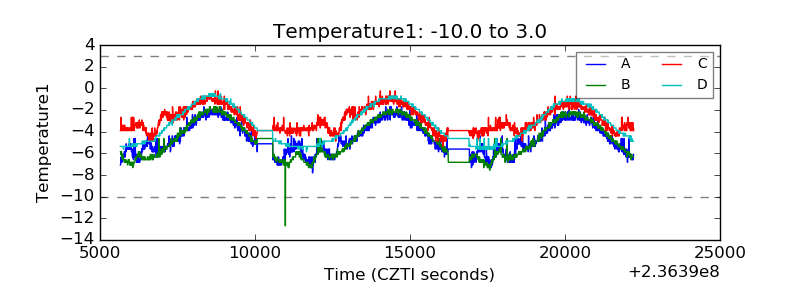 |
| Veto HV Monitor | 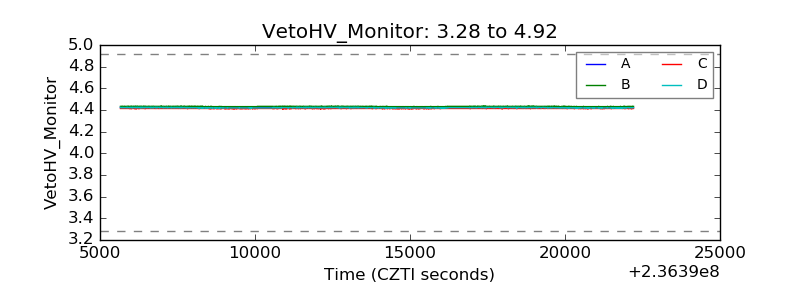 |
| Veto LLD | 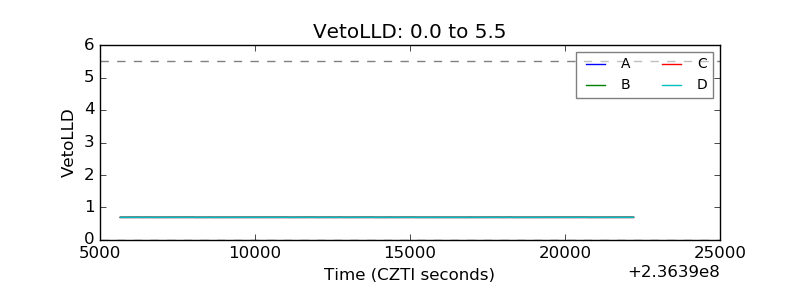 |
| Alpha Counter | 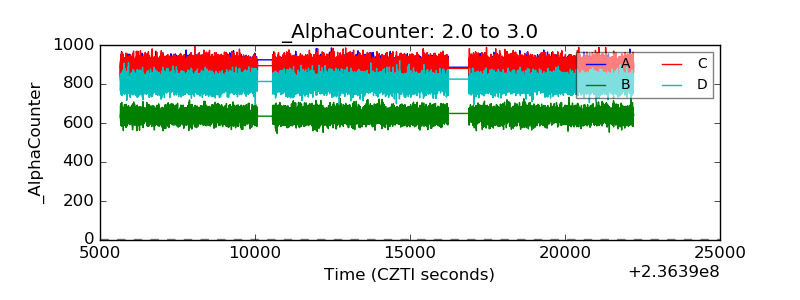 |
| _CPM_Rate | 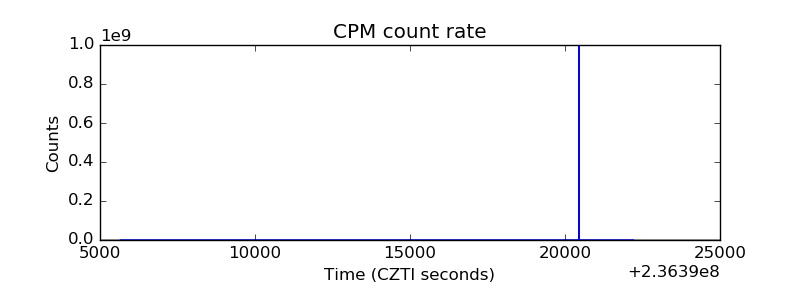 |
| CZT Counter | 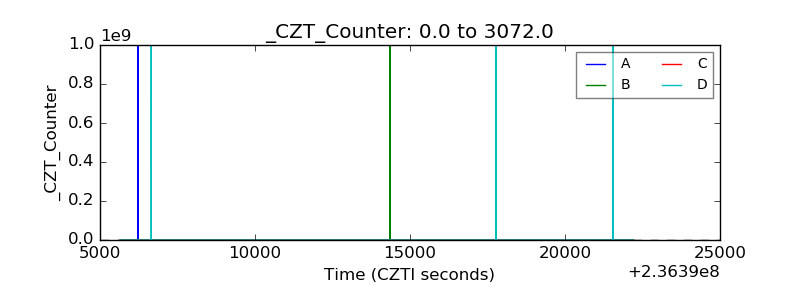 |
| +2.5 Volts monitor |  |
| +5 Volts monitor |  |
| _ROLL_ROT | 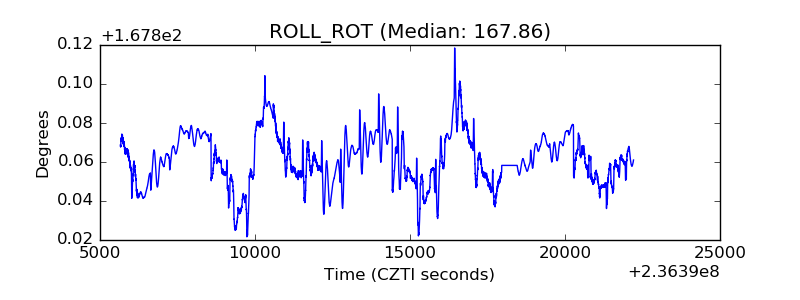 |
| _Roll_DEC | 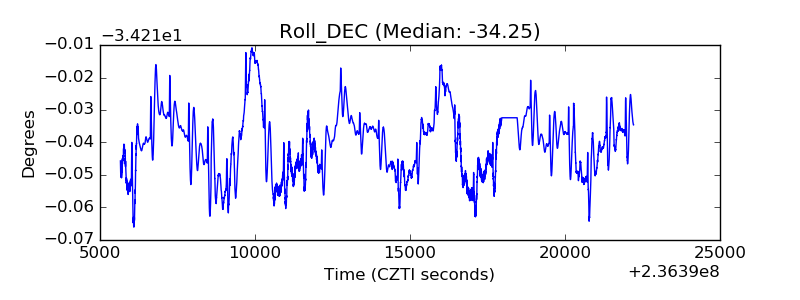 |
| _Roll_RA | 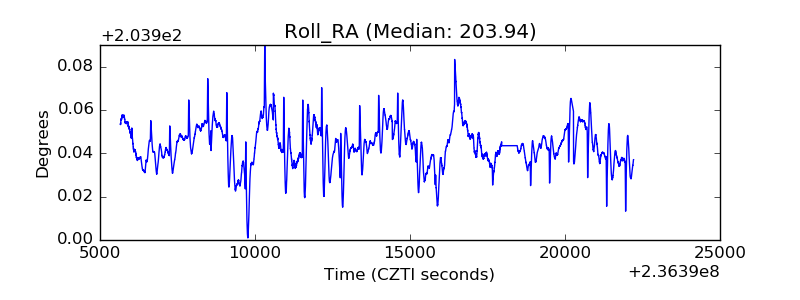 |
| Veto Counter | 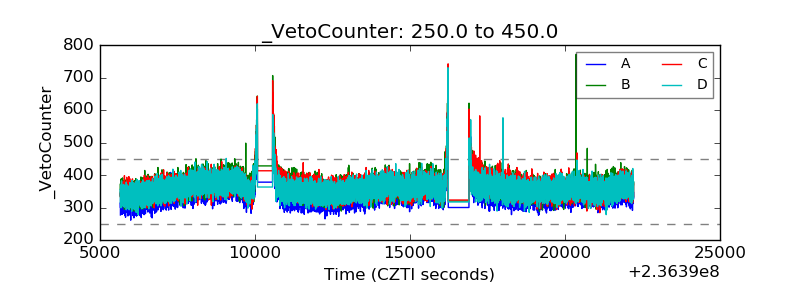 |