| Param | Original file | Final file |
|---|---|---|
| Filename | modeM0/AS1A03_005T01_9000001348_09479cztM0_level2.evt | modeM0/AS1A03_005T01_9000001348_09479cztM0_level2_quad_clean.evt |
| Size (bytes) | 224,395,200 | 41,734,080 |
| Size | 214.0 MB | 39.8 MB |
| Events in quadrant A | 1,657,230 | 269,867 |
| Events in quadrant B | 1,514,024 | 270,442 |
| Events in quadrant C | 1,474,292 | 267,084 |
| Events in quadrant D | 1,960,291 | 257,825 |
| Mode M0 | |||
|---|---|---|---|
| Quadrant | BADHDUFLAG | Total packets | Discarded packets |
| A | 0 | 6766 | 2 |
| B | 0 | 6256 | 1 |
| C | 0 | 6080 | 1 |
| D | 0 | 7817 | 1 |
| Mode SS | |||
|---|---|---|---|
| Quadrant | BADHDUFLAG | Total packets | Discarded packets |
| A | 0 | 56 | 0 |
| B | 0 | 56 | 0 |
| C | 0 | 56 | 0 |
| D | 0 | 56 | 0 |
| Mode M9 | |||
|---|---|---|---|
| Quadrant | BADHDUFLAG | Total packets | Discarded packets |
| A | 0 | 13 | 0 |
| B | 0 | 13 | 0 |
| C | 0 | 13 | 0 |
| D | 0 | 13 | 0 |
| Quadrant | Total seconds | Saturated seconds | Saturation percentage |
|---|---|---|---|
| A | 2776 | 91 | 3.278098% |
| B | 2776 | 86 | 3.097983% |
| C | 2776 | 65 | 2.341499% |
| D | 2776 | 82 | 2.953890% |
Noise dominated data is calculated using 1-second bins in cleaned event files. If a bin has >2000 counts, and if more than 50% of those come from <1% of pixels, then it is considered to be noise-dominated and hence unusable.
| Quadrant | # 1 sec bins | Bins with >0 counts | Bins with >2000 counts | High rate bins dominated by noise | Noise dominated (total time) | Noise dominated (detector-on time) | Marked lightcurve |
|---|---|---|---|---|---|---|---|
| A | 4041 | 2777 | 0 | 0 | 0.00% | 0.00% |  |
| B | 4041 | 2777 | 0 | 0 | 0.00% | 0.00% | 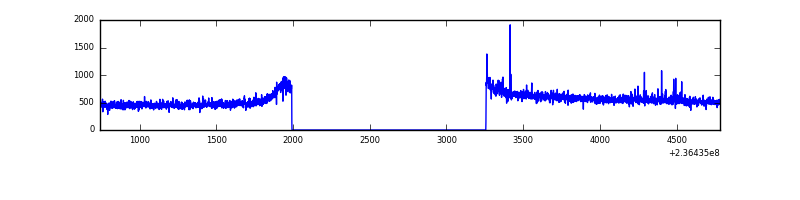 |
| C | 4041 | 2777 | 0 | 0 | 0.00% | 0.00% | 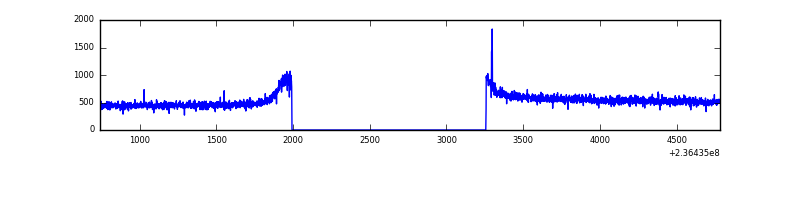 |
| D | 4041 | 2777 | 3 | 3 | 0.07% | 0.11% | 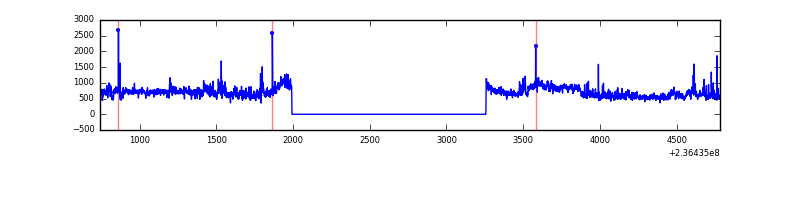 |
Top three noisy pixels from each quadrant. If the there are fewer than three noisy pixels in the level2.evt file, extra rows are filled as -1
| Pixel properties | Quadrant properties | ||||||
|---|---|---|---|---|---|---|---|
| Quadrant | DetID | PixID | Counts | Sigma | Mean | Median | Sigma |
| A | 8 | 5 | 155159 | 1942.83 | 389 | 382 | 79.7 |
| A | 1 | 162 | 4773 | 55.12 | 389 | 382 | 79.7 |
| A | 0 | 226 | 3649 | 41.01 | 389 | 382 | 79.7 |
| B | 4 | 173 | 20485 | 273.53 | 384 | 375 | 73.5 |
| B | 12 | 111 | 7861 | 101.82 | 384 | 375 | 73.5 |
| B | 11 | 111 | 6547 | 83.95 | 384 | 375 | 73.5 |
| C | 12 | 4 | 5248 | 55.83 | 376 | 377 | 87.3 |
| C | 13 | 61 | 2876 | 28.64 | 376 | 377 | 87.3 |
| C | 9 | 68 | 2127 | 20.06 | 376 | 377 | 87.3 |
| D | 8 | 195 | 390976 | 4126.78 | 376 | 367 | 94.7 |
| D | 13 | 169 | 78123 | 821.49 | 376 | 367 | 94.7 |
| D | 1 | 52 | 33641 | 351.54 | 376 | 367 | 94.7 |
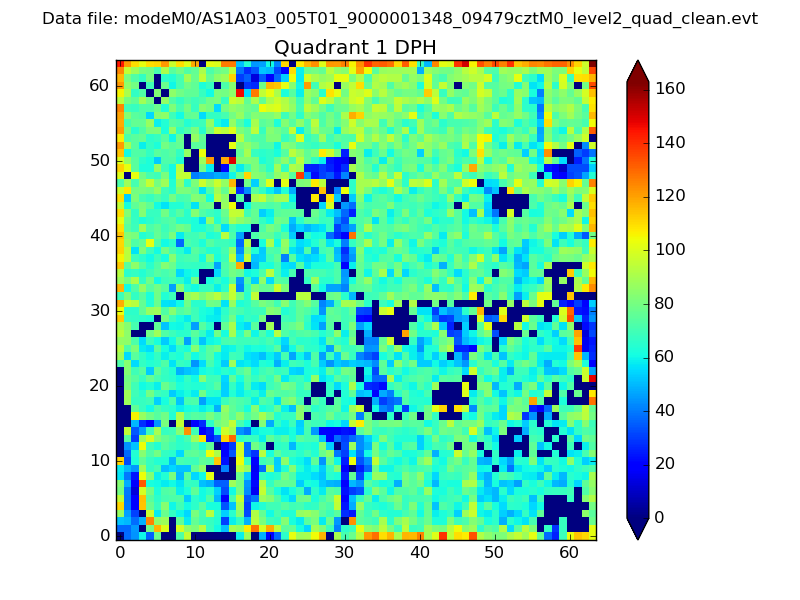
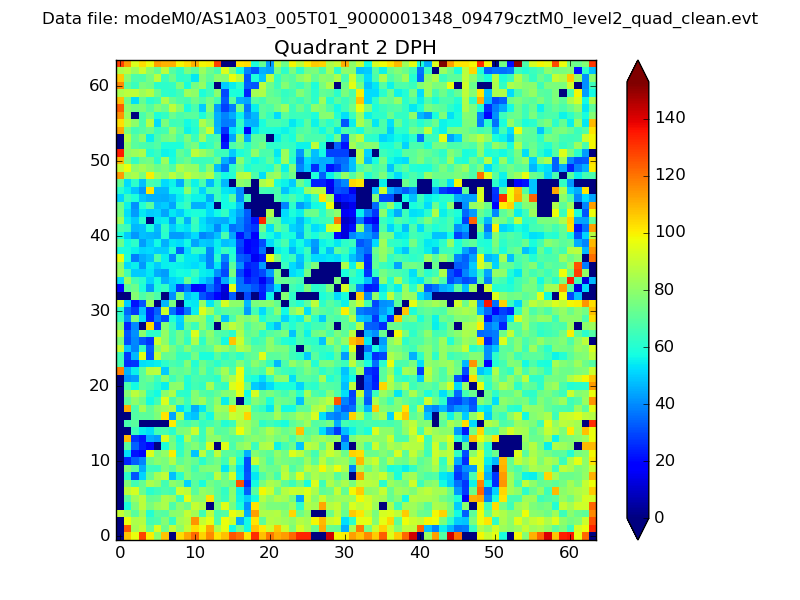
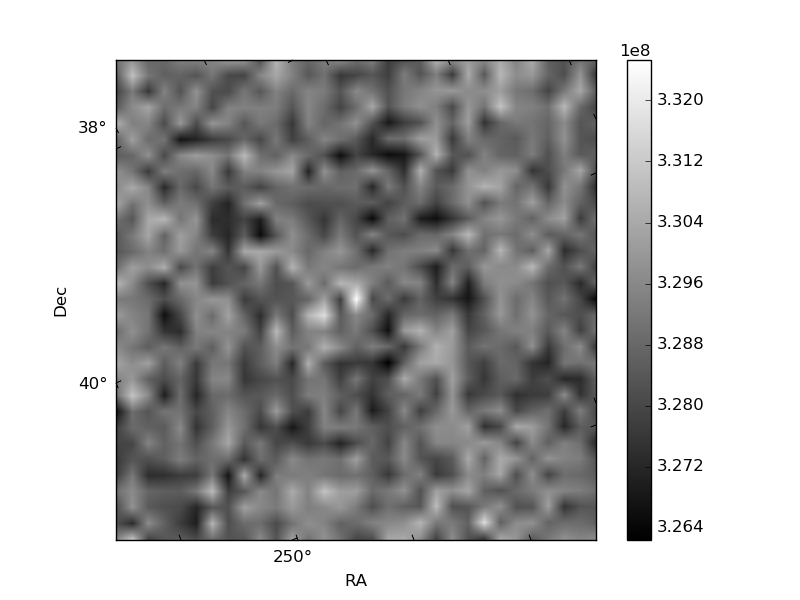
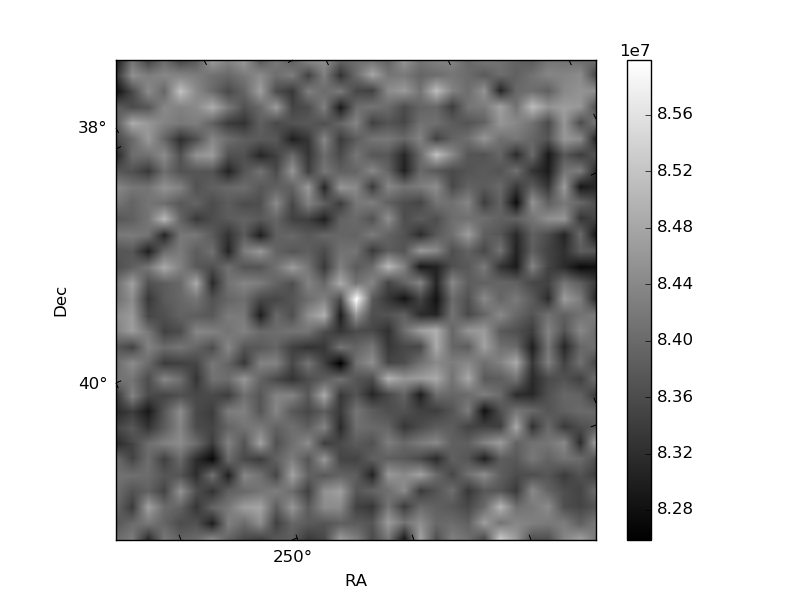
Histogram calculated using DETX and DETY for each event in the final _common_clean file
| Quadrant A | 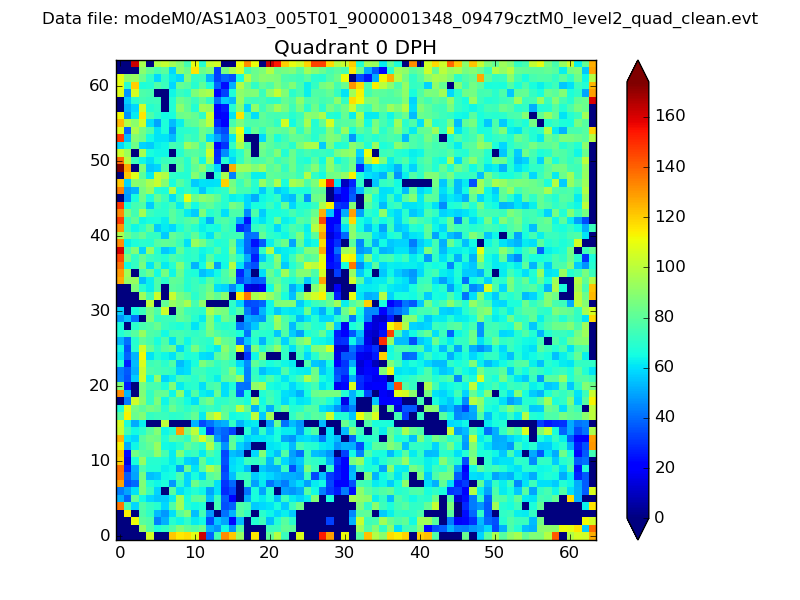 |
 |
Quadrant B |
|---|---|---|---|
| Quadrant D | 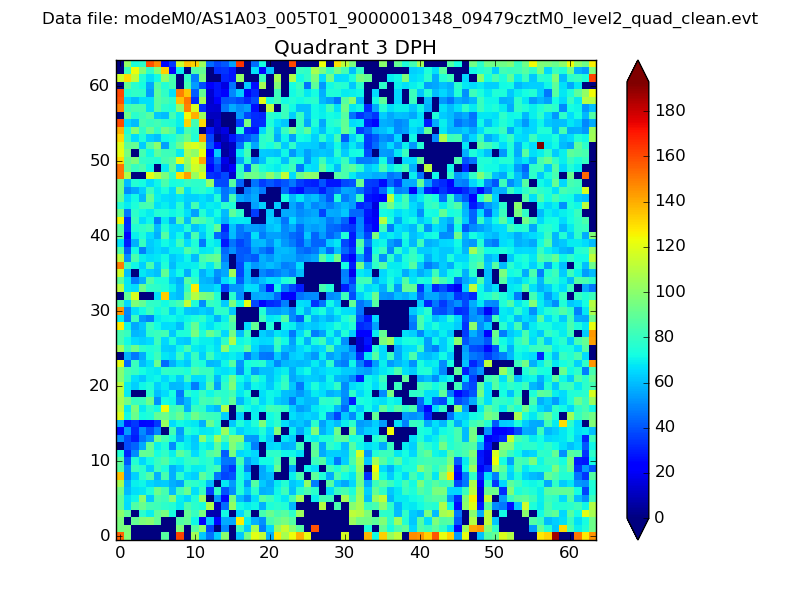 |
 |
Quadrant C |
| Plot type | Count rate plots | Images |
|---|---|---|
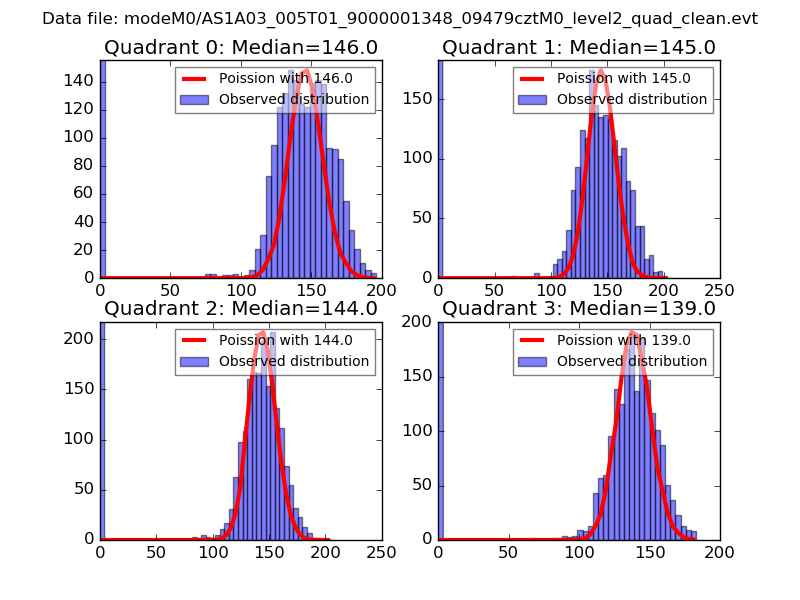
| Comparison with Poisson distribution Blue bars denote a histogram of data divided into 1 sec bins. Red curve is a Poisson curve with rate = median count rate of data. |
 |
 |
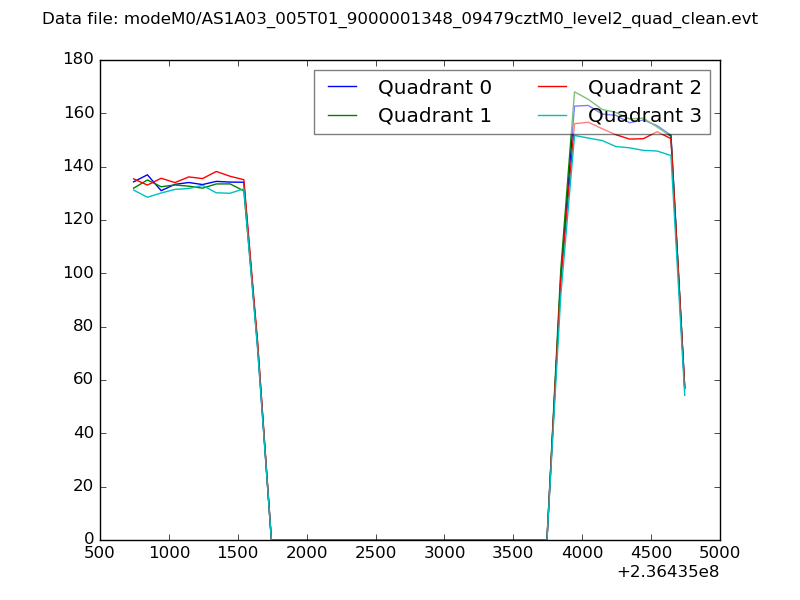
| Quadrant-wise count rates Data is divided into 100 sec bins |
 |
|
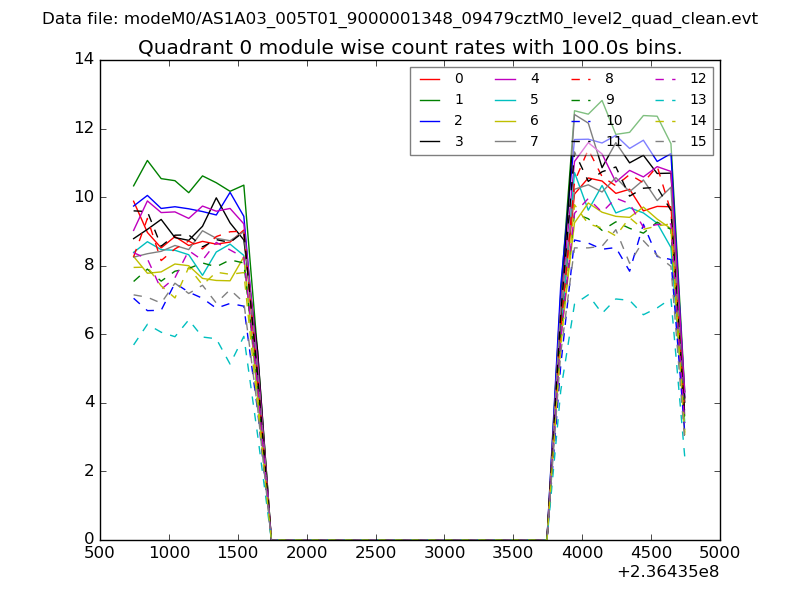
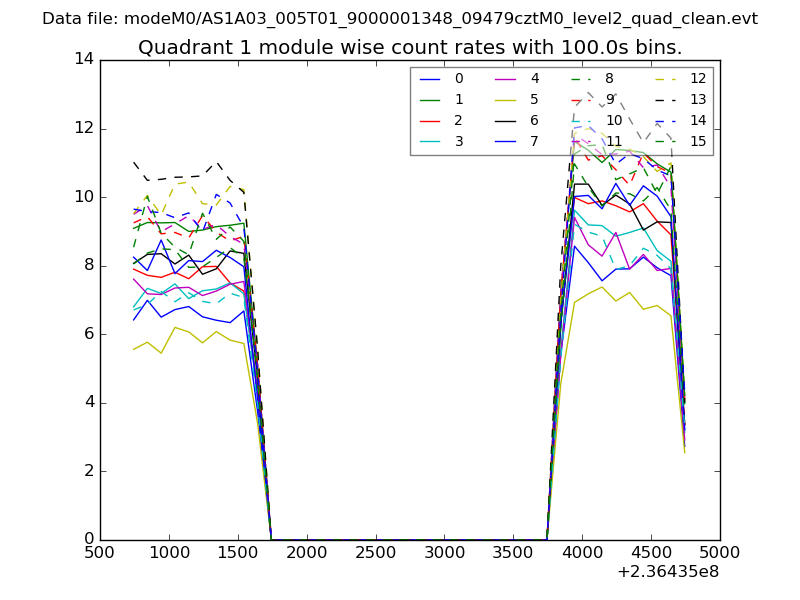
| Module-wise count rates for Quadrant A Data is divided into 100 sec bins |
 |
 |
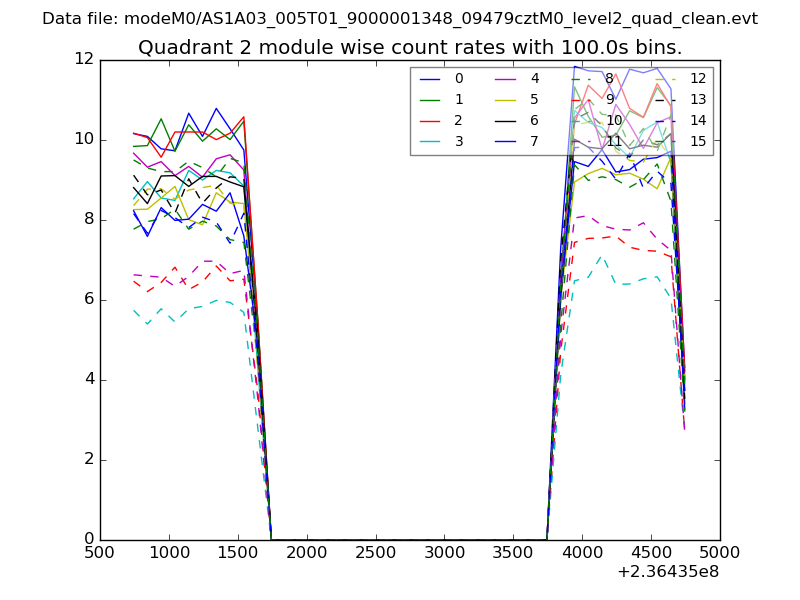
| Module-wise count rates for Quadrant B Data is divided into 100 sec bins |
 |
 |
| Module-wise count rates for Quadrant C Data is divided into 100 sec bins |
 |
 |
| Module-wise count rates for Quadrant D Data is divided into 100 sec bins |
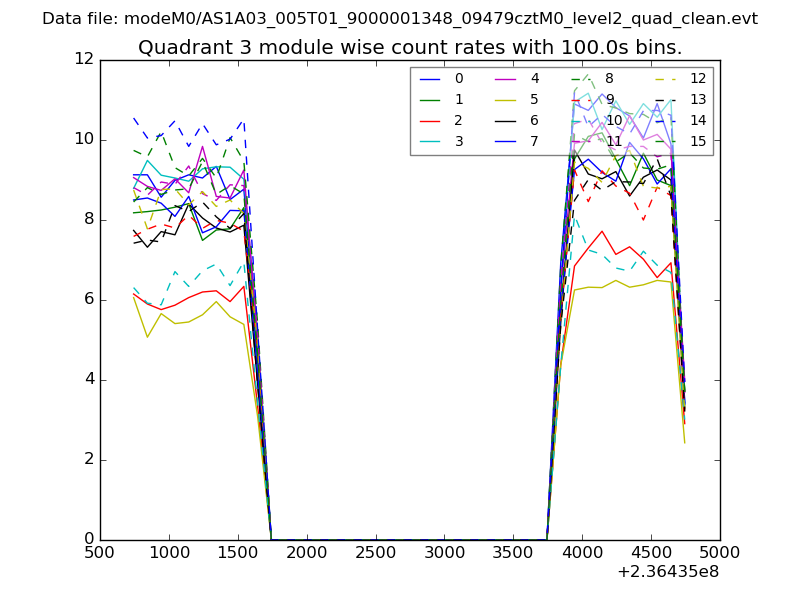 |
 |
| Parameter | Plot |
|---|---|
| CZT HV Monitor | 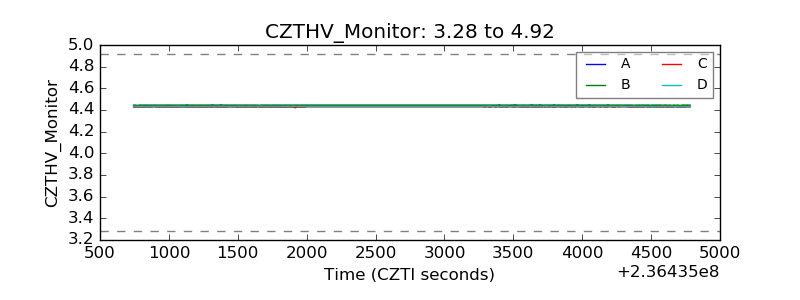 |
| D_VDD | 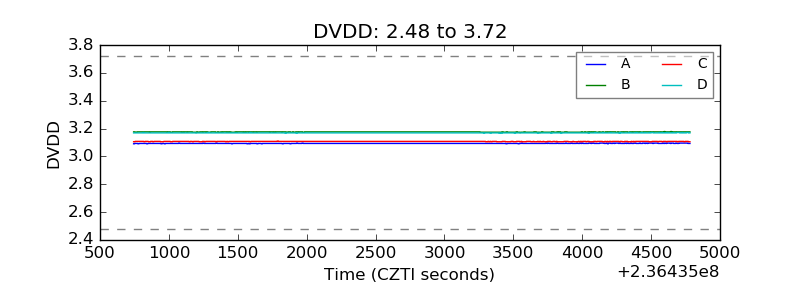 |
| Temperature 1 | 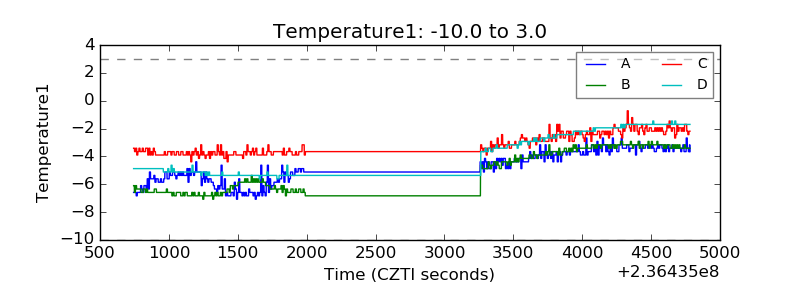 |
| Veto HV Monitor | 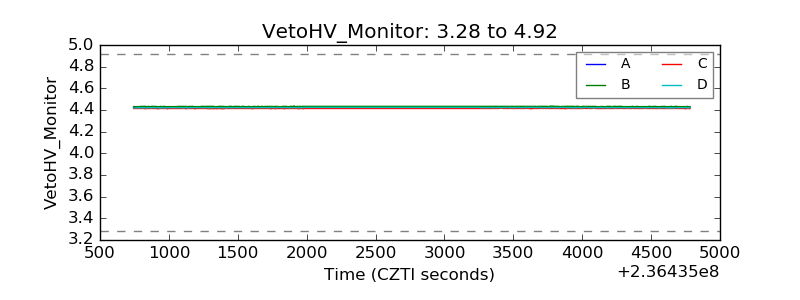 |
| Veto LLD | 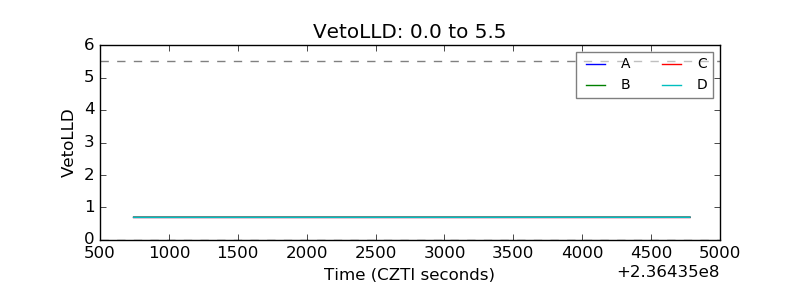 |
| Alpha Counter | 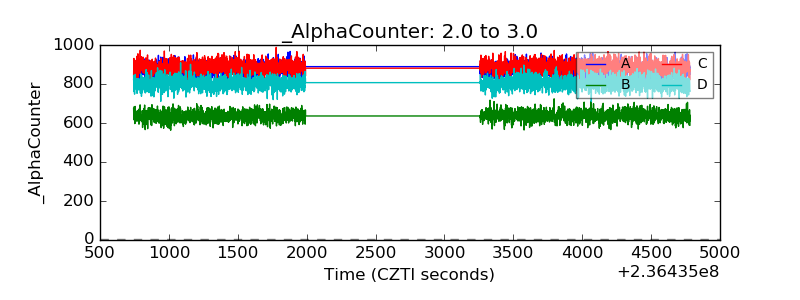 |
| _CPM_Rate | 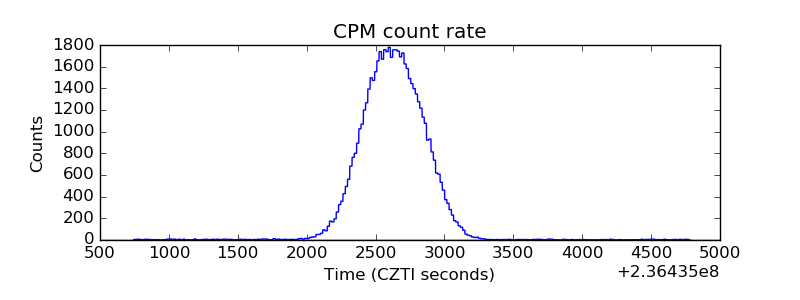 |
| CZT Counter | 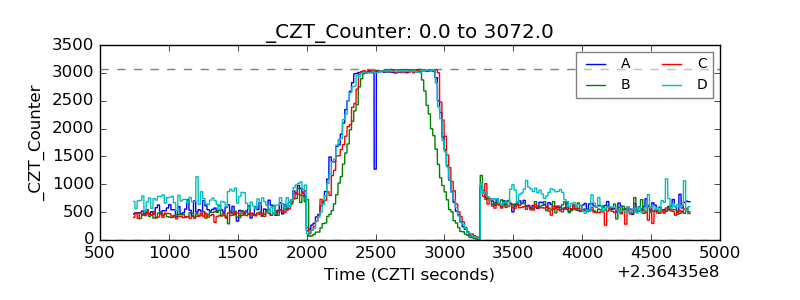 |
| +2.5 Volts monitor |  |
| +5 Volts monitor | 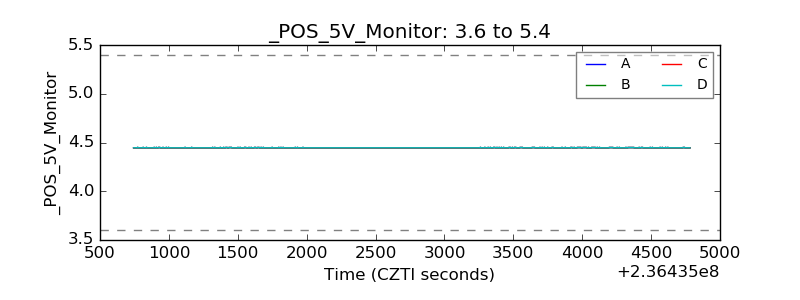 |
| _ROLL_ROT | 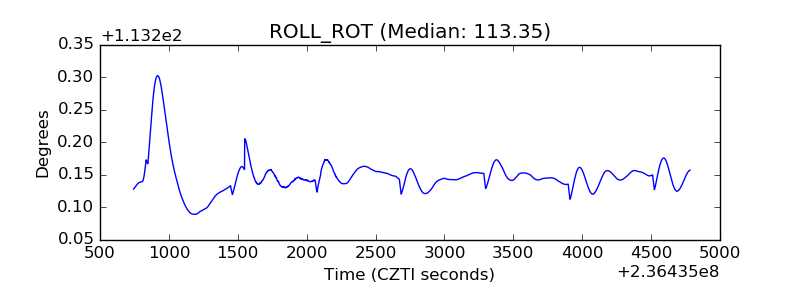 |
| _Roll_DEC | 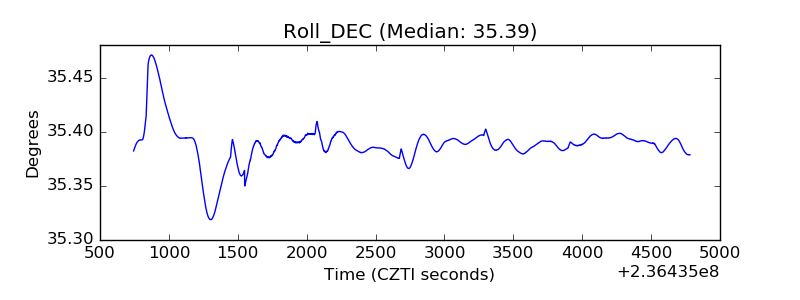 |
| _Roll_RA | 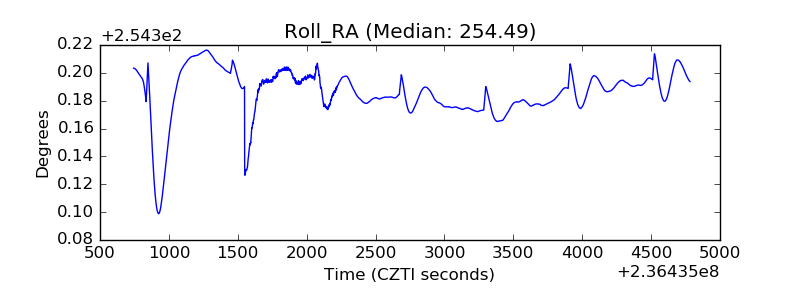 |
| Veto Counter | 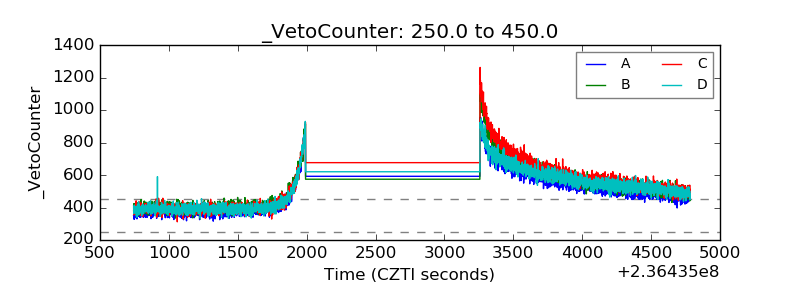 |