| Param | Original file | Final file |
|---|---|---|
| Filename | modeM0/AS1A03_005T01_9000001348_09484cztM0_level2.evt | modeM0/AS1A03_005T01_9000001348_09484cztM0_level2_quad_clean.evt |
| Size (bytes) | 1,455,719,040 | 233,038,080 |
| Size | 1.4 GB | 222.2 MB |
| Events in quadrant A | 9,692,517 | 1,488,885 |
| Events in quadrant B | 8,171,325 | 1,495,543 |
| Events in quadrant C | 8,568,850 | 1,504,955 |
| Events in quadrant D | 16,472,143 | 1,361,023 |
| Mode M0 | |||
|---|---|---|---|
| Quadrant | BADHDUFLAG | Total packets | Discarded packets |
| A | 0 | 40098 | 32 |
| B | 0 | 36248 | 7 |
| C | 0 | 37659 | 5 |
| D | 0 | 61084 | 8 |
| Mode SS | |||
|---|---|---|---|
| Quadrant | BADHDUFLAG | Total packets | Discarded packets |
| A | 0 | 356 | 0 |
| B | 0 | 356 | 0 |
| C | 0 | 356 | 0 |
| D | 0 | 356 | 0 |
| Mode M9 | |||
|---|---|---|---|
| Quadrant | BADHDUFLAG | Total packets | Discarded packets |
| A | 0 | 23 | 0 |
| B | 0 | 23 | 0 |
| C | 0 | 23 | 0 |
| D | 0 | 23 | 0 |
| Quadrant | Total seconds | Saturated seconds | Saturation percentage |
|---|---|---|---|
| A | 17507 | 125 | 0.714000% |
| B | 17514 | 126 | 0.719424% |
| C | 17515 | 156 | 0.890665% |
| D | 17514 | 2585 | 14.759621% |
Noise dominated data is calculated using 1-second bins in cleaned event files. If a bin has >2000 counts, and if more than 50% of those come from <1% of pixels, then it is considered to be noise-dominated and hence unusable.
| Quadrant | # 1 sec bins | Bins with >0 counts | Bins with >2000 counts | High rate bins dominated by noise | Noise dominated (total time) | Noise dominated (detector-on time) | Marked lightcurve |
|---|---|---|---|---|---|---|---|
| A | 19796 | 17520 | 4 | 4 | 0.02% | 0.02% | 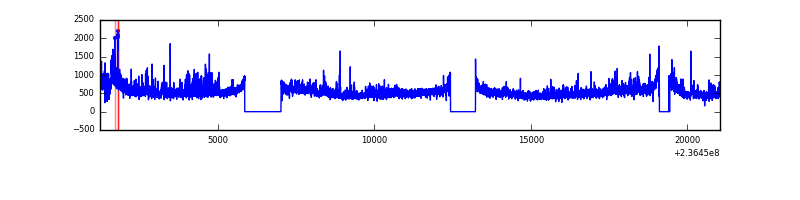 |
| B | 19796 | 17520 | 3 | 3 | 0.02% | 0.02% | 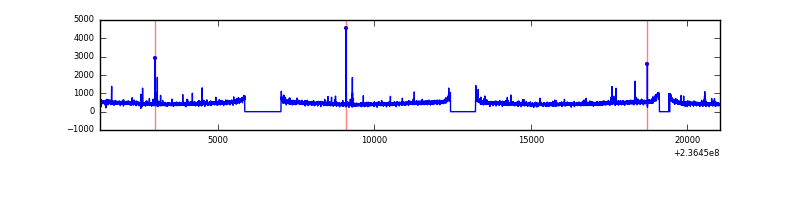 |
| C | 19796 | 17520 | 58 | 58 | 0.29% | 0.33% | 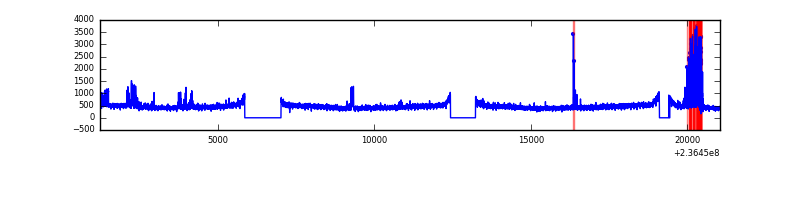 |
| D | 19796 | 17520 | 2202 | 2202 | 11.12% | 12.57% | 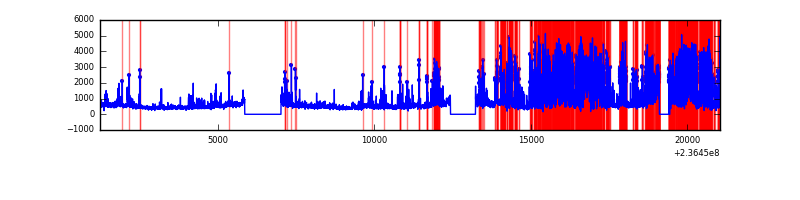 |
Top three noisy pixels from each quadrant. If the there are fewer than three noisy pixels in the level2.evt file, extra rows are filled as -1
| Pixel properties | Quadrant properties | ||||||
|---|---|---|---|---|---|---|---|
| Quadrant | DetID | PixID | Counts | Sigma | Mean | Median | Sigma |
| A | 8 | 5 | 1450168 | 3457.38 | 2073 | 2035 | 418.9 |
| A | 1 | 162 | 148089 | 348.7 | 2073 | 2035 | 418.9 |
| A | 1 | 178 | 46029 | 105.03 | 2073 | 2035 | 418.9 |
| B | 4 | 173 | 73449 | 182.76 | 2071 | 2018 | 390.9 |
| B | 12 | 111 | 44880 | 109.66 | 2071 | 2018 | 390.9 |
| B | 11 | 111 | 36107 | 87.22 | 2071 | 2018 | 390.9 |
| C | 4 | 254 | 380707 | 809.7 | 2039 | 2053 | 467.6 |
| C | 9 | 68 | 221075 | 468.35 | 2039 | 2053 | 467.6 |
| C | 13 | 61 | 15130 | 27.96 | 2039 | 2053 | 467.6 |
| D | 1 | 52 | 7857467 | 17344.69 | 1884 | 1839 | 452.9 |
| D | 8 | 195 | 721298 | 1588.52 | 1884 | 1839 | 452.9 |
| D | 2 | 136 | 297343 | 652.45 | 1884 | 1839 | 452.9 |
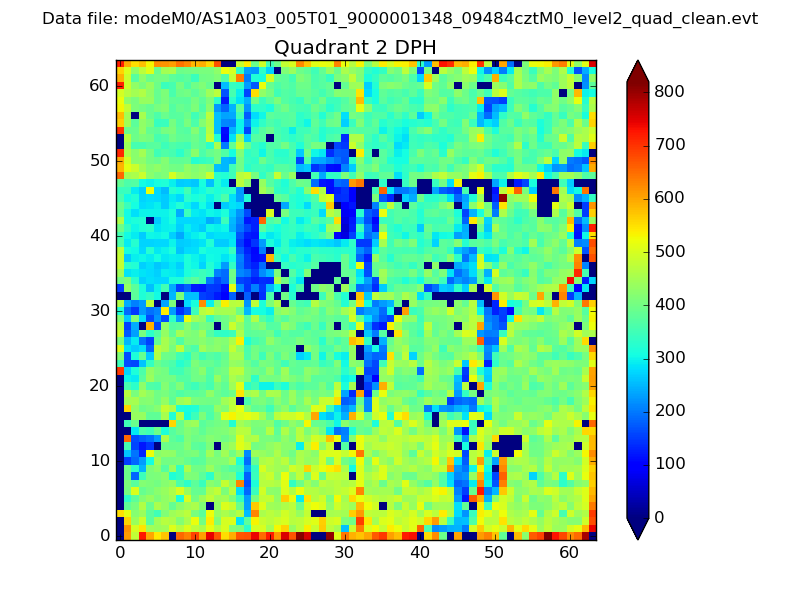
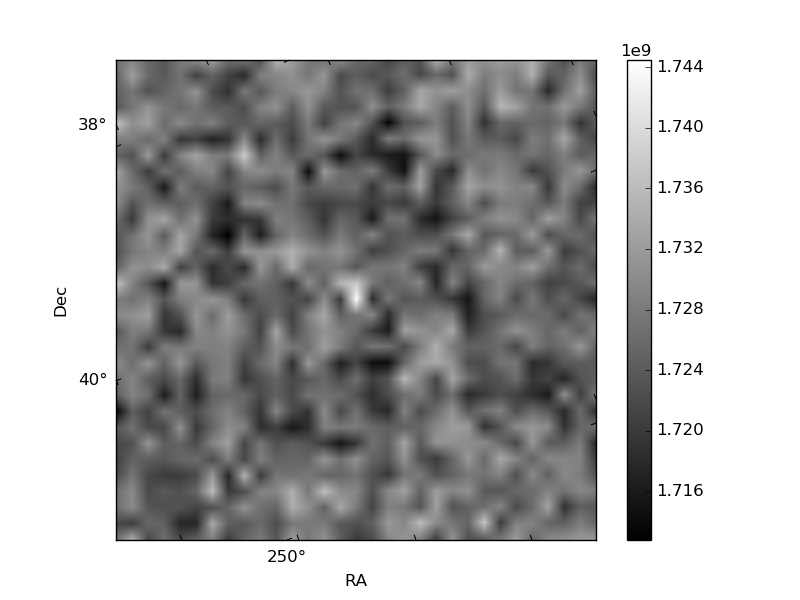
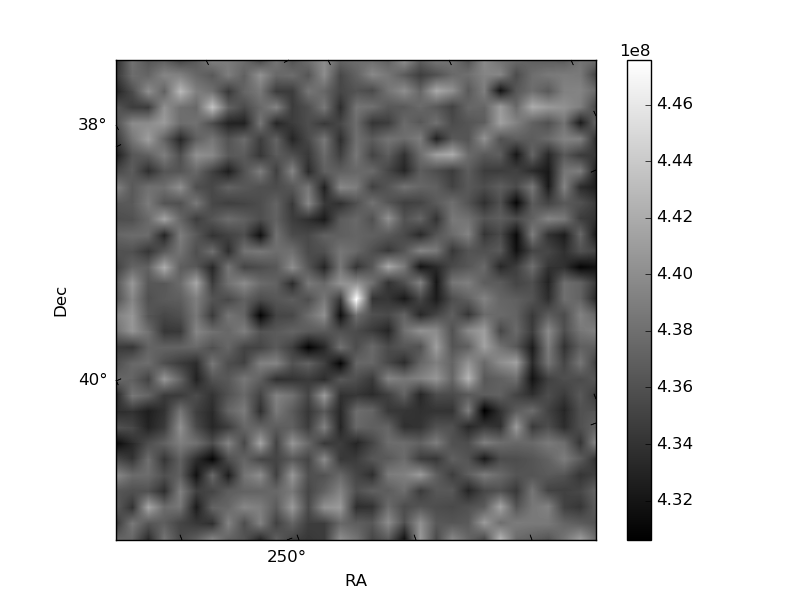
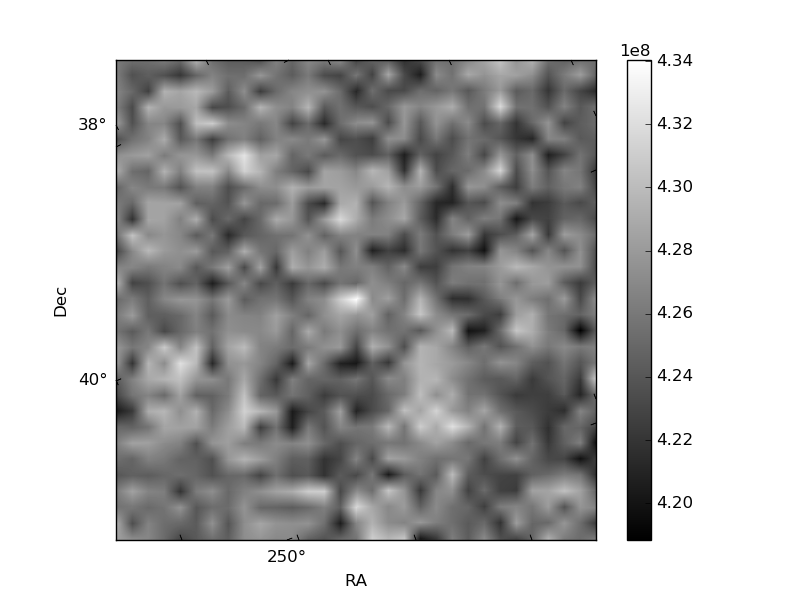
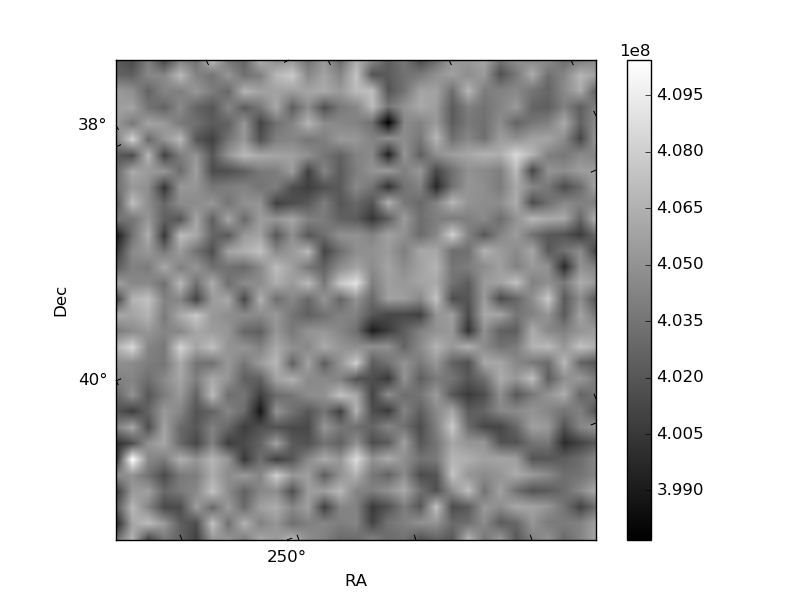
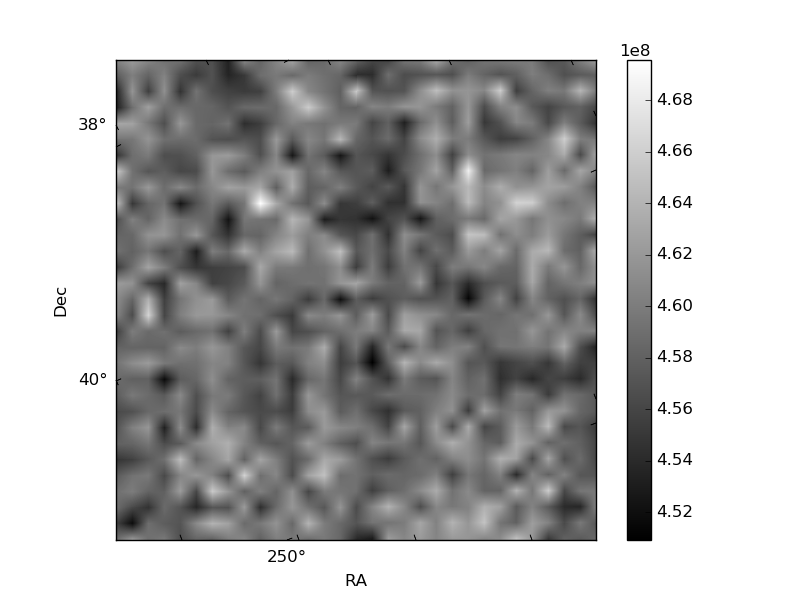
Histogram calculated using DETX and DETY for each event in the final _common_clean file
| Quadrant A | 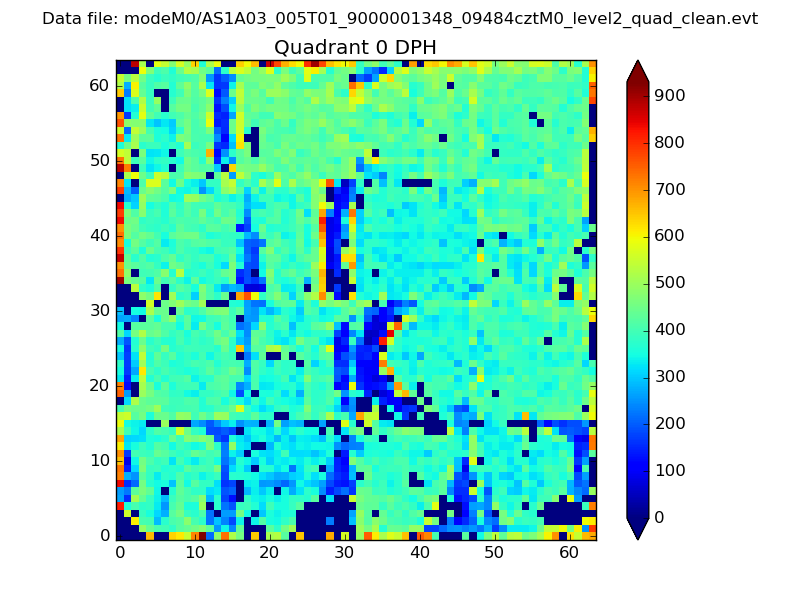 |
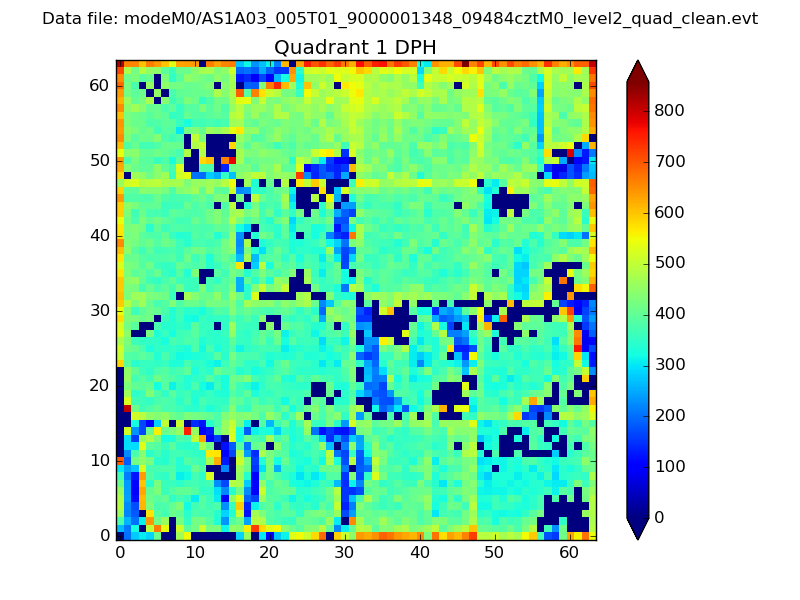 |
Quadrant B |
|---|---|---|---|
| Quadrant D | 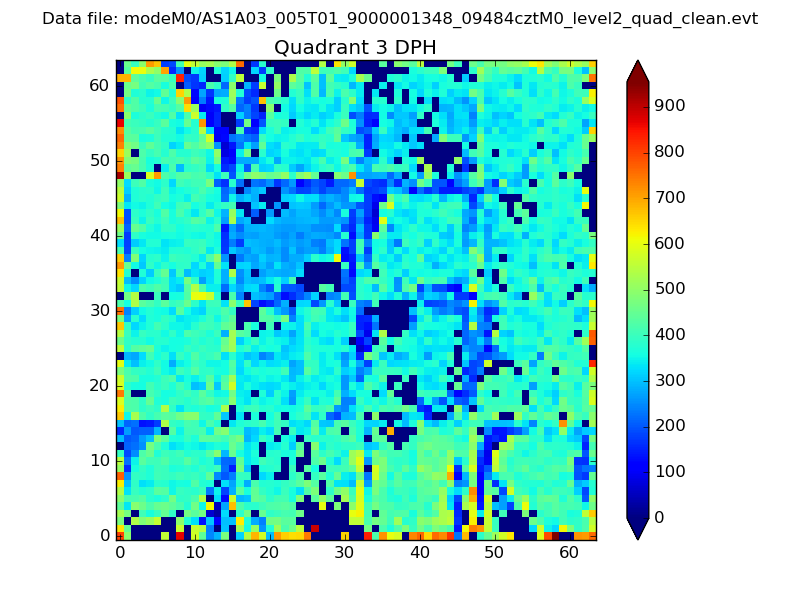 |
 |
Quadrant C |
| Plot type | Count rate plots | Images |
|---|---|---|
| Comparison with Poisson distribution Blue bars denote a histogram of data divided into 1 sec bins. Red curve is a Poisson curve with rate = median count rate of data. |
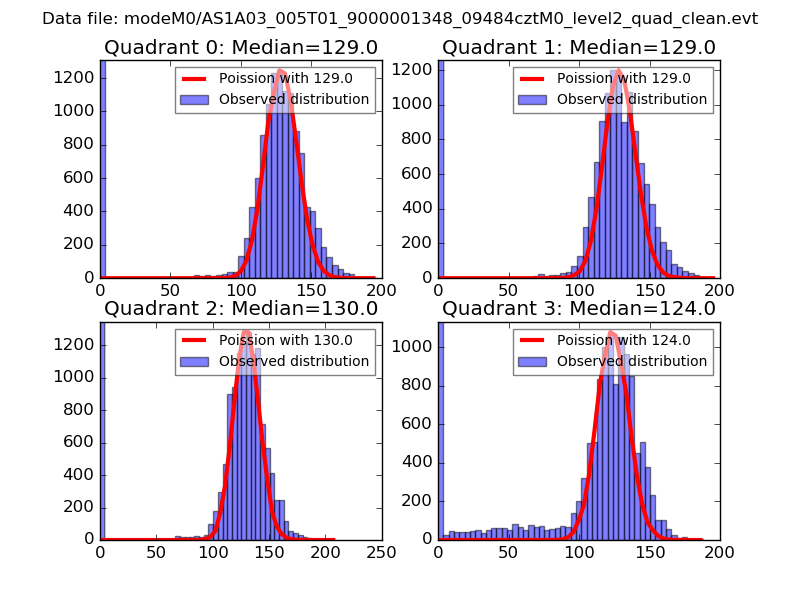 |
 |
| Quadrant-wise count rates Data is divided into 100 sec bins |
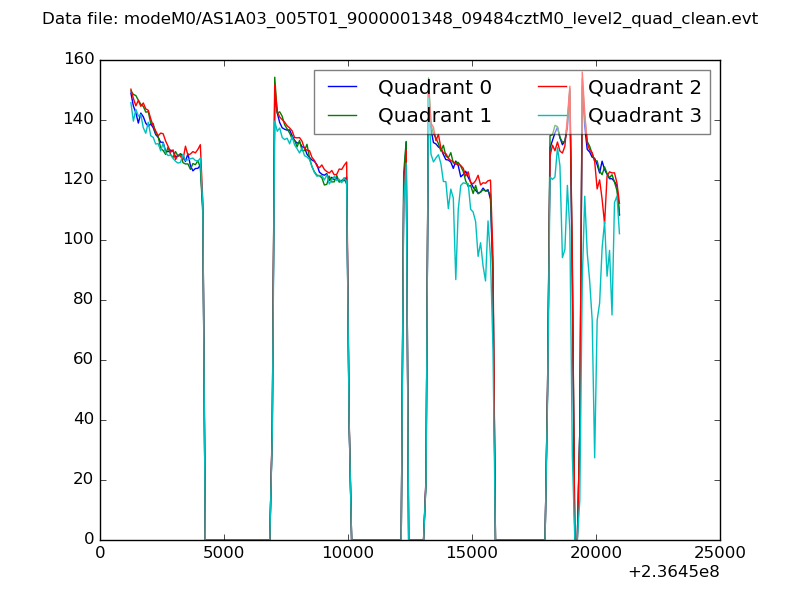 |
|
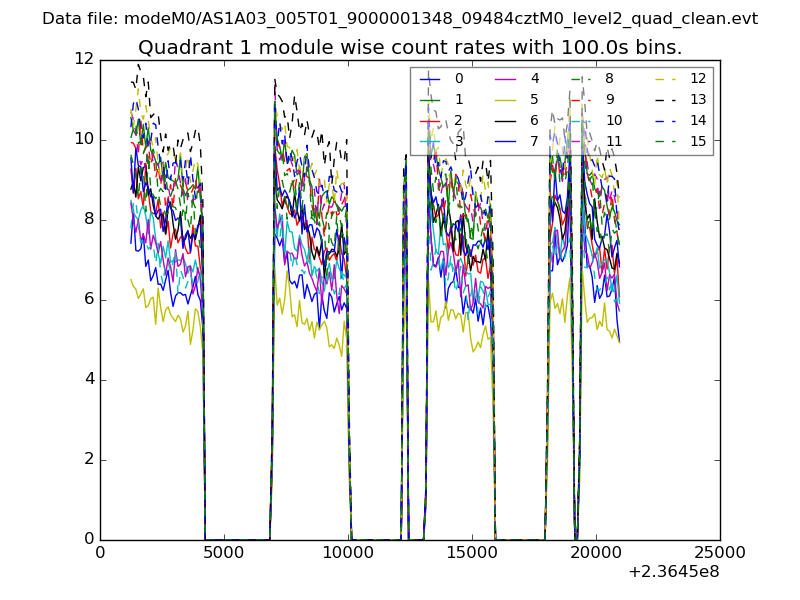
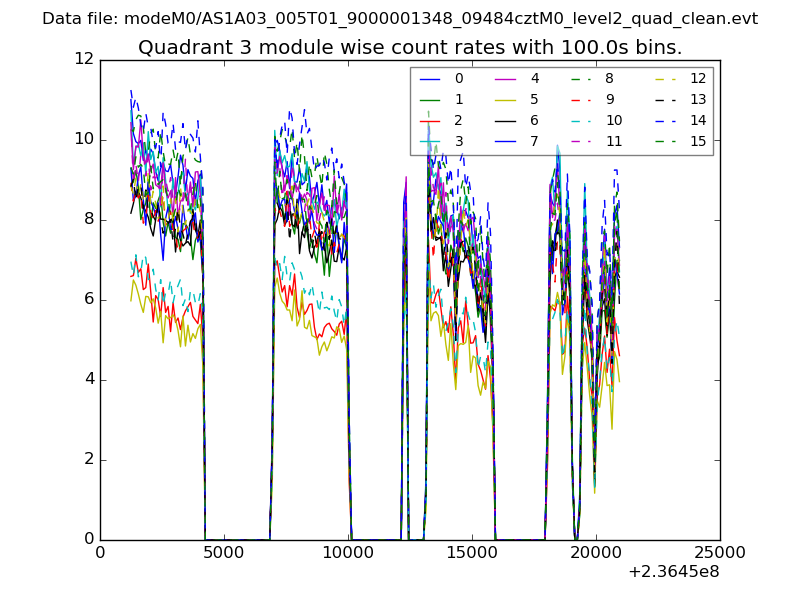
| Module-wise count rates for Quadrant A Data is divided into 100 sec bins |
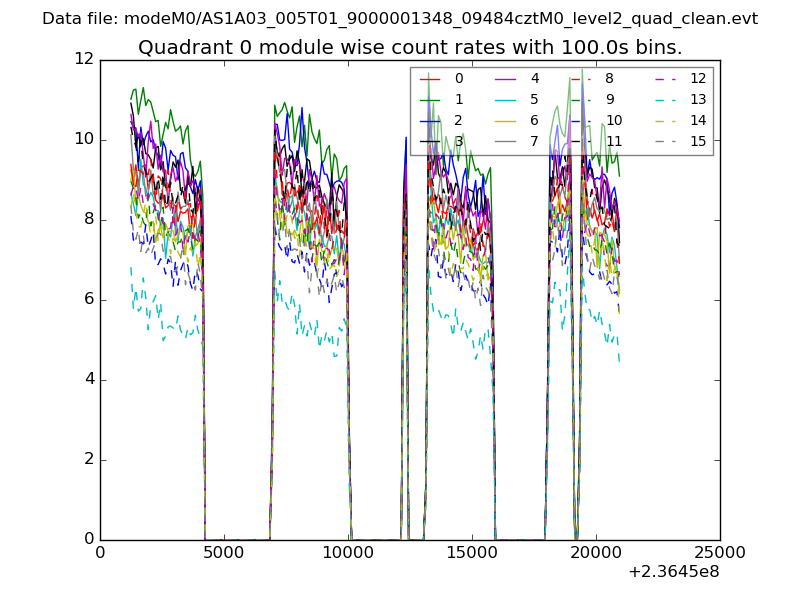 |
 |
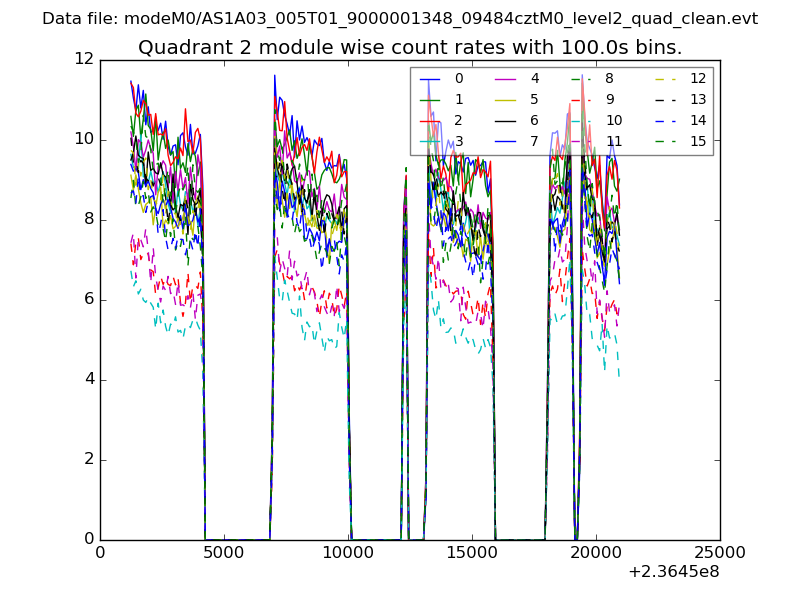
| Module-wise count rates for Quadrant B Data is divided into 100 sec bins |
 |
 |
| Module-wise count rates for Quadrant C Data is divided into 100 sec bins |
 |
 |
| Module-wise count rates for Quadrant D Data is divided into 100 sec bins |
 |
 |
| Parameter | Plot |
|---|---|
| CZT HV Monitor | 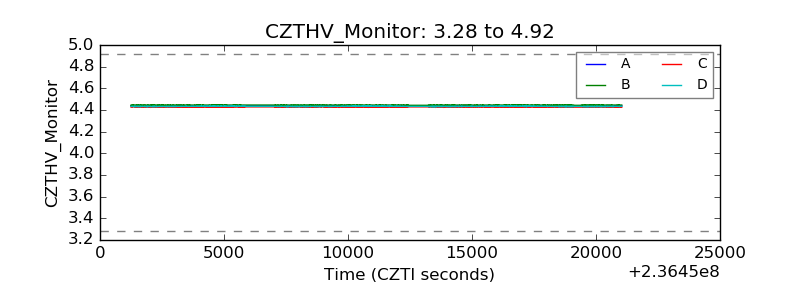 |
| D_VDD | 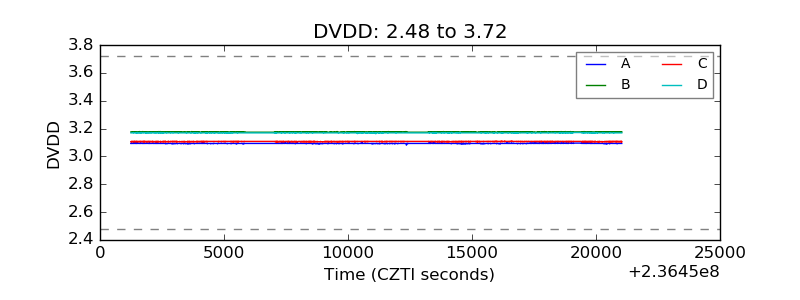 |
| Temperature 1 | 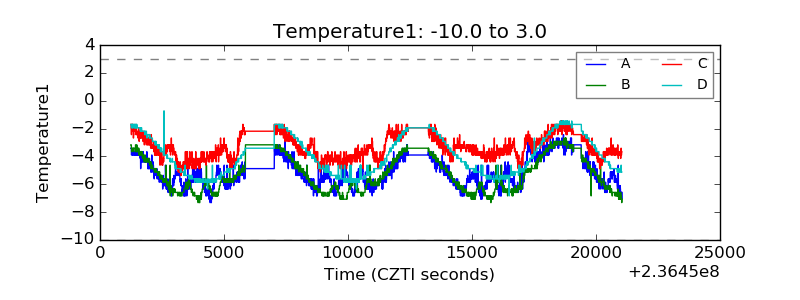 |
| Veto HV Monitor | 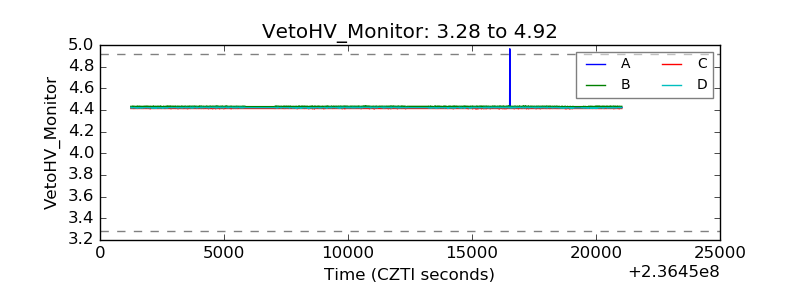 |
| Veto LLD | 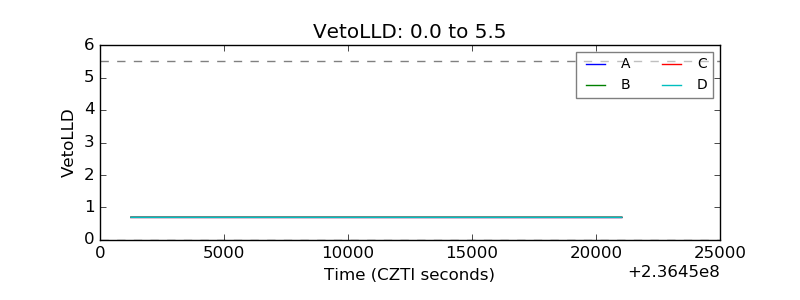 |
| Alpha Counter | 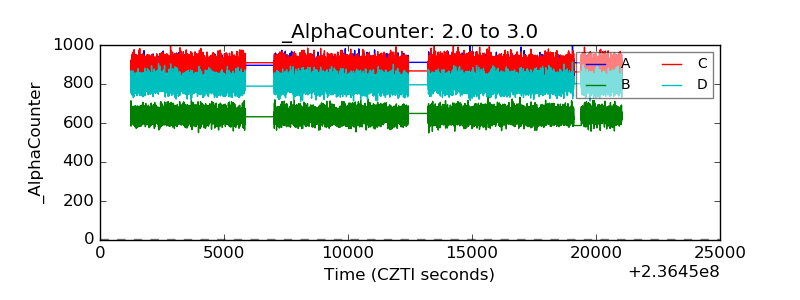 |
| _CPM_Rate |  |
| CZT Counter | 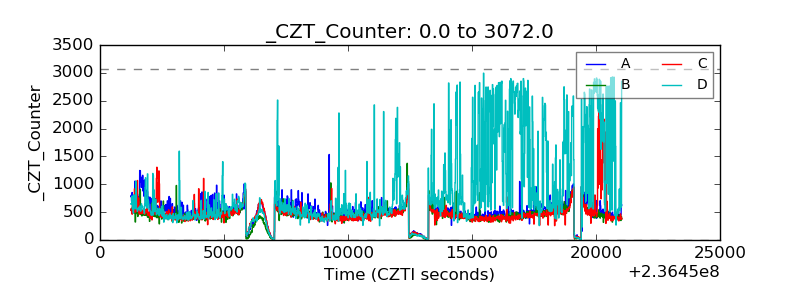 |
| +2.5 Volts monitor |  |
| +5 Volts monitor |  |
| _ROLL_ROT | 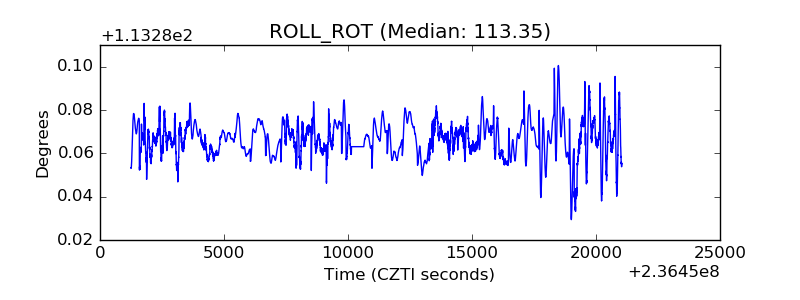 |
| _Roll_DEC | 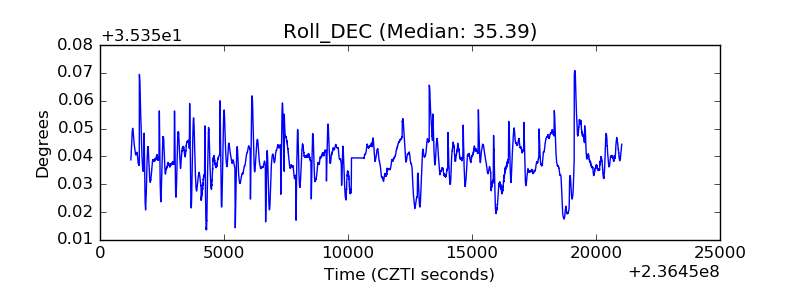 |
| _Roll_RA | 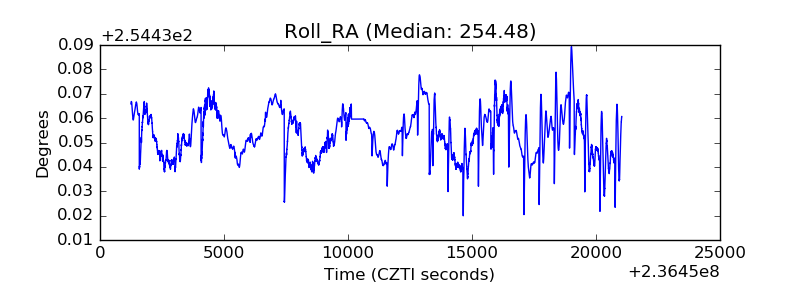 |
| Veto Counter | 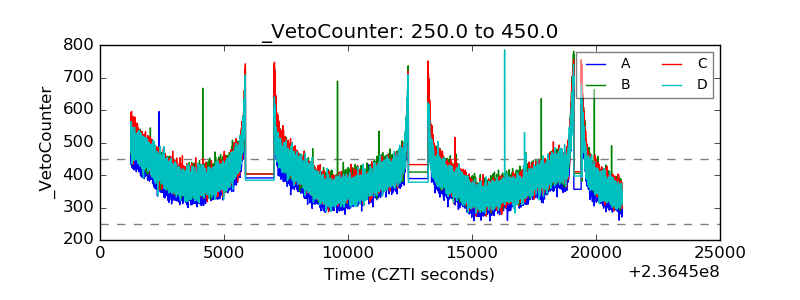 |