| Param | Original file | Final file |
|---|---|---|
| Filename | modeM0/AS1A03_005T01_9000001348_09485cztM0_level2.evt | modeM0/AS1A03_005T01_9000001348_09485cztM0_level2_quad_clean.evt |
| Size (bytes) | 2,534,863,680 | 473,258,880 |
| Size | 2.4 GB | 451.3 MB |
| Events in quadrant A | 18,246,906 | 3,028,399 |
| Events in quadrant B | 15,524,520 | 3,086,440 |
| Events in quadrant C | 16,261,362 | 3,100,912 |
| Events in quadrant D | 24,552,608 | 2,894,125 |
| Mode M0 | |||
|---|---|---|---|
| Quadrant | BADHDUFLAG | Total packets | Discarded packets |
| A | 0 | 77080 | 1937 |
| B | 0 | 68552 | 327 |
| C | 0 | 71046 | 470 |
| D | 0 | 96466 | 1368 |
| Mode SS | |||
|---|---|---|---|
| Quadrant | BADHDUFLAG | Total packets | Discarded packets |
| A | 0 | 670 | 4 |
| B | 0 | 670 | 2 |
| C | 0 | 670 | 0 |
| D | 0 | 670 | 2 |
| Quadrant | Total seconds | Saturated seconds | Saturation percentage |
|---|---|---|---|
| A | 31932 | 462 | 1.446825% |
| B | 32538 | 406 | 1.247772% |
| C | 32535 | 461 | 1.416936% |
| D | 32443 | 2303 | 7.098604% |
Noise dominated data is calculated using 1-second bins in cleaned event files. If a bin has >2000 counts, and if more than 50% of those come from <1% of pixels, then it is considered to be noise-dominated and hence unusable.
| Quadrant | # 1 sec bins | Bins with >0 counts | Bins with >2000 counts | High rate bins dominated by noise | Noise dominated (total time) | Noise dominated (detector-on time) | Marked lightcurve |
|---|---|---|---|---|---|---|---|
| A | 41482 | 32109 | 5 | 5 | 0.01% | 0.02% | 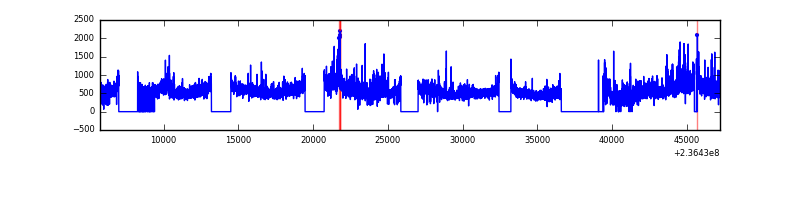 |
| B | 41482 | 32695 | 3 | 3 | 0.01% | 0.01% | 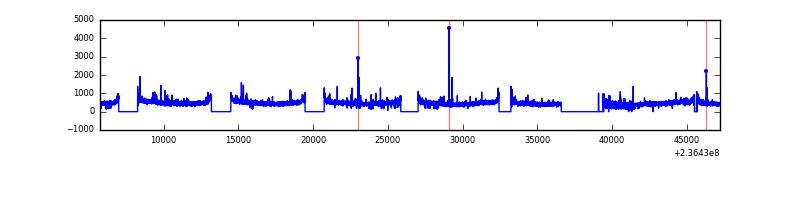 |
| C | 41482 | 32691 | 81 | 81 | 0.20% | 0.25% | 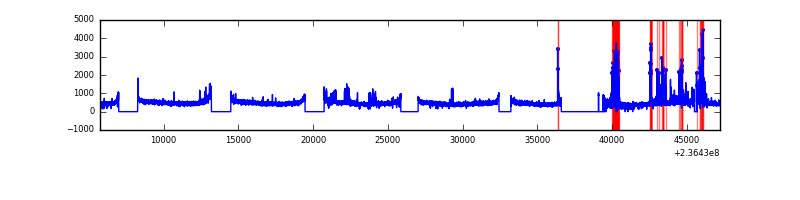 |
| D | 41482 | 32648 | 1791 | 1791 | 4.32% | 5.49% |  |
Top three noisy pixels from each quadrant. If the there are fewer than three noisy pixels in the level2.evt file, extra rows are filled as -1
| Pixel properties | Quadrant properties | ||||||
|---|---|---|---|---|---|---|---|
| Quadrant | DetID | PixID | Counts | Sigma | Mean | Median | Sigma |
| A | 8 | 5 | 2929803 | 3798.48 | 3861 | 3786 | 770.3 |
| A | 1 | 162 | 256118 | 327.57 | 3861 | 3786 | 770.3 |
| A | 1 | 178 | 81492 | 100.88 | 3861 | 3786 | 770.3 |
| B | 4 | 173 | 133559 | 175.77 | 3945 | 3852 | 737.9 |
| B | 12 | 111 | 83668 | 108.16 | 3945 | 3852 | 737.9 |
| B | 11 | 111 | 67852 | 86.73 | 3945 | 3852 | 737.9 |
| C | 4 | 254 | 695893 | 781.63 | 3888 | 3922 | 885.3 |
| C | 9 | 68 | 375319 | 419.52 | 3888 | 3922 | 885.3 |
| C | 13 | 61 | 28788 | 28.09 | 3888 | 3922 | 885.3 |
| D | 1 | 52 | 6124423 | 6860.94 | 3752 | 3682 | 892.1 |
| D | 8 | 195 | 2100702 | 2350.62 | 3752 | 3682 | 892.1 |
| D | 7 | 71 | 678611 | 756.55 | 3752 | 3682 | 892.1 |
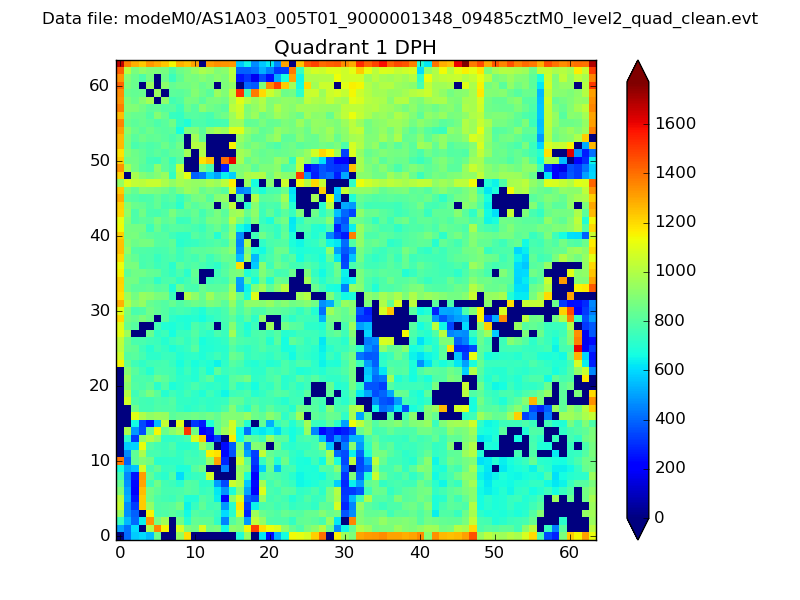
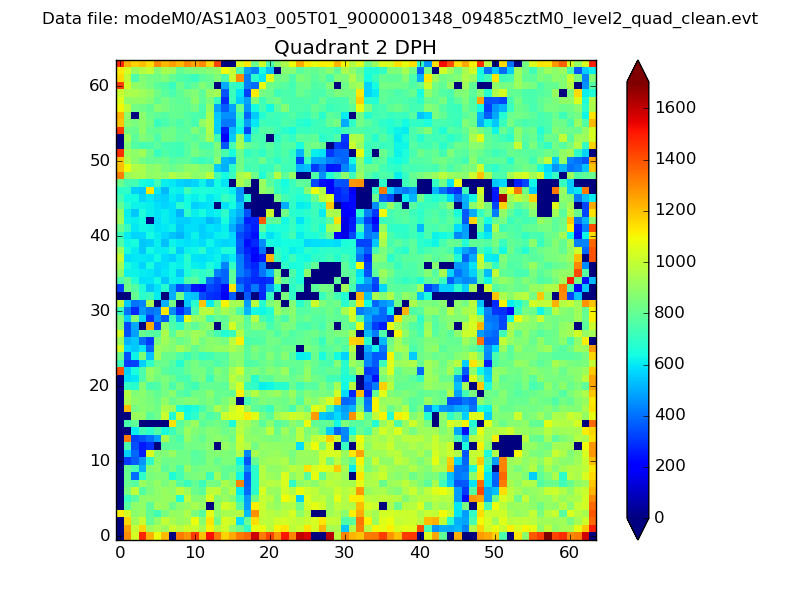
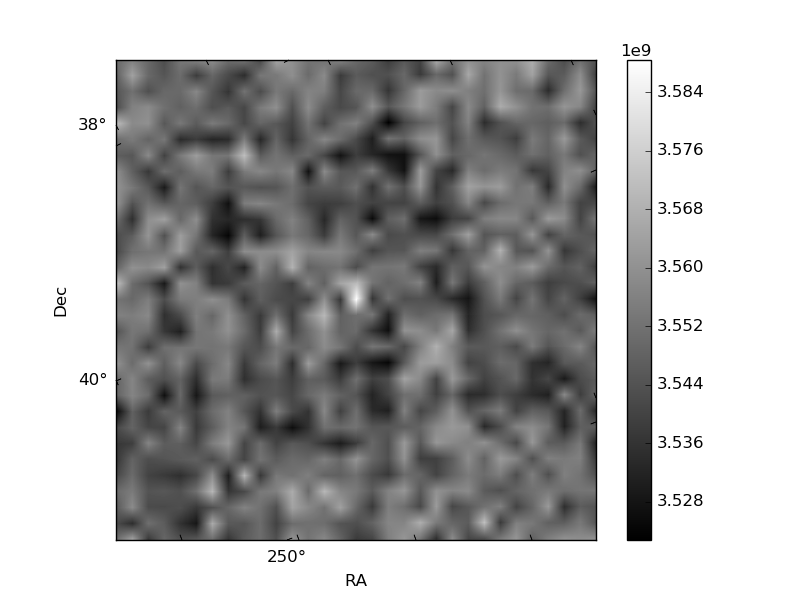
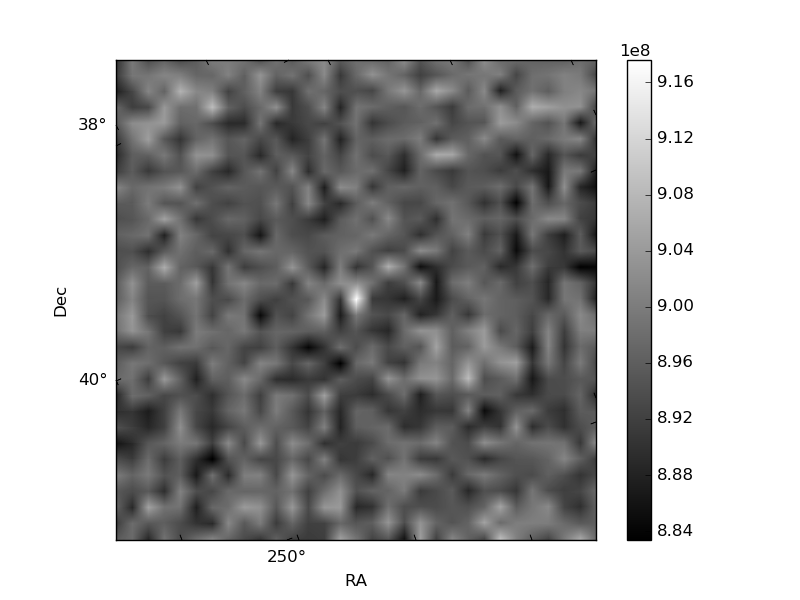
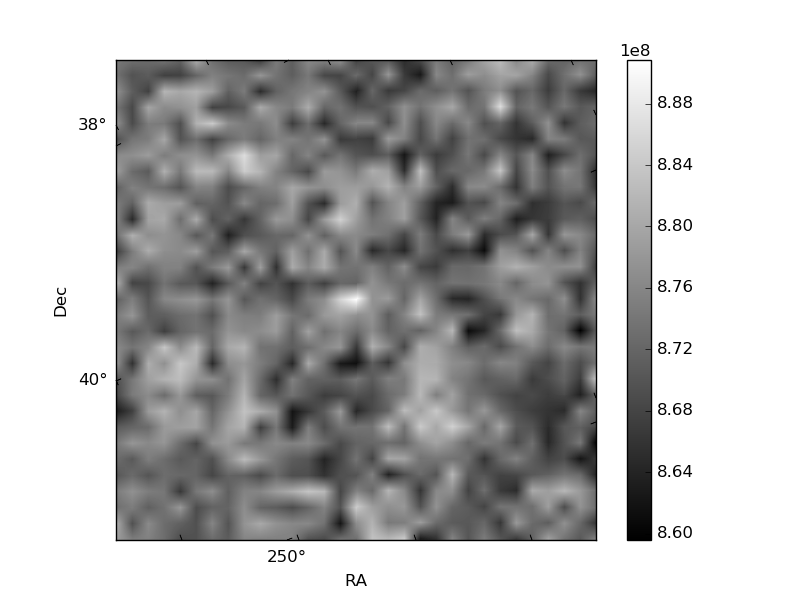
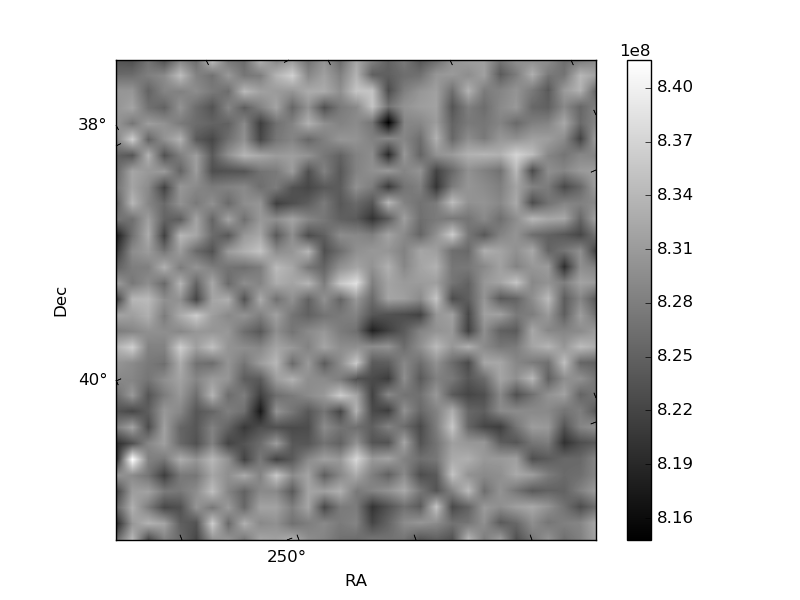
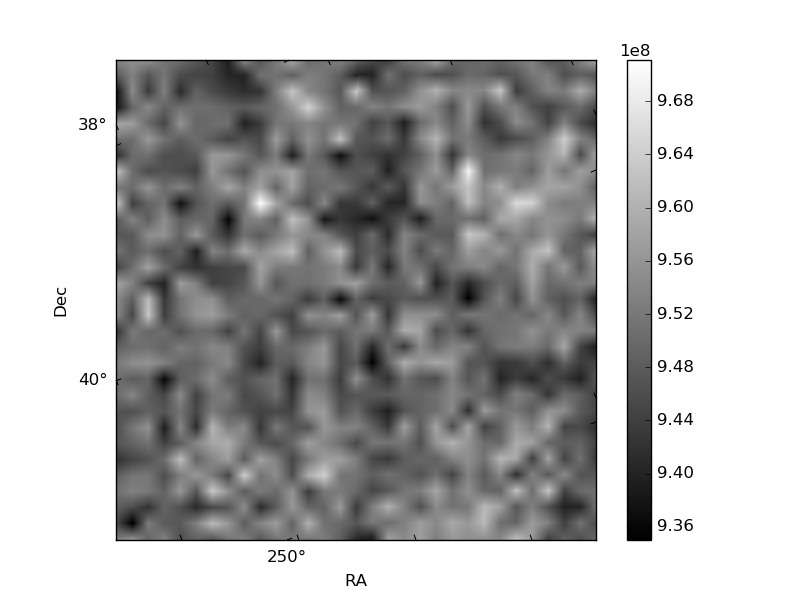
Histogram calculated using DETX and DETY for each event in the final _common_clean file
| Quadrant A | 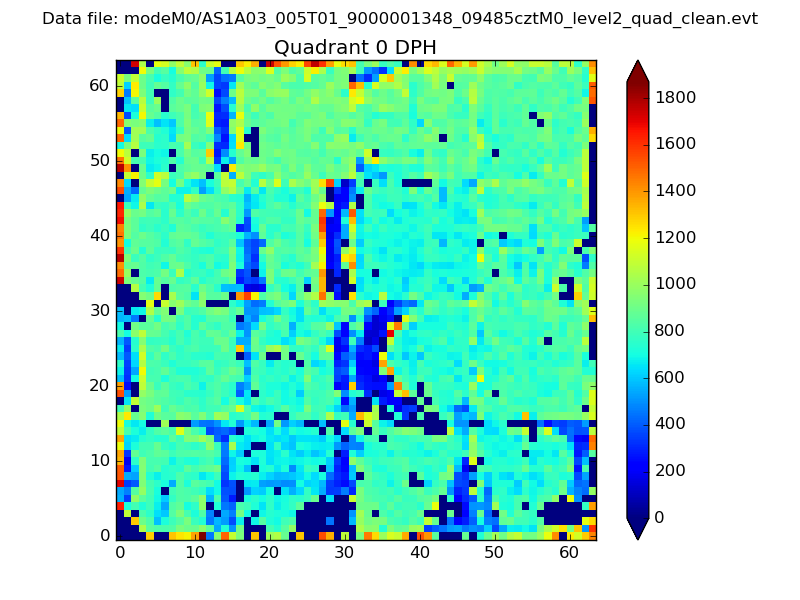 |
 |
Quadrant B |
|---|---|---|---|
| Quadrant D | 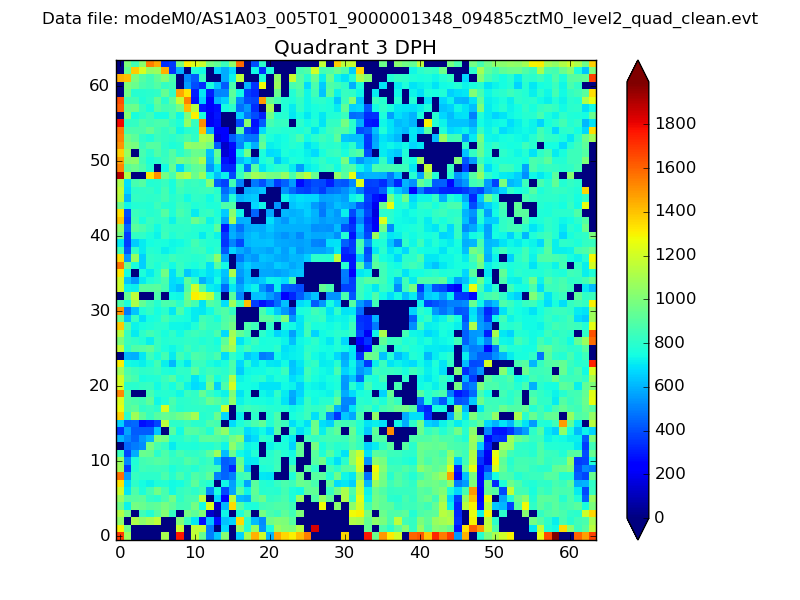 |
 |
Quadrant C |
| Plot type | Count rate plots | Images |
|---|---|---|
| Comparison with Poisson distribution Blue bars denote a histogram of data divided into 1 sec bins. Red curve is a Poisson curve with rate = median count rate of data. |
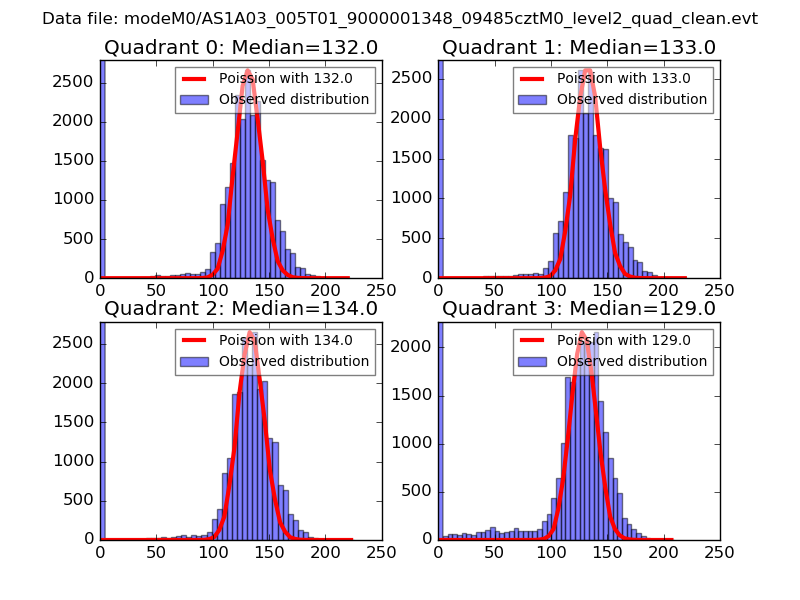 |
 |
| Quadrant-wise count rates Data is divided into 100 sec bins |
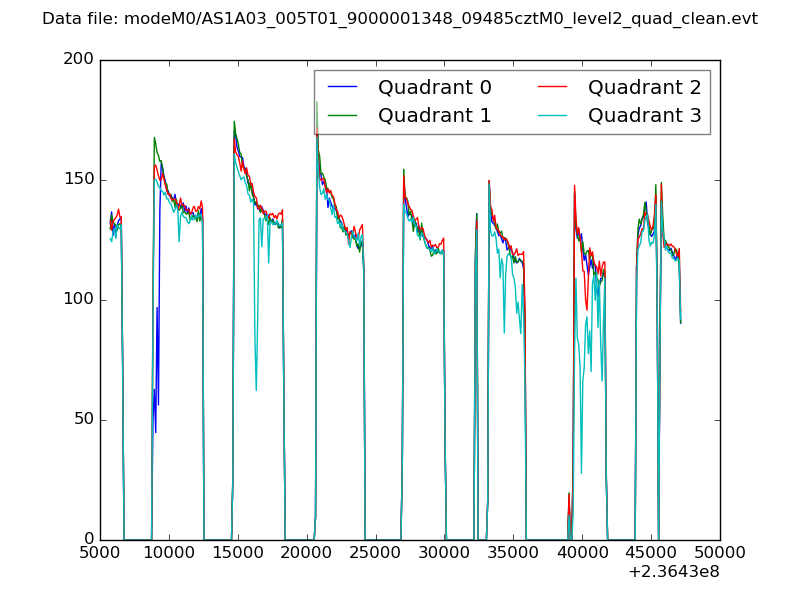 |
|
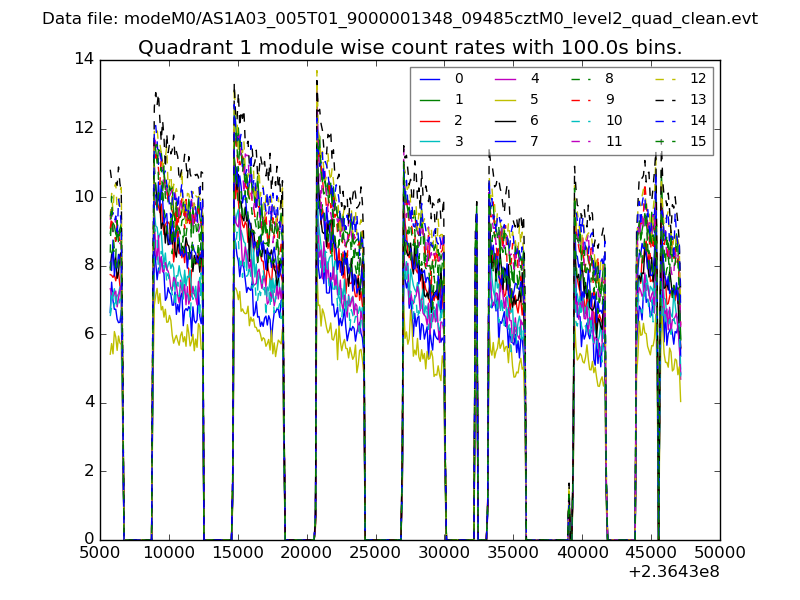
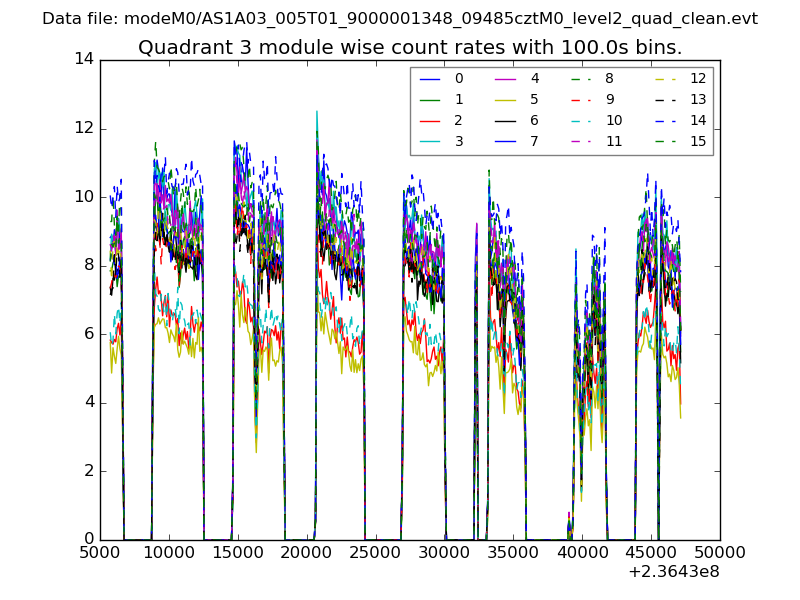
| Module-wise count rates for Quadrant A Data is divided into 100 sec bins |
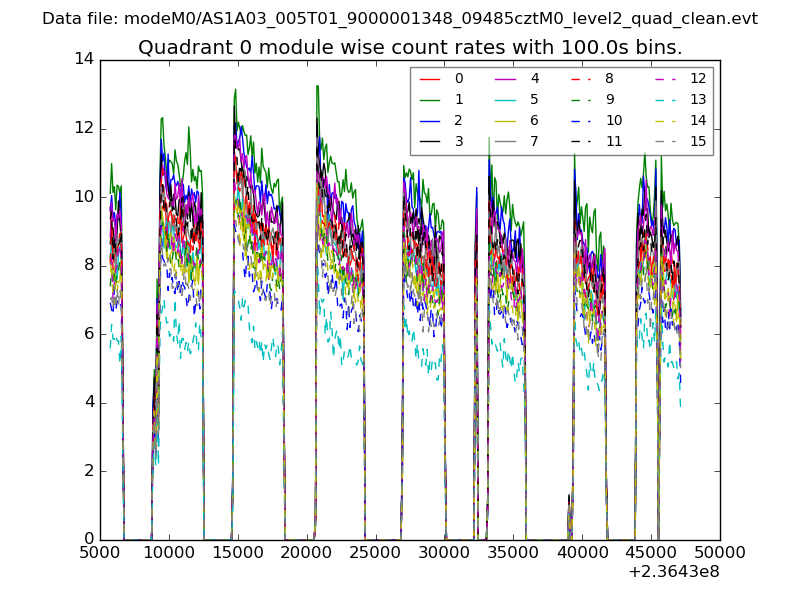 |
 |
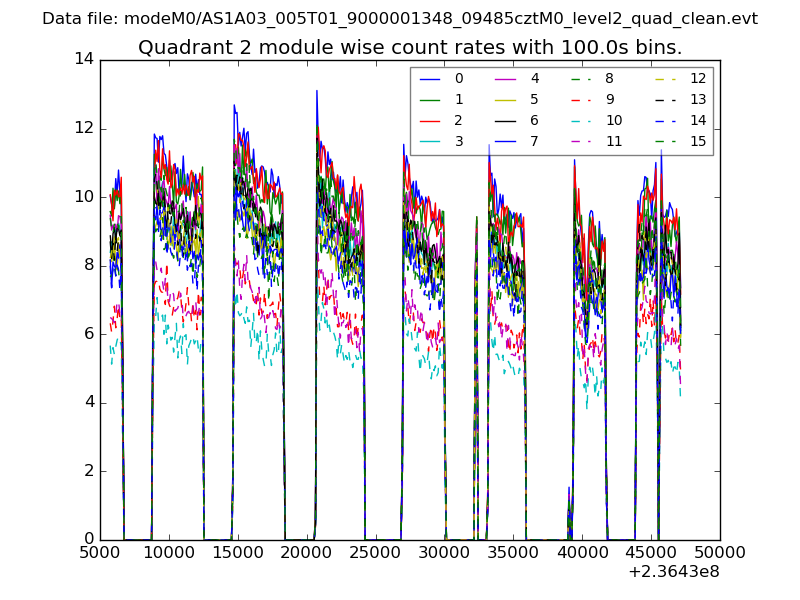
| Module-wise count rates for Quadrant B Data is divided into 100 sec bins |
 |
 |
| Module-wise count rates for Quadrant C Data is divided into 100 sec bins |
 |
 |
| Module-wise count rates for Quadrant D Data is divided into 100 sec bins |
 |
 |
| Parameter | Plot |
|---|---|
| CZT HV Monitor | 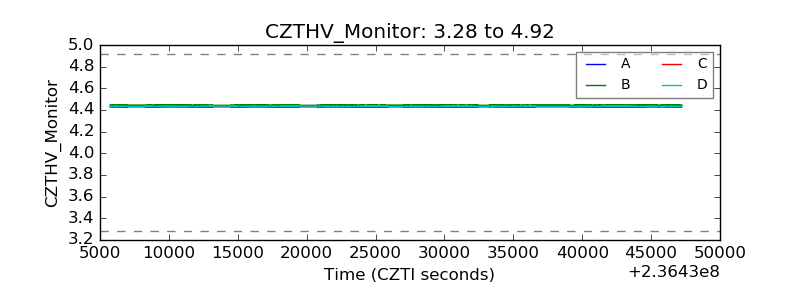 |
| D_VDD | 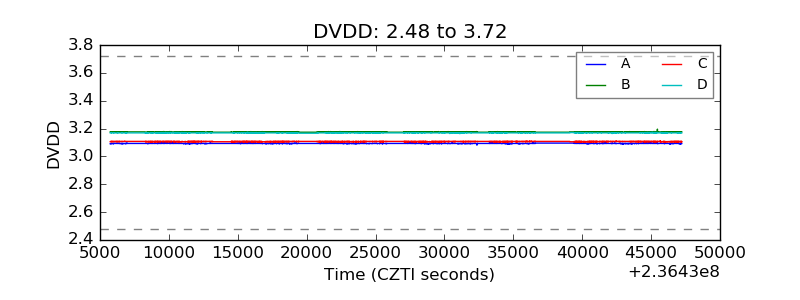 |
| Temperature 1 |  |
| Veto HV Monitor | 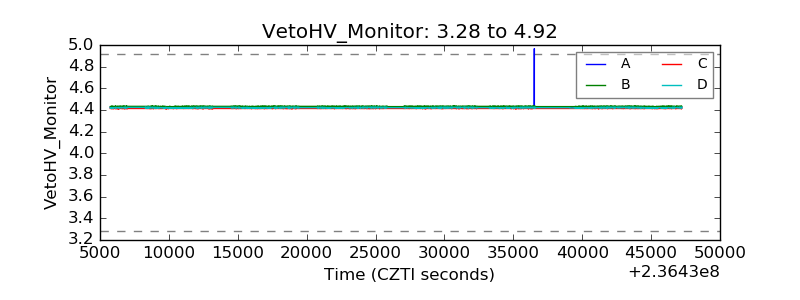 |
| Veto LLD | 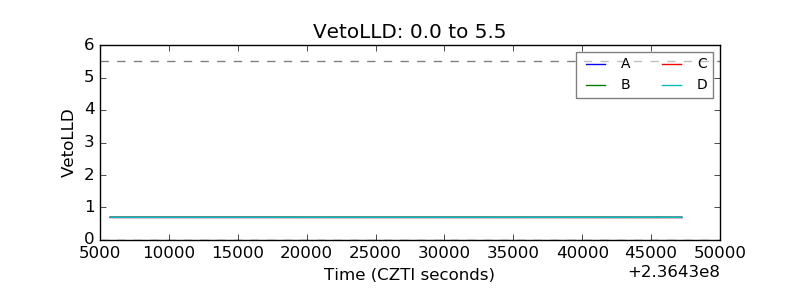 |
| Alpha Counter | 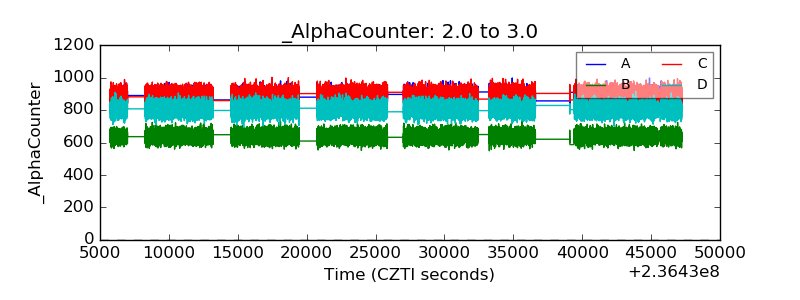 |
| _CPM_Rate | 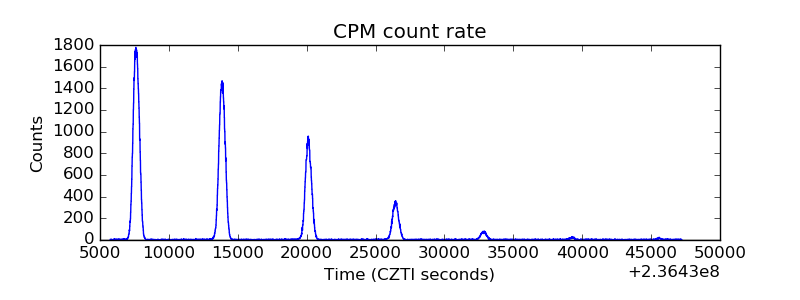 |
| CZT Counter | 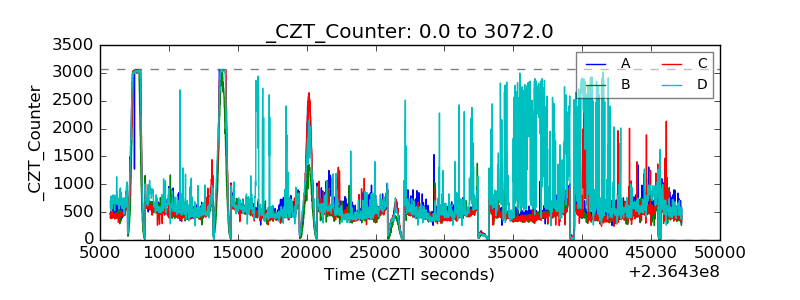 |
| +2.5 Volts monitor |  |
| +5 Volts monitor |  |
| _ROLL_ROT | 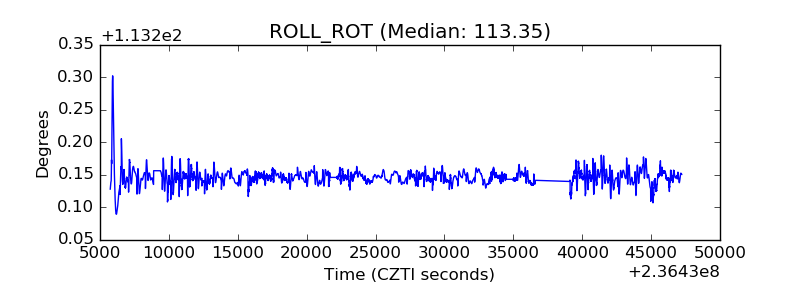 |
| _Roll_DEC | 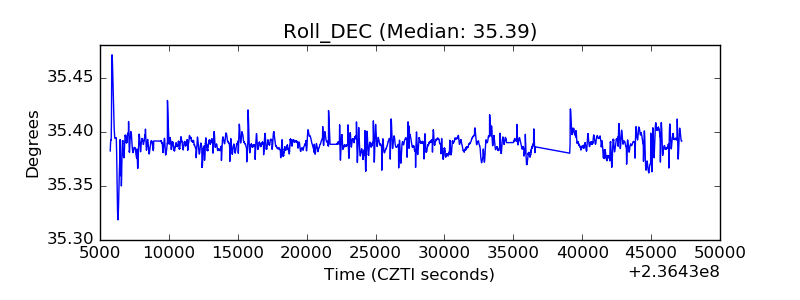 |
| _Roll_RA | 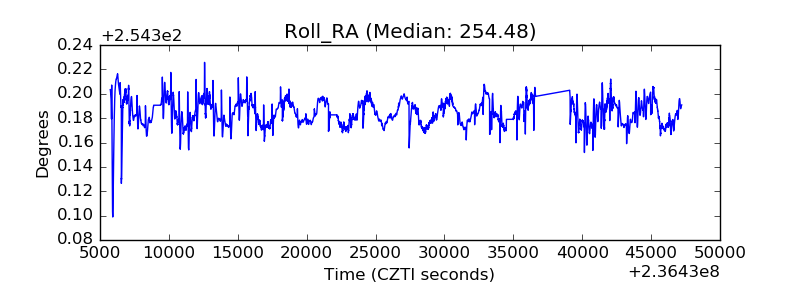 |
| Veto Counter | 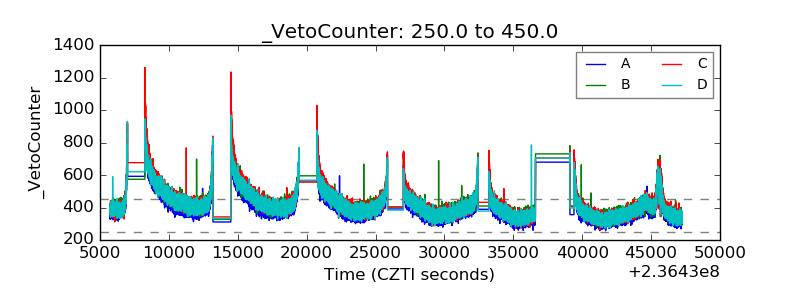 |