| Param | Original file | Final file |
|---|---|---|
| Filename | modeM0/AS1A03_005T01_9000001348_09489cztM0_level2.evt | modeM0/AS1A03_005T01_9000001348_09489cztM0_level2_quad_clean.evt |
| Size (bytes) | 139,668,480 | 21,729,600 |
| Size | 133.2 MB | 20.7 MB |
| Events in quadrant A | 1,055,287 | 120,719 |
| Events in quadrant B | 979,157 | 133,298 |
| Events in quadrant C | 964,846 | 129,337 |
| Events in quadrant D | 1,079,754 | 117,573 |
| Mode M0 | |||
|---|---|---|---|
| Quadrant | BADHDUFLAG | Total packets | Discarded packets |
| A | 0 | 10235 | 5812 |
| B | 0 | 9653 | 5224 |
| C | 0 | 9656 | 5273 |
| D | 0 | 11475 | 6908 |
| Mode SS | |||
|---|---|---|---|
| Quadrant | BADHDUFLAG | Total packets | Discarded packets |
| A | 0 | 96 | 52 |
| B | 0 | 96 | 64 |
| C | 0 | 96 | 44 |
| D | 0 | 96 | 44 |
| Quadrant | Total seconds | Saturated seconds | Saturation percentage |
|---|---|---|---|
| A | 2123 | 4 | 0.188413% |
| B | 2212 | 5 | 0.226040% |
| C | 2186 | 2 | 0.091491% |
| D | 2054 | 6 | 0.292113% |
Noise dominated data is calculated using 1-second bins in cleaned event files. If a bin has >2000 counts, and if more than 50% of those come from <1% of pixels, then it is considered to be noise-dominated and hence unusable.
| Quadrant | # 1 sec bins | Bins with >0 counts | Bins with >2000 counts | High rate bins dominated by noise | Noise dominated (total time) | Noise dominated (detector-on time) | Marked lightcurve |
|---|---|---|---|---|---|---|---|
| A | 4838 | 3066 | 0 | 0 | 0.00% | 0.00% | 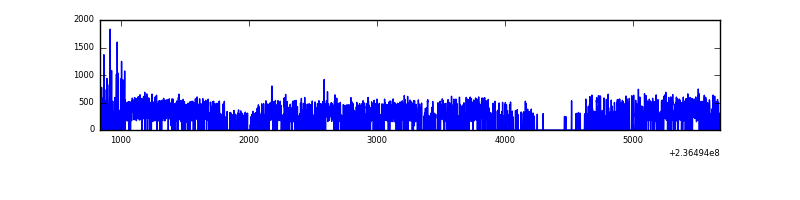 |
| B | 4838 | 3166 | 0 | 0 | 0.00% | 0.00% | 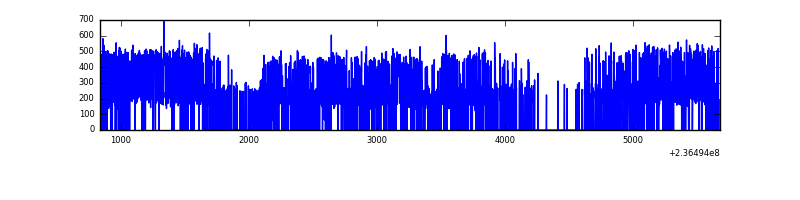 |
| C | 4843 | 3130 | 0 | 0 | 0.00% | 0.00% | 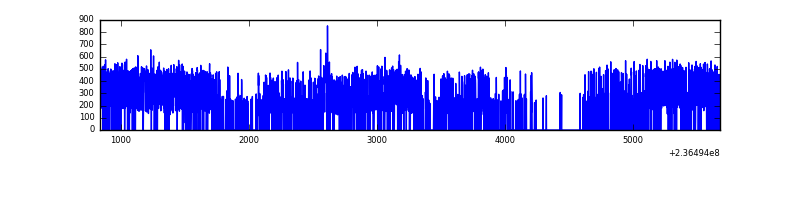 |
| D | 4844 | 2969 | 4 | 4 | 0.08% | 0.13% | 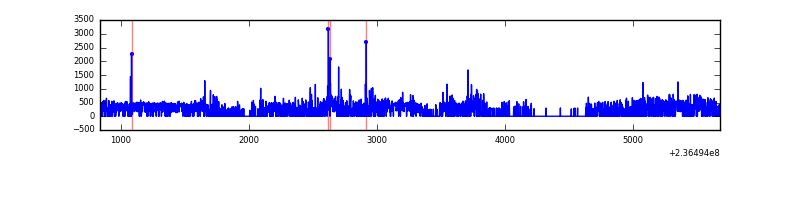 |
Top three noisy pixels from each quadrant. If the there are fewer than three noisy pixels in the level2.evt file, extra rows are filled as -1
| Pixel properties | Quadrant properties | ||||||
|---|---|---|---|---|---|---|---|
| Quadrant | DetID | PixID | Counts | Sigma | Mean | Median | Sigma |
| A | 8 | 5 | 105738 | 2082.1 | 241 | 236 | 50.7 |
| A | 1 | 162 | 13348 | 258.77 | 241 | 236 | 50.7 |
| A | 1 | 178 | 3565 | 65.7 | 241 | 236 | 50.7 |
| B | 12 | 111 | 5753 | 108.84 | 252 | 246 | 50.6 |
| B | 11 | 111 | 4591 | 85.87 | 252 | 246 | 50.6 |
| B | 14 | 111 | 3694 | 68.14 | 252 | 246 | 50.6 |
| C | 9 | 68 | 15271 | 258.28 | 241 | 243 | 58.2 |
| C | 4 | 254 | 5626 | 92.52 | 241 | 243 | 58.2 |
| C | 13 | 61 | 1858 | 27.76 | 241 | 243 | 58.2 |
| D | 1 | 52 | 128520 | 2177.13 | 224 | 218 | 58.9 |
| D | 8 | 195 | 36911 | 622.64 | 224 | 218 | 58.9 |
| D | 13 | 104 | 32178 | 542.32 | 224 | 218 | 58.9 |
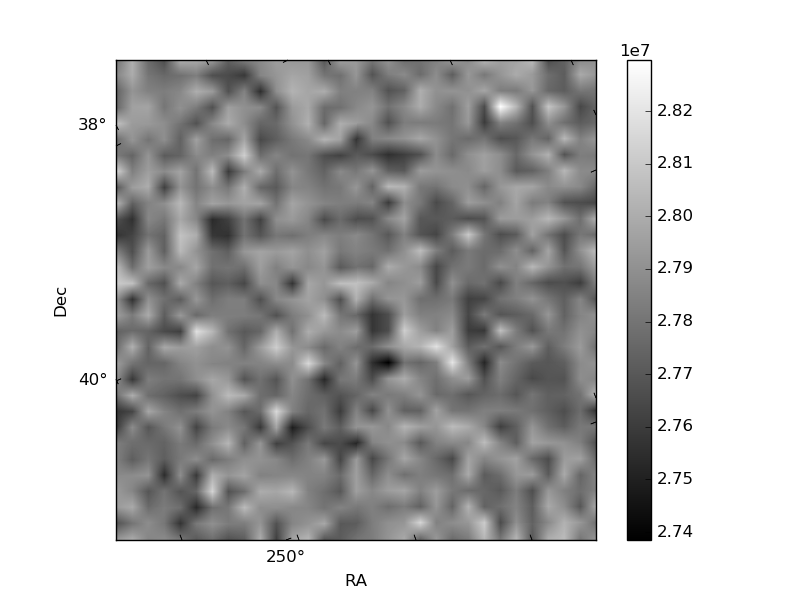
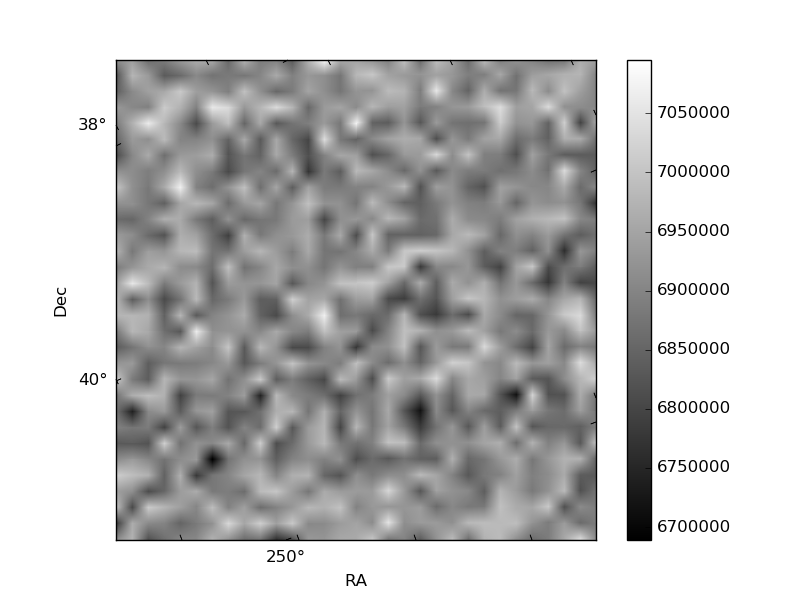
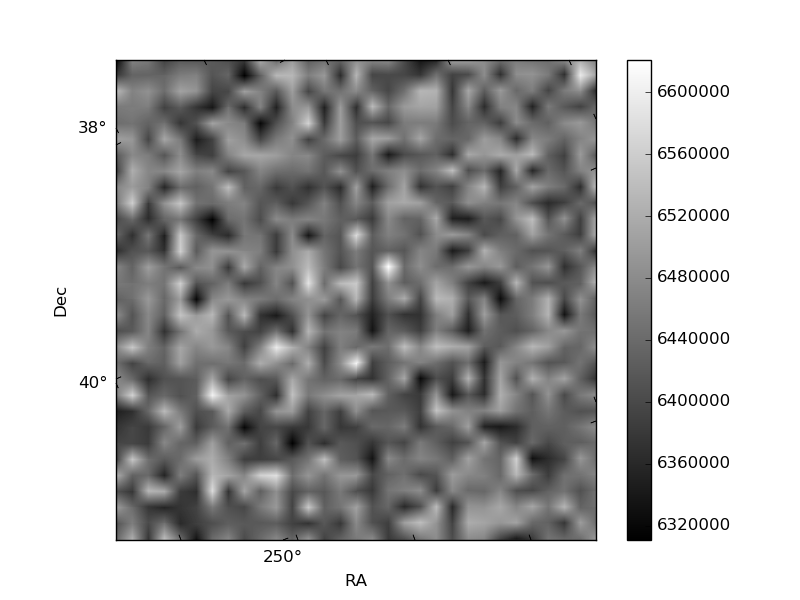
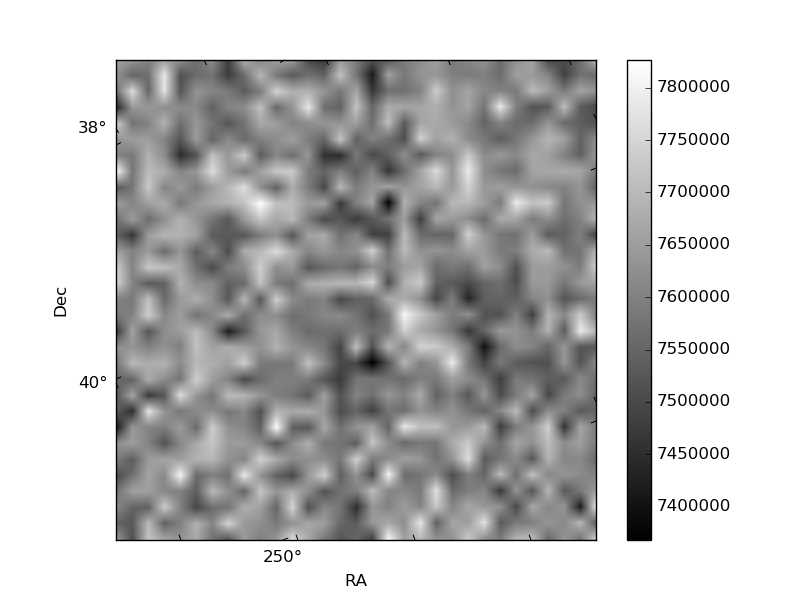
Histogram calculated using DETX and DETY for each event in the final _common_clean file
| Quadrant A | 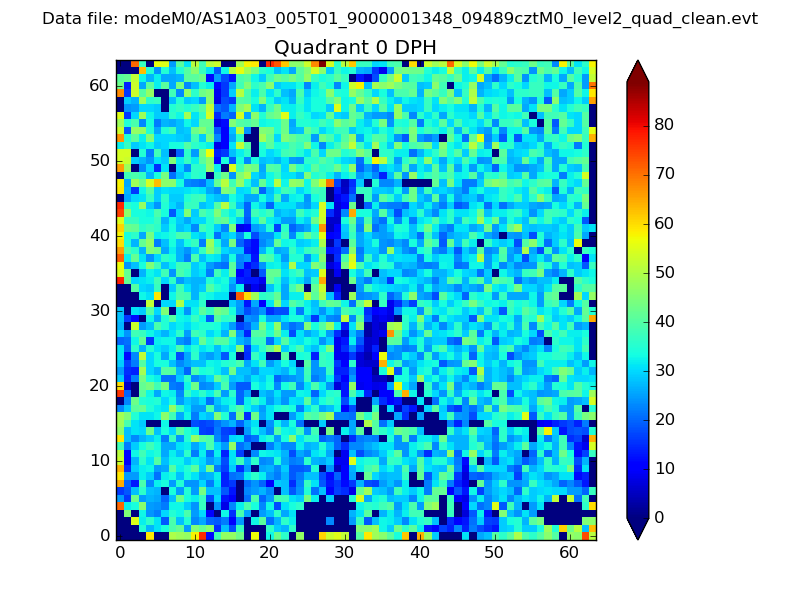 |
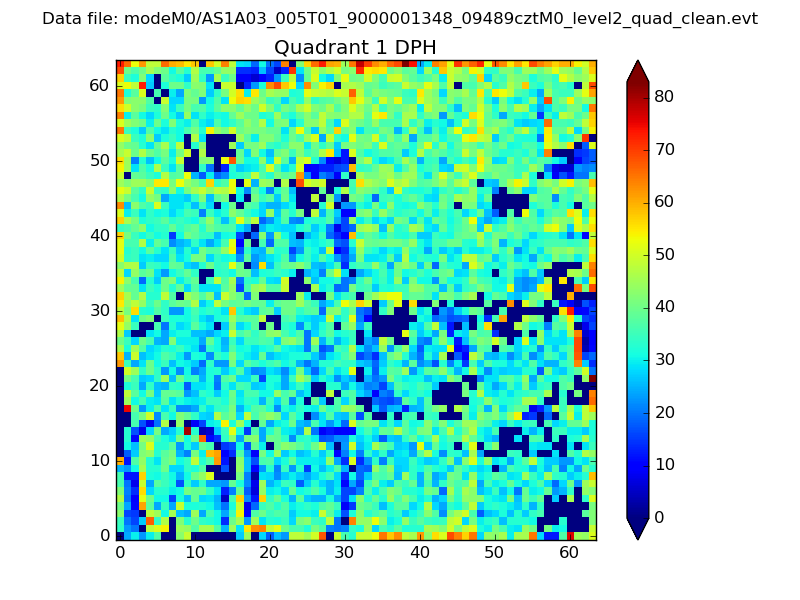 |
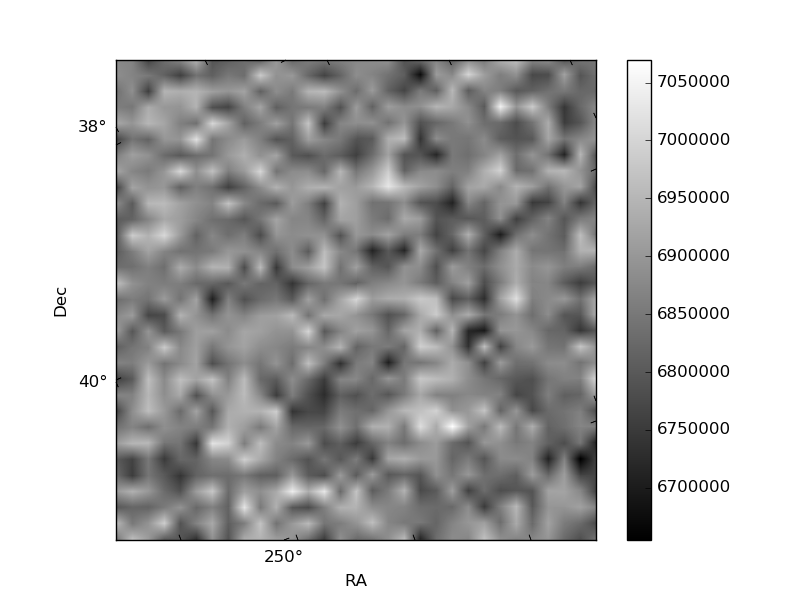
Quadrant B |
|---|---|---|---|
| Quadrant D | 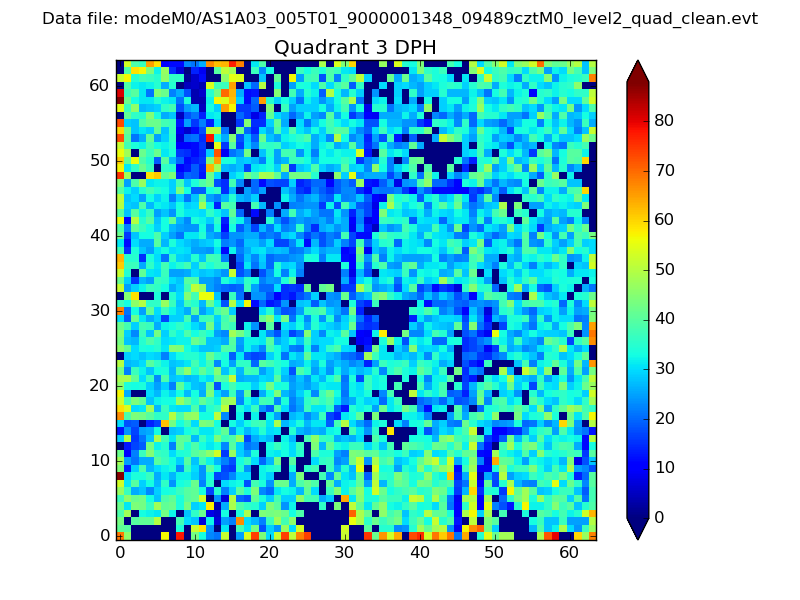 |
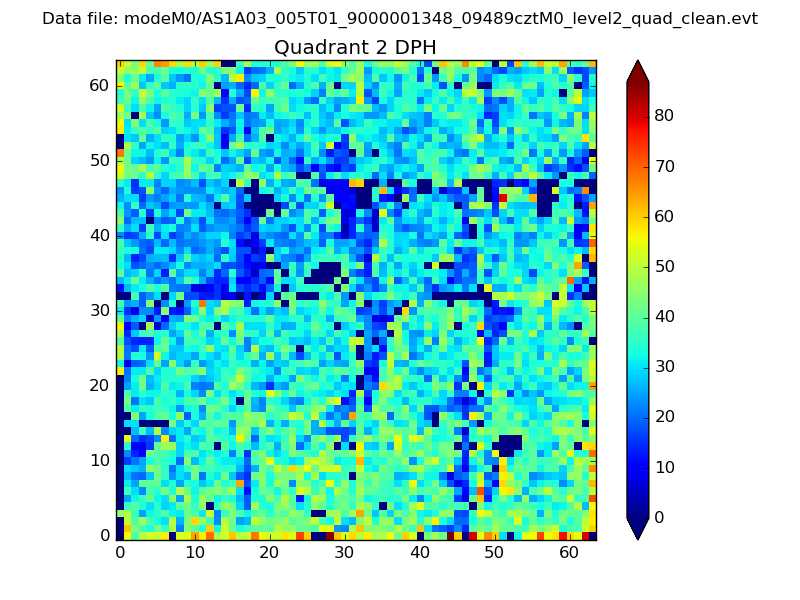 |
Quadrant C |
| Plot type | Count rate plots | Images |
|---|---|---|
| Comparison with Poisson distribution Blue bars denote a histogram of data divided into 1 sec bins. Red curve is a Poisson curve with rate = median count rate of data. |
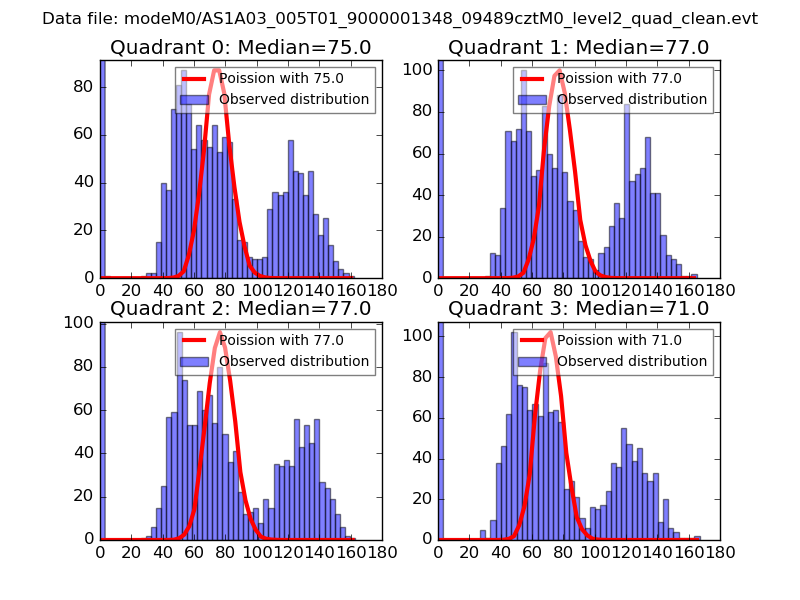 |
 |
| Quadrant-wise count rates Data is divided into 100 sec bins |
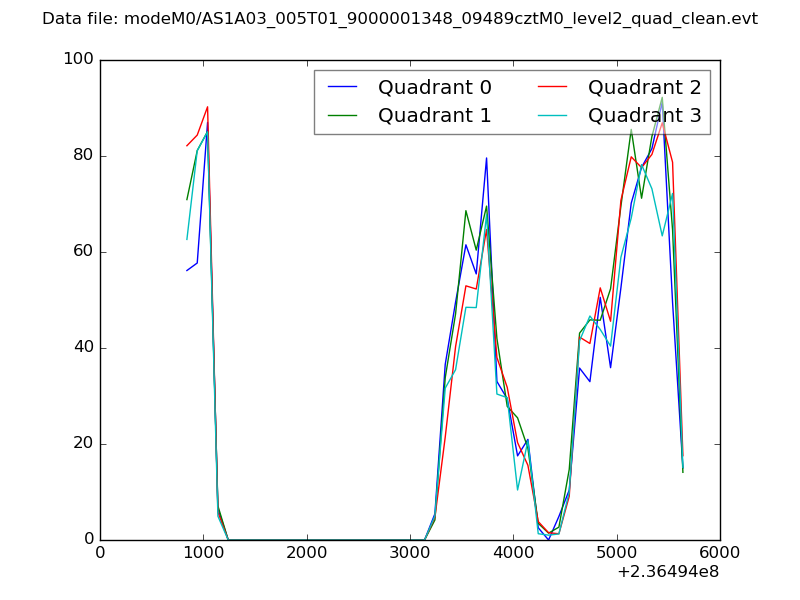 |
|
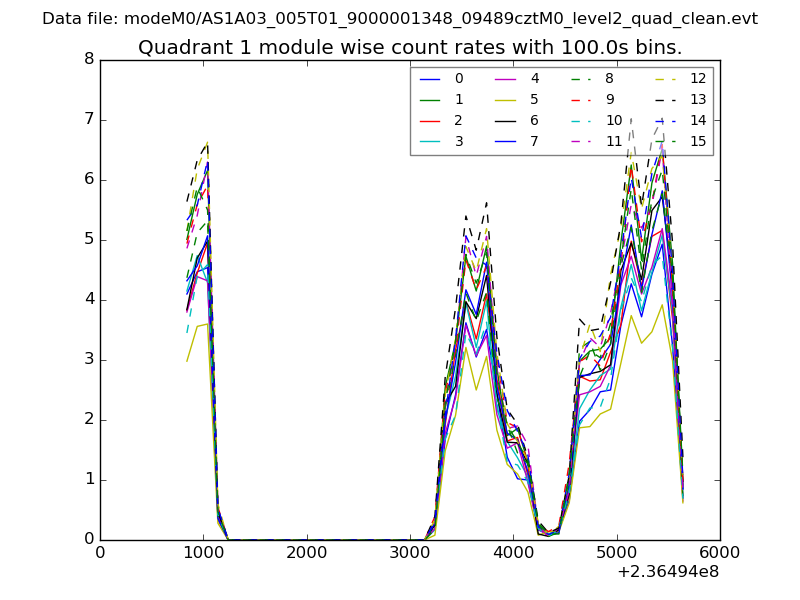
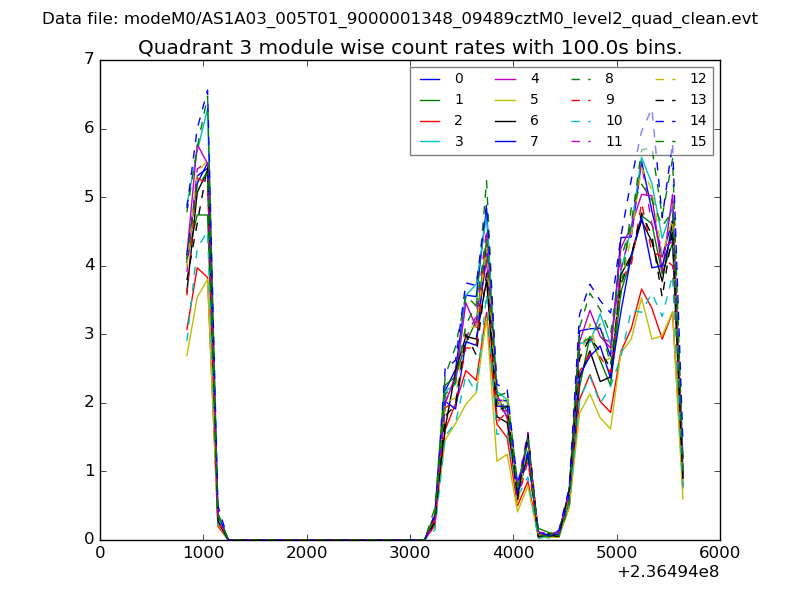
| Module-wise count rates for Quadrant A Data is divided into 100 sec bins |
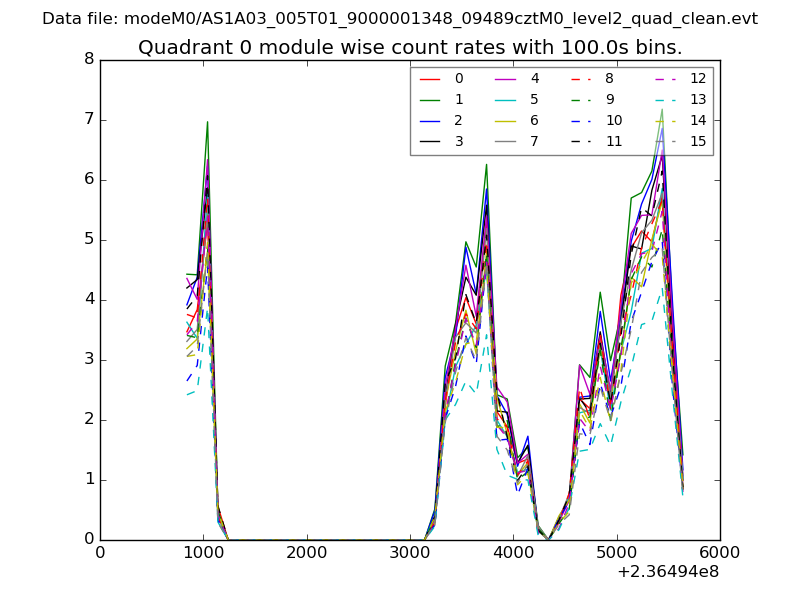 |
 |
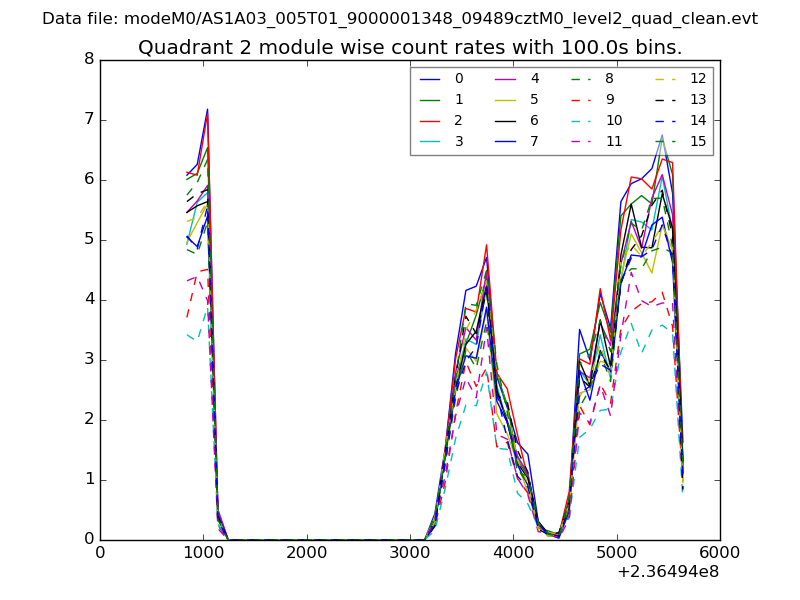
| Module-wise count rates for Quadrant B Data is divided into 100 sec bins |
 |
 |
| Module-wise count rates for Quadrant C Data is divided into 100 sec bins |
 |
 |
| Module-wise count rates for Quadrant D Data is divided into 100 sec bins |
 |
 |
| Parameter | Plot |
|---|---|
| CZT HV Monitor | 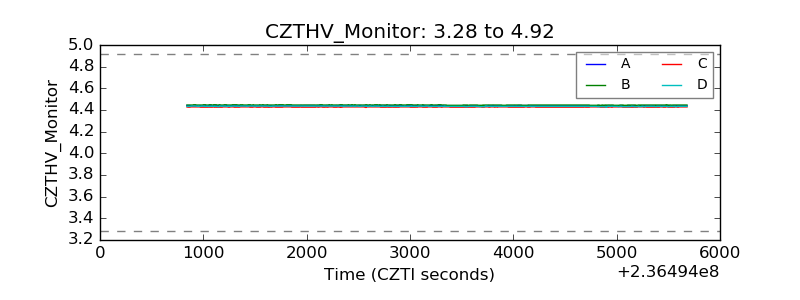 |
| D_VDD |  |
| Temperature 1 | 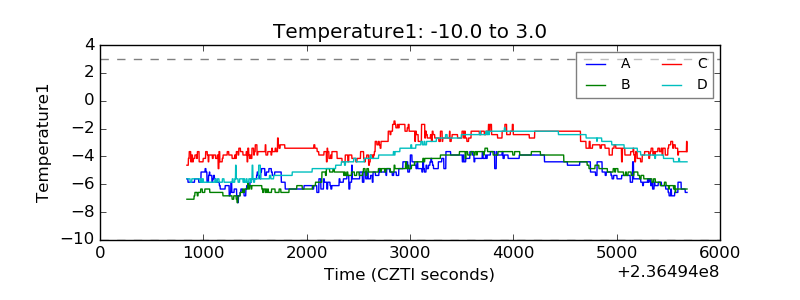 |
| Veto HV Monitor | 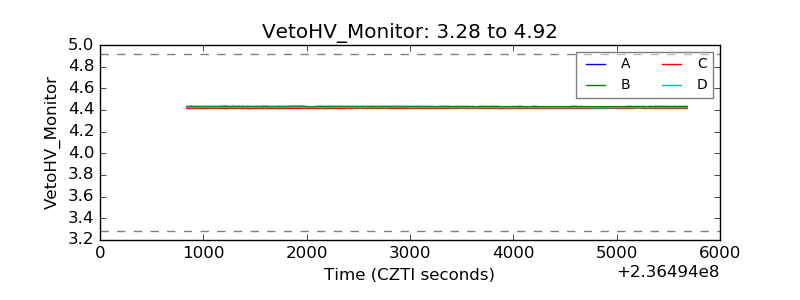 |
| Veto LLD | 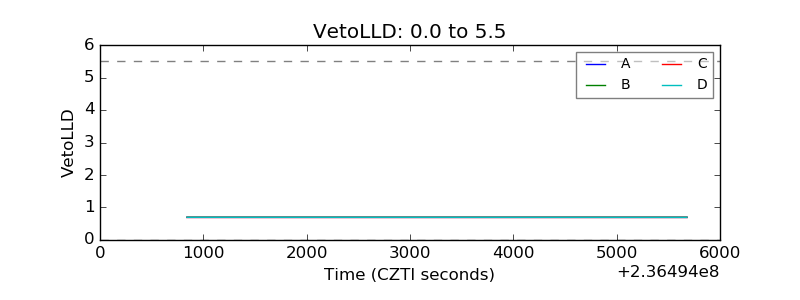 |
| Alpha Counter | 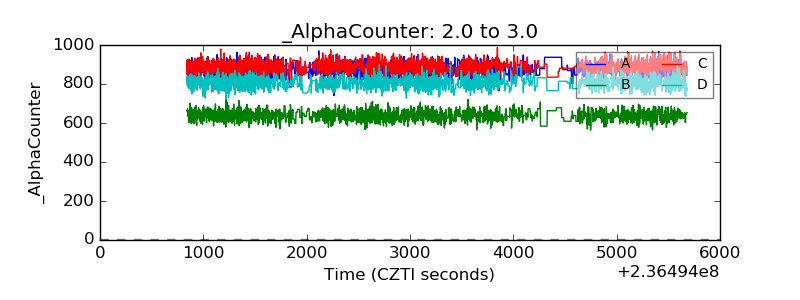 |
| _CPM_Rate | 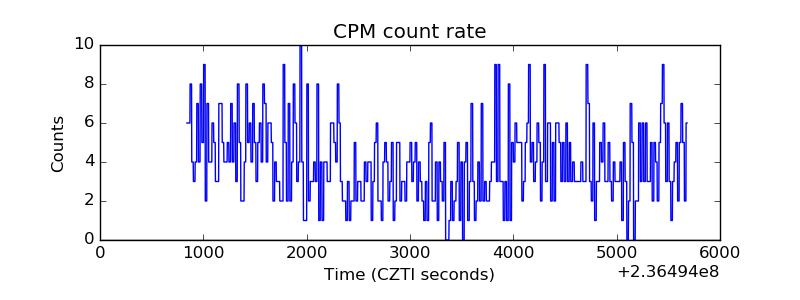 |
| CZT Counter | 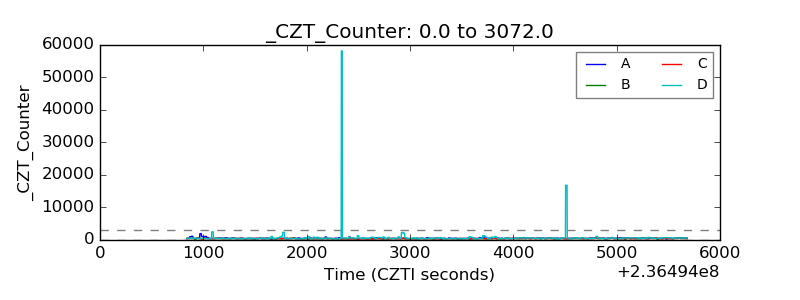 |
| +2.5 Volts monitor |  |
| +5 Volts monitor |  |
| _ROLL_ROT | 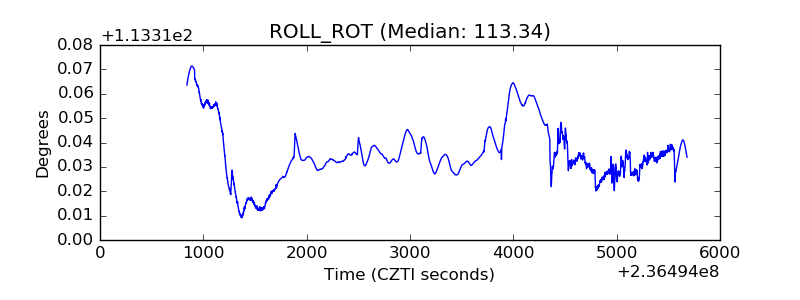 |
| _Roll_DEC | 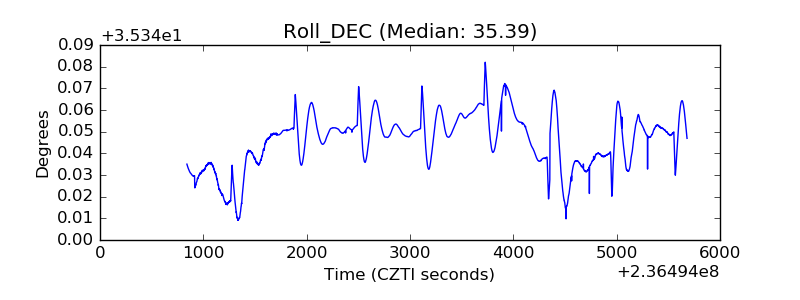 |
| _Roll_RA | 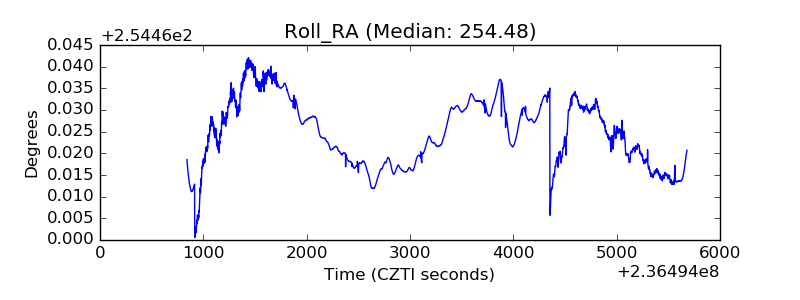 |
| Veto Counter | 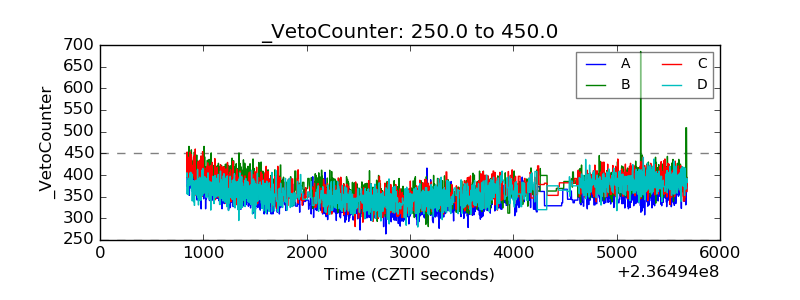 |