| Param | Original file | Final file |
|---|---|---|
| Filename | modeM0/AS1A03_005T01_9000001348_09490cztM0_level2.evt | modeM0/AS1A03_005T01_9000001348_09490cztM0_level2_quad_clean.evt |
| Size (bytes) | 1,529,654,400 | 247,049,280 |
| Size | 1.4 GB | 235.6 MB |
| Events in quadrant A | 11,995,601 | 1,517,326 |
| Events in quadrant B | 9,363,117 | 1,540,381 |
| Events in quadrant C | 10,874,182 | 1,527,446 |
| Events in quadrant D | 12,709,936 | 1,487,501 |
| Mode M0 | |||
|---|---|---|---|
| Quadrant | BADHDUFLAG | Total packets | Discarded packets |
| A | 0 | 51165 | 2194 |
| B | 0 | 43346 | 1499 |
| C | 0 | 48474 | 1985 |
| D | 0 | 54061 | 2252 |
| Mode SS | |||
|---|---|---|---|
| Quadrant | BADHDUFLAG | Total packets | Discarded packets |
| A | 0 | 432 | 12 |
| B | 0 | 432 | 12 |
| C | 0 | 432 | 16 |
| D | 0 | 432 | 18 |
| Mode M9 | |||
|---|---|---|---|
| Quadrant | BADHDUFLAG | Total packets | Discarded packets |
| A | 0 | 15 | 0 |
| B | 0 | 15 | 0 |
| C | 0 | 15 | 0 |
| D | 0 | 15 | 0 |
| Quadrant | Total seconds | Saturated seconds | Saturation percentage |
|---|---|---|---|
| A | 20417 | 208 | 1.018759% |
| B | 20517 | 150 | 0.731101% |
| C | 20457 | 487 | 2.380603% |
| D | 20416 | 354 | 1.733934% |
Noise dominated data is calculated using 1-second bins in cleaned event files. If a bin has >2000 counts, and if more than 50% of those come from <1% of pixels, then it is considered to be noise-dominated and hence unusable.
| Quadrant | # 1 sec bins | Bins with >0 counts | Bins with >2000 counts | High rate bins dominated by noise | Noise dominated (total time) | Noise dominated (detector-on time) | Marked lightcurve |
|---|---|---|---|---|---|---|---|
| A | 22814 | 21071 | 9 | 9 | 0.04% | 0.04% | 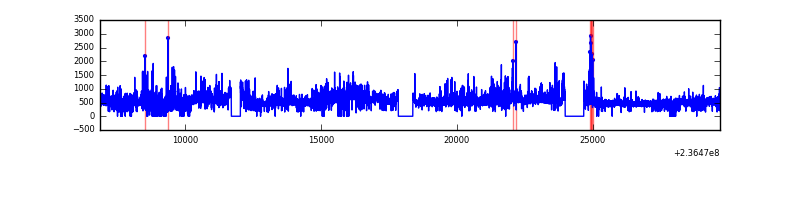 |
| B | 22815 | 21140 | 0 | 0 | 0.00% | 0.00% |  |
| C | 22815 | 21105 | 251 | 251 | 1.10% | 1.19% | 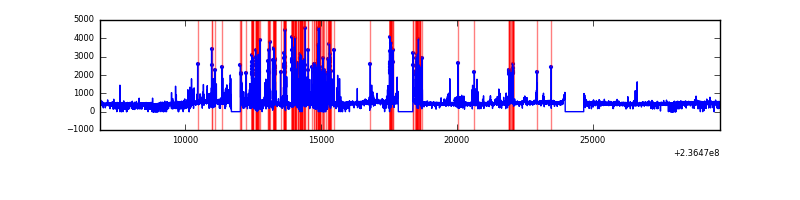 |
| D | 22815 | 21103 | 207 | 207 | 0.91% | 0.98% | 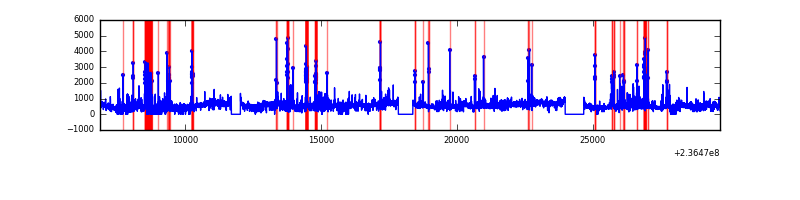 |
Top three noisy pixels from each quadrant. If the there are fewer than three noisy pixels in the level2.evt file, extra rows are filled as -1
| Pixel properties | Quadrant properties | ||||||
|---|---|---|---|---|---|---|---|
| Quadrant | DetID | PixID | Counts | Sigma | Mean | Median | Sigma |
| A | 8 | 5 | 2243828 | 4661.33 | 2364 | 2314 | 480.9 |
| A | 1 | 162 | 334974 | 691.78 | 2364 | 2314 | 480.9 |
| A | 1 | 178 | 123586 | 252.19 | 2364 | 2314 | 480.9 |
| B | 4 | 173 | 124721 | 270.54 | 2379 | 2321 | 452.4 |
| B | 12 | 111 | 53032 | 112.08 | 2379 | 2321 | 452.4 |
| B | 11 | 111 | 43320 | 90.62 | 2379 | 2321 | 452.4 |
| C | 4 | 254 | 1734355 | 3266.51 | 2296 | 2313 | 530.2 |
| C | 9 | 68 | 178282 | 331.86 | 2296 | 2313 | 530.2 |
| C | 13 | 61 | 16844 | 27.4 | 2296 | 2313 | 530.2 |
| D | 8 | 195 | 1837555 | 3205.86 | 2285 | 2231 | 572.5 |
| D | 1 | 52 | 811338 | 1413.31 | 2285 | 2231 | 572.5 |
| D | 2 | 136 | 508242 | 883.88 | 2285 | 2231 | 572.5 |
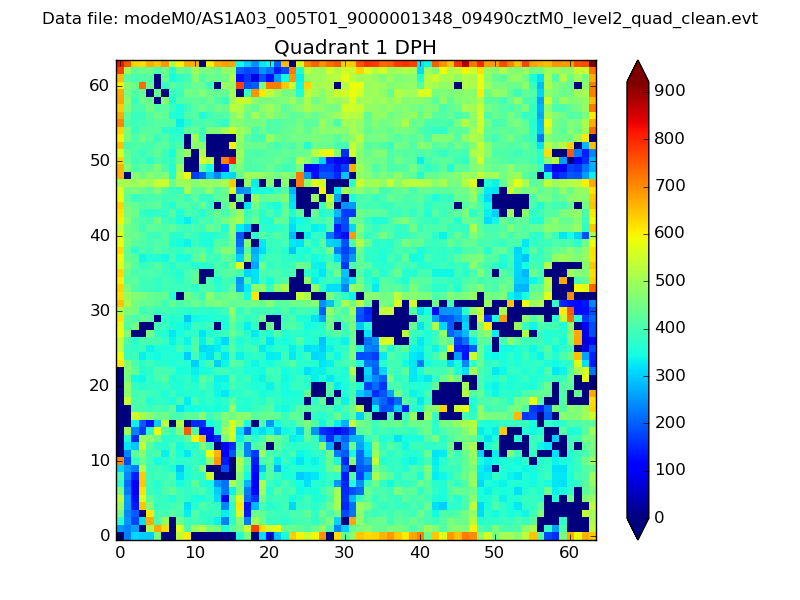
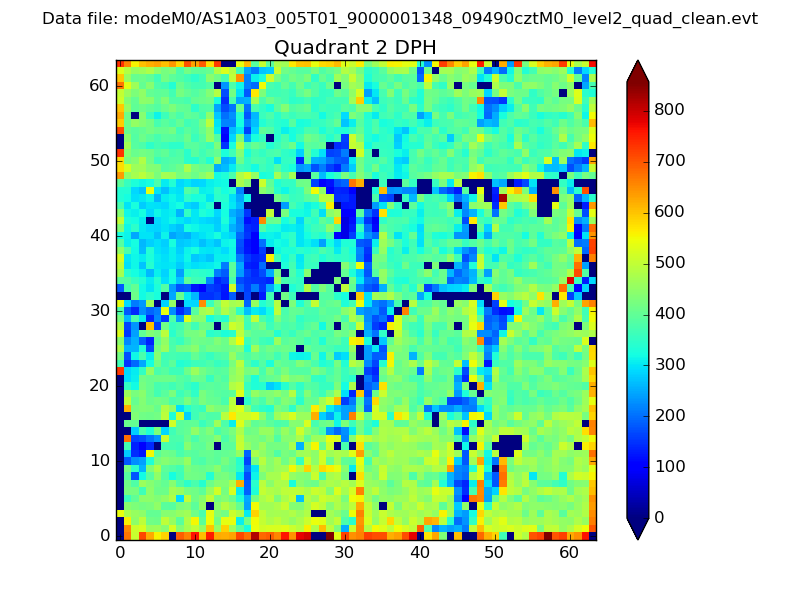
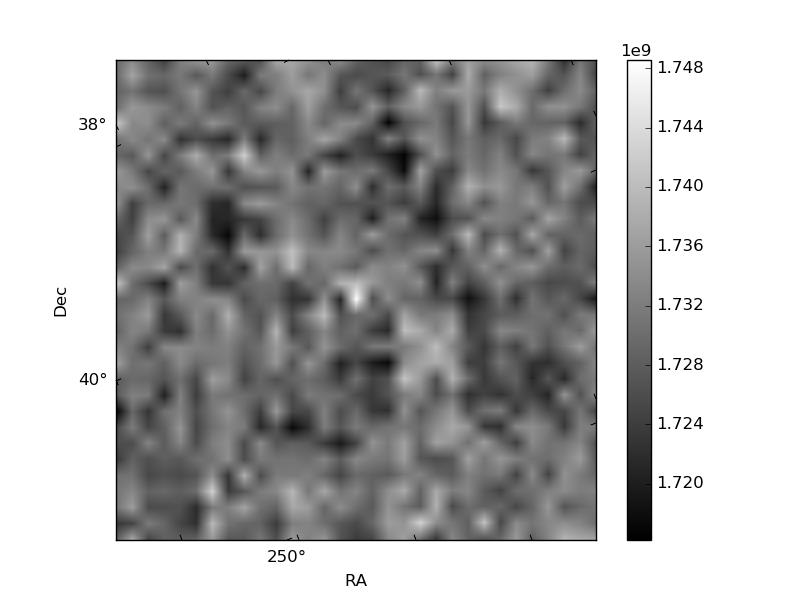
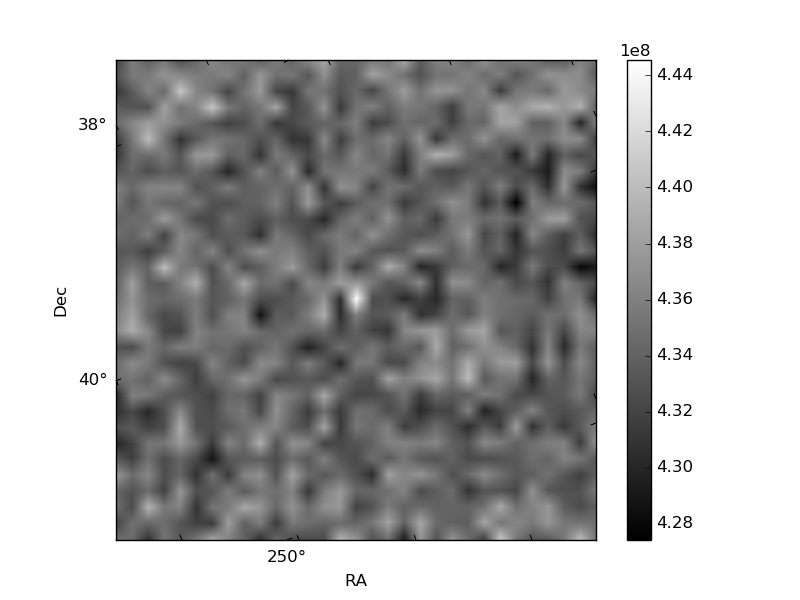
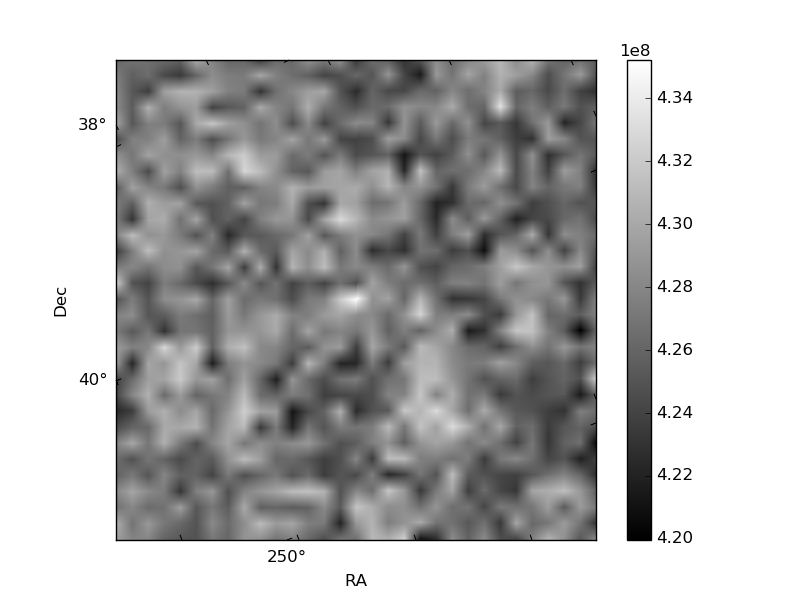
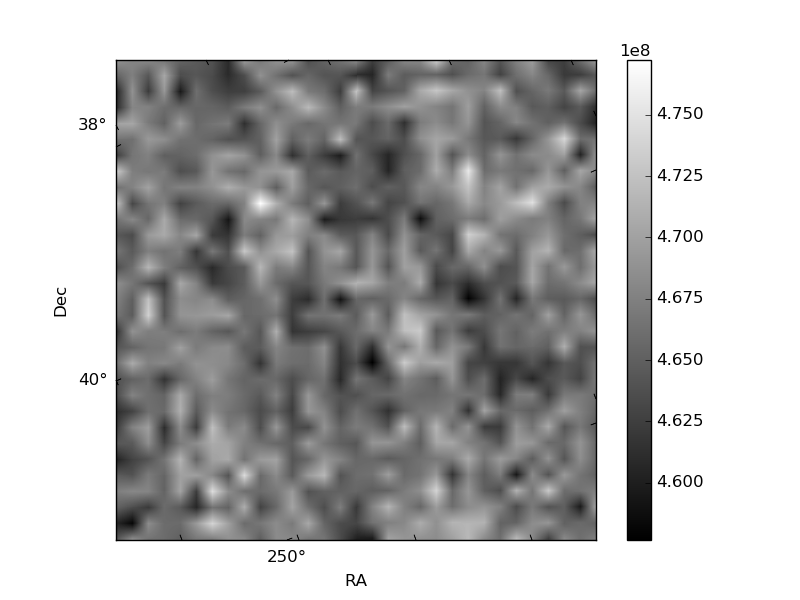
Histogram calculated using DETX and DETY for each event in the final _common_clean file
| Quadrant A | 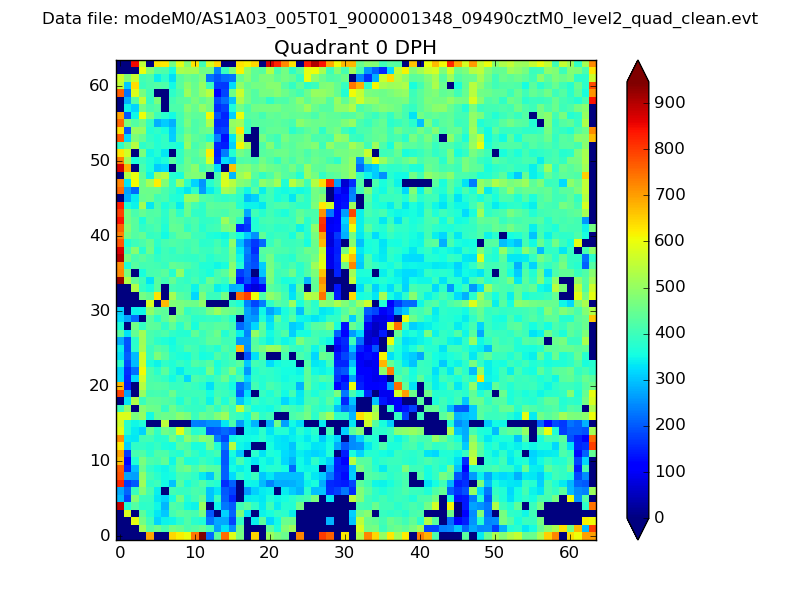 |
 |
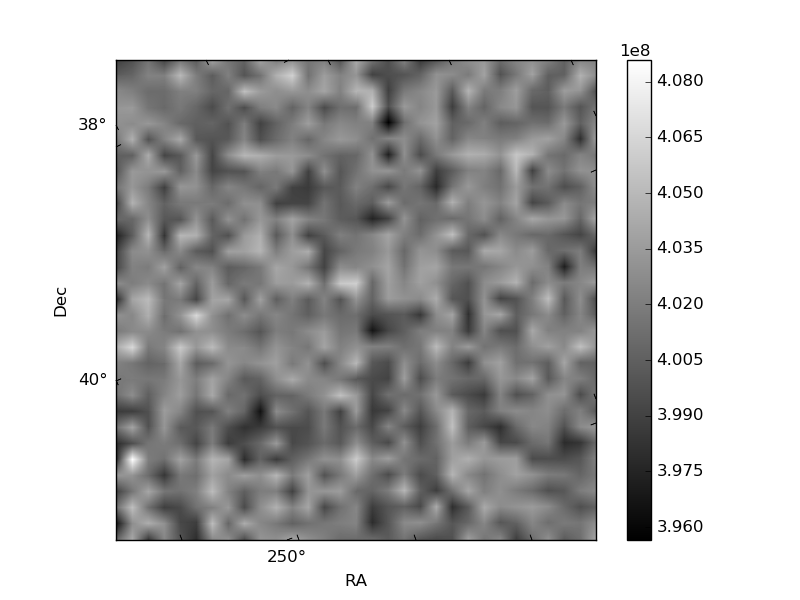
Quadrant B |
|---|---|---|---|
| Quadrant D | 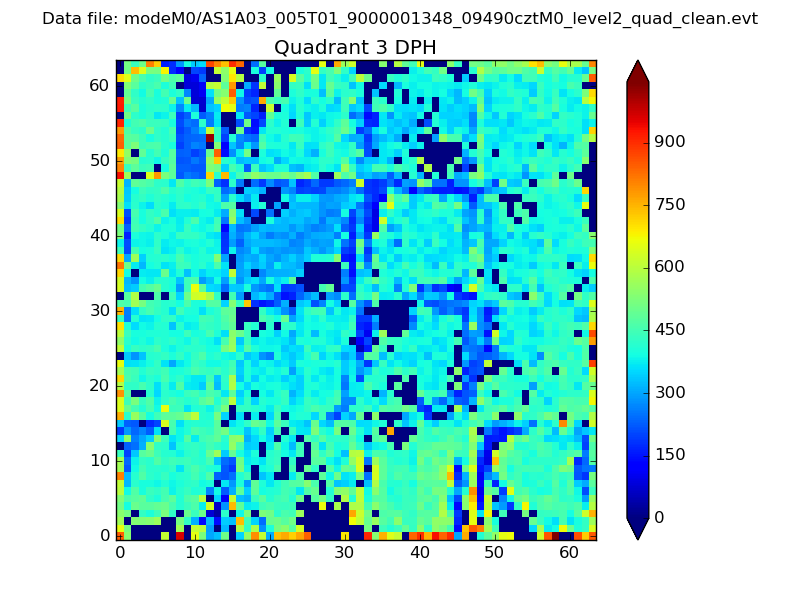 |
 |
Quadrant C |
| Plot type | Count rate plots | Images |
|---|---|---|
| Comparison with Poisson distribution Blue bars denote a histogram of data divided into 1 sec bins. Red curve is a Poisson curve with rate = median count rate of data. |
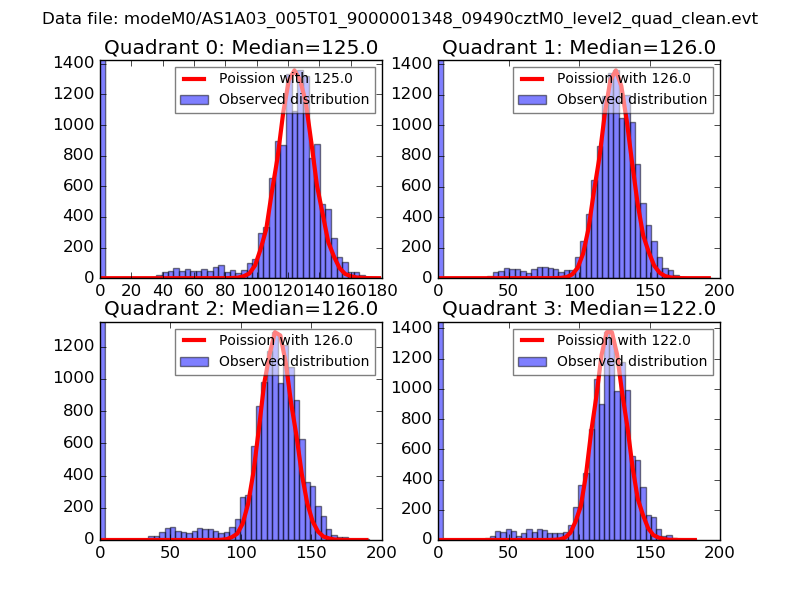 |
 |
| Quadrant-wise count rates Data is divided into 100 sec bins |
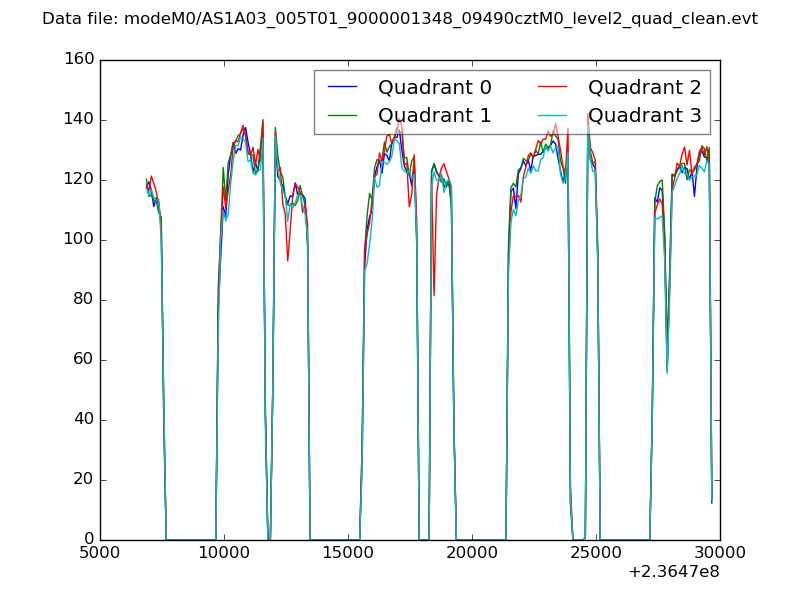 |
|
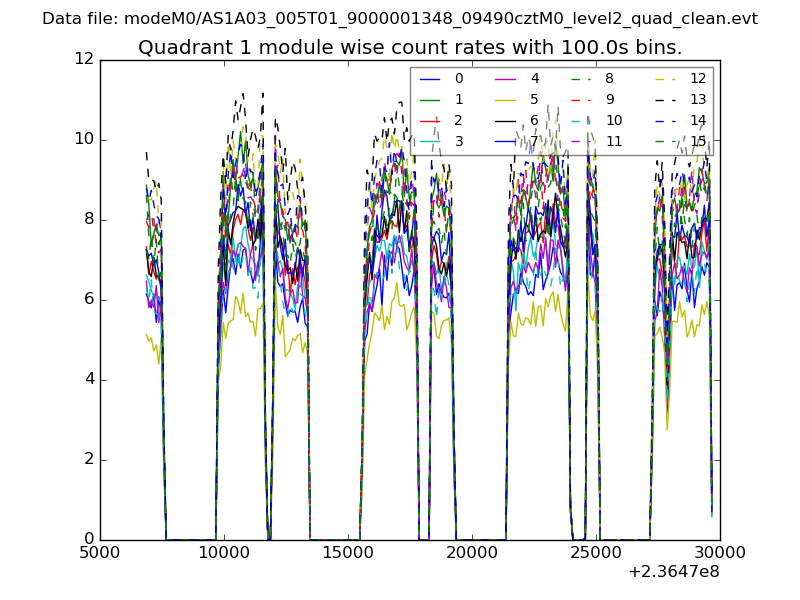
| Module-wise count rates for Quadrant A Data is divided into 100 sec bins |
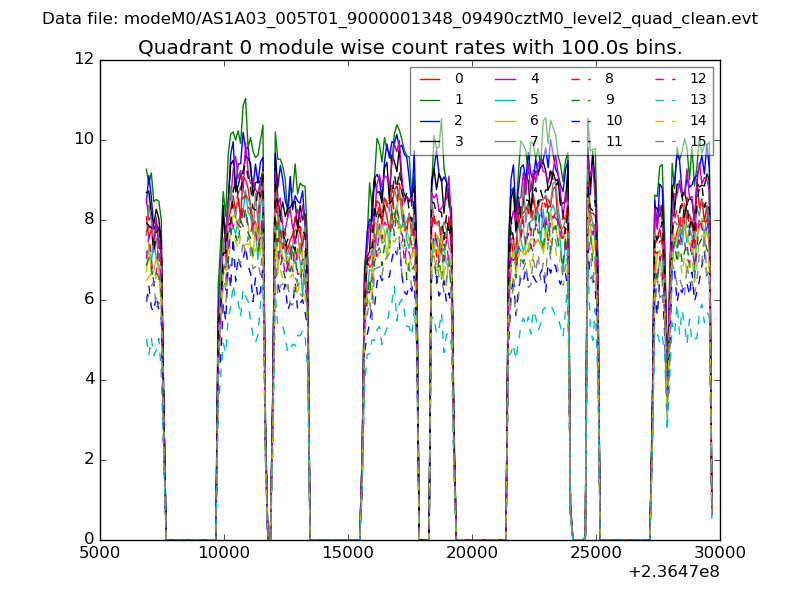 |
 |
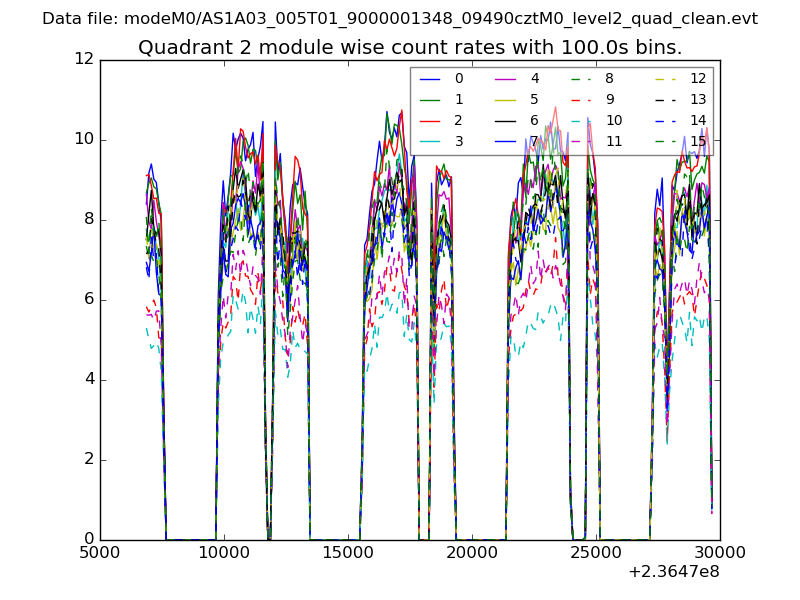
| Module-wise count rates for Quadrant B Data is divided into 100 sec bins |
 |
 |
| Module-wise count rates for Quadrant C Data is divided into 100 sec bins |
 |
 |
| Module-wise count rates for Quadrant D Data is divided into 100 sec bins |
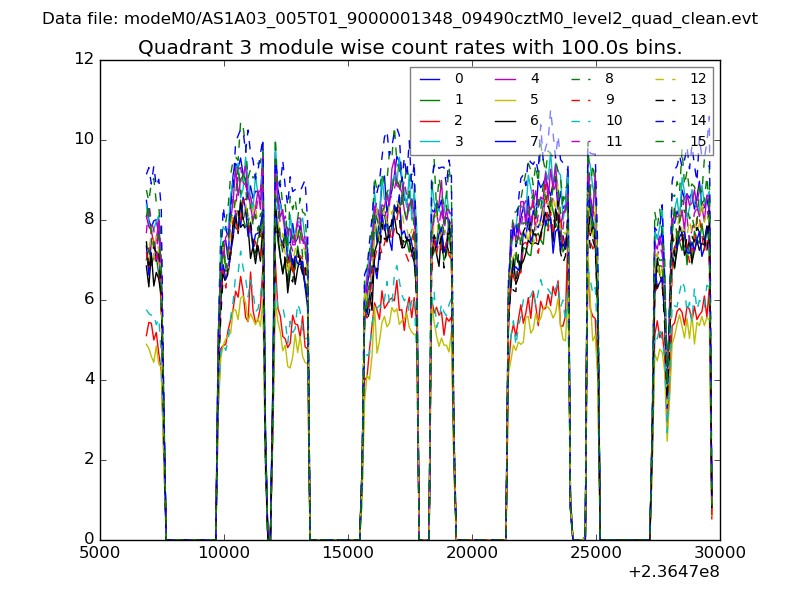 |
 |
| Parameter | Plot |
|---|---|
| CZT HV Monitor | 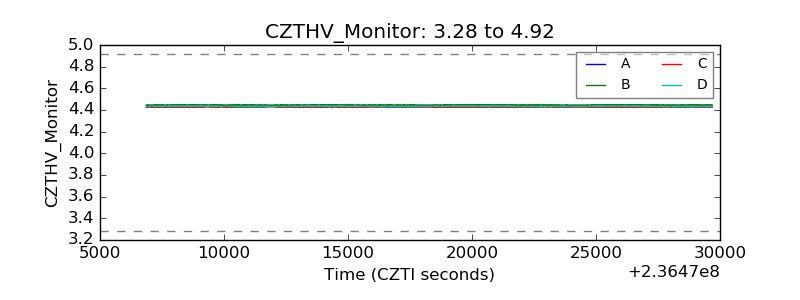 |
| D_VDD | 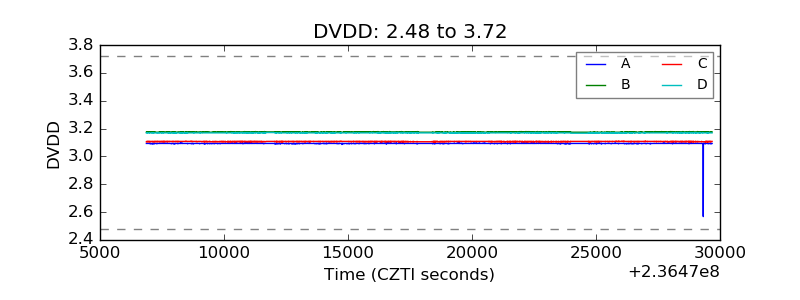 |
| Temperature 1 |  |
| Veto HV Monitor | 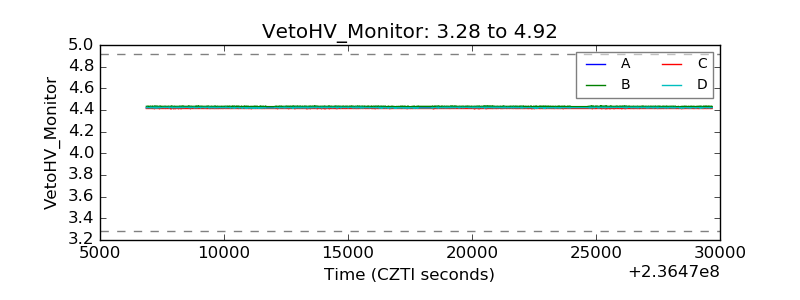 |
| Veto LLD |  |
| Alpha Counter | 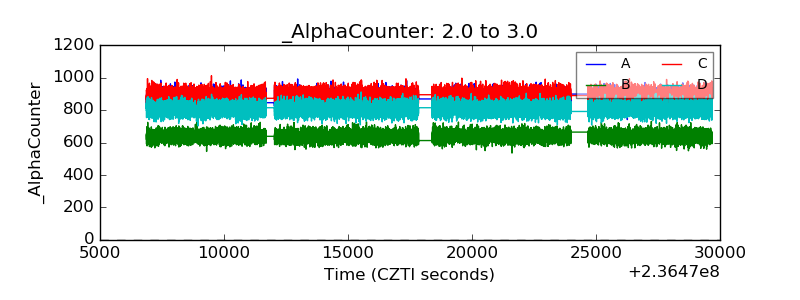 |
| _CPM_Rate | 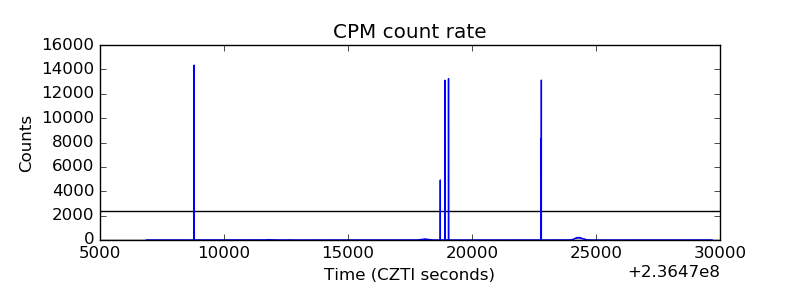 |
| CZT Counter | 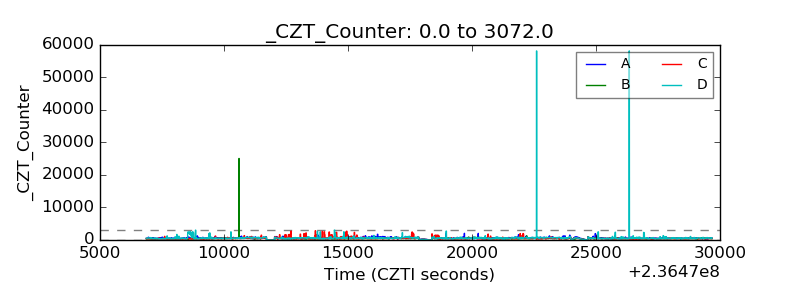 |
| +2.5 Volts monitor |  |
| +5 Volts monitor | 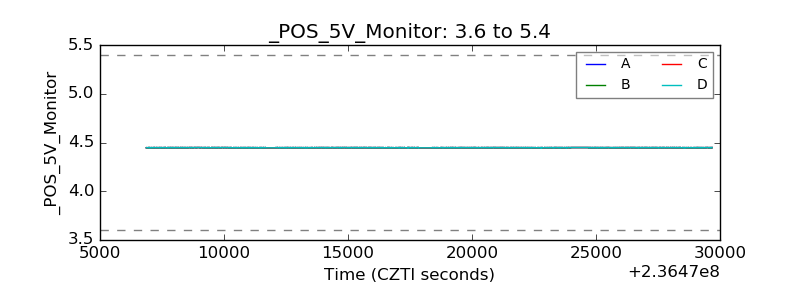 |
| _ROLL_ROT | 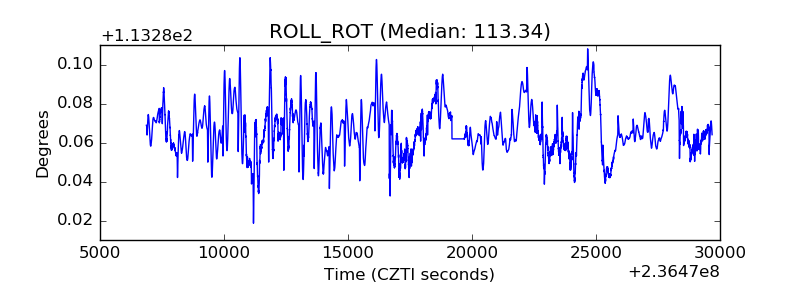 |
| _Roll_DEC | 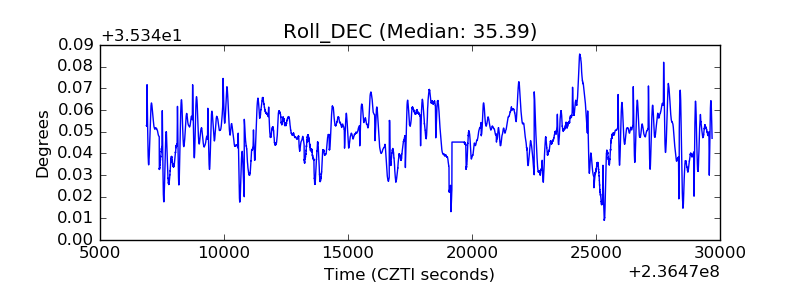 |
| _Roll_RA | 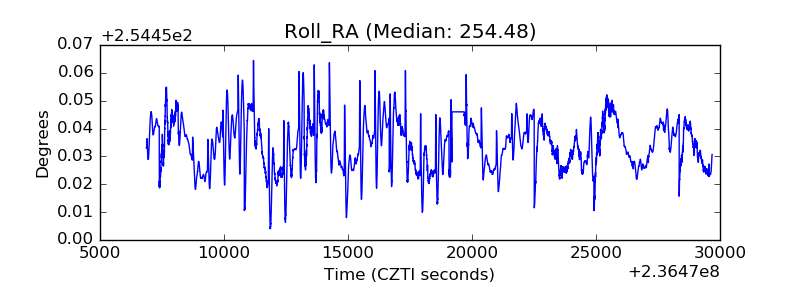 |
| Veto Counter | 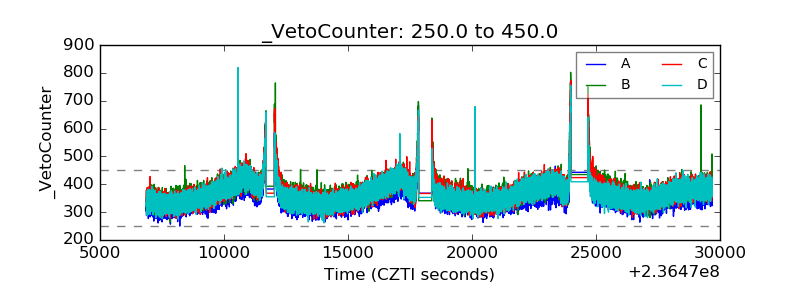 |