| Param | Original file | Final file |
|---|---|---|
| Filename | modeM0/AS1A03_005T01_9000001348_09492cztM0_level2.evt | modeM0/AS1A03_005T01_9000001348_09492cztM0_level2_quad_clean.evt |
| Size (bytes) | 1,593,077,760 | 254,995,200 |
| Size | 1.5 GB | 243.2 MB |
| Events in quadrant A | 12,528,140 | 1,566,550 |
| Events in quadrant B | 9,689,921 | 1,588,494 |
| Events in quadrant C | 11,334,351 | 1,571,827 |
| Events in quadrant D | 13,259,955 | 1,533,142 |
| Mode M0 | |||
|---|---|---|---|
| Quadrant | BADHDUFLAG | Total packets | Discarded packets |
| A | 0 | 51177 | 55 |
| B | 0 | 43357 | 27 |
| C | 0 | 48484 | 43 |
| D | 0 | 54070 | 51 |
| Mode SS | |||
|---|---|---|---|
| Quadrant | BADHDUFLAG | Total packets | Discarded packets |
| A | 0 | 432 | 0 |
| B | 0 | 432 | 0 |
| C | 0 | 432 | 0 |
| D | 0 | 432 | 0 |
| Mode M9 | |||
|---|---|---|---|
| Quadrant | BADHDUFLAG | Total packets | Discarded packets |
| A | 0 | 15 | 0 |
| B | 0 | 15 | 0 |
| C | 0 | 15 | 0 |
| D | 0 | 15 | 0 |
| Quadrant | Total seconds | Saturated seconds | Saturation percentage |
|---|---|---|---|
| A | 21242 | 215 | 1.012146% |
| B | 21248 | 151 | 0.710655% |
| C | 21248 | 525 | 2.470821% |
| D | 21243 | 385 | 1.812362% |
Noise dominated data is calculated using 1-second bins in cleaned event files. If a bin has >2000 counts, and if more than 50% of those come from <1% of pixels, then it is considered to be noise-dominated and hence unusable.
| Quadrant | # 1 sec bins | Bins with >0 counts | Bins with >2000 counts | High rate bins dominated by noise | Noise dominated (total time) | Noise dominated (detector-on time) | Marked lightcurve |
|---|---|---|---|---|---|---|---|
| A | 22815 | 21263 | 12 | 12 | 0.05% | 0.06% |  |
| B | 22815 | 21263 | 0 | 0 | 0.00% | 0.00% |  |
| C | 22815 | 21263 | 285 | 285 | 1.25% | 1.34% | 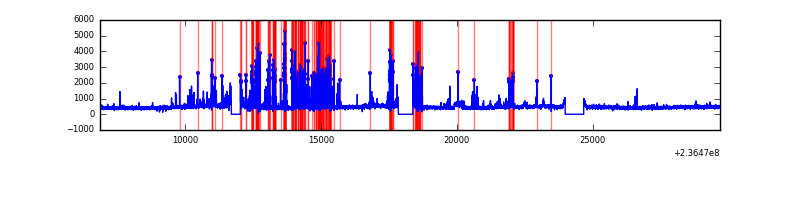 |
| D | 22815 | 21263 | 257 | 257 | 1.13% | 1.21% |  |
Top three noisy pixels from each quadrant. If the there are fewer than three noisy pixels in the level2.evt file, extra rows are filled as -1
| Pixel properties | Quadrant properties | ||||||
|---|---|---|---|---|---|---|---|
| Quadrant | DetID | PixID | Counts | Sigma | Mean | Median | Sigma |
| A | 8 | 5 | 2380763 | 4763.06 | 2457 | 2407 | 499.3 |
| A | 1 | 162 | 353927 | 703.98 | 2457 | 2407 | 499.3 |
| A | 1 | 178 | 130704 | 256.94 | 2457 | 2407 | 499.3 |
| B | 4 | 173 | 129044 | 270.69 | 2462 | 2402 | 467.8 |
| B | 12 | 111 | 54866 | 112.14 | 2462 | 2402 | 467.8 |
| B | 11 | 111 | 44810 | 90.64 | 2462 | 2402 | 467.8 |
| C | 4 | 254 | 1859977 | 3381.43 | 2381 | 2398 | 549.3 |
| C | 9 | 68 | 181830 | 326.63 | 2381 | 2398 | 549.3 |
| C | 13 | 61 | 17528 | 27.54 | 2381 | 2398 | 549.3 |
| D | 8 | 195 | 1897534 | 3184.96 | 2373 | 2315 | 595.1 |
| D | 1 | 52 | 834049 | 1397.75 | 2373 | 2315 | 595.1 |
| D | 2 | 136 | 603005 | 1009.47 | 2373 | 2315 | 595.1 |
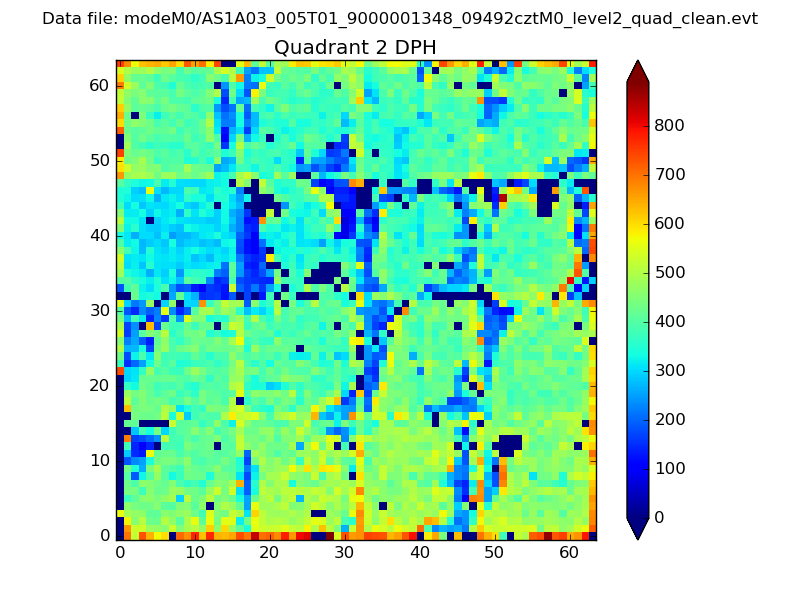
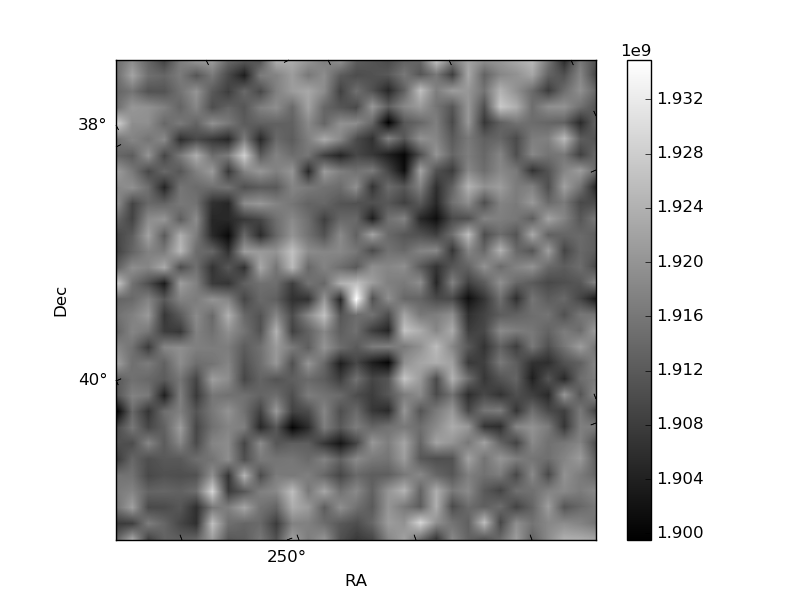
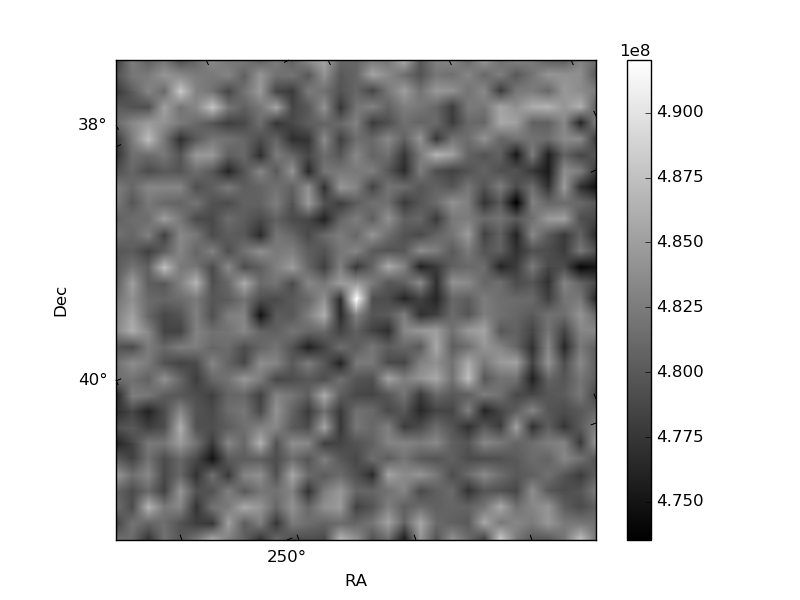
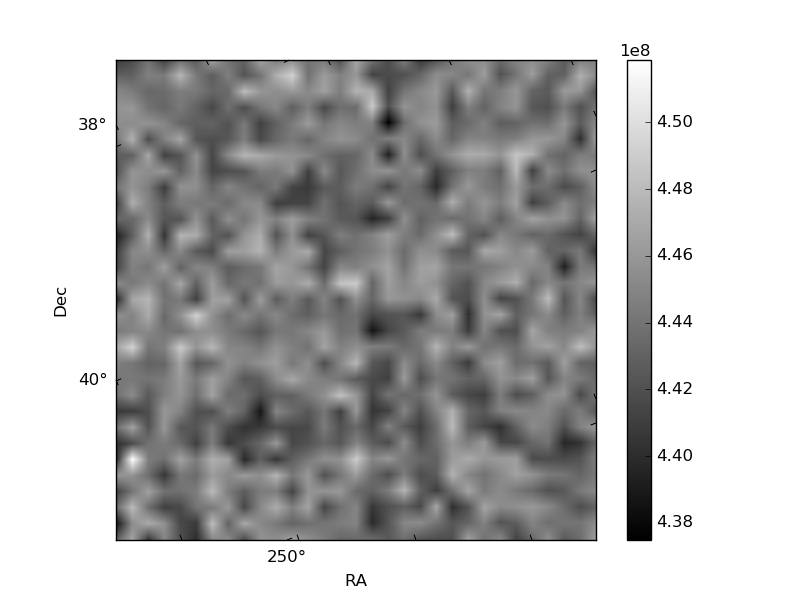
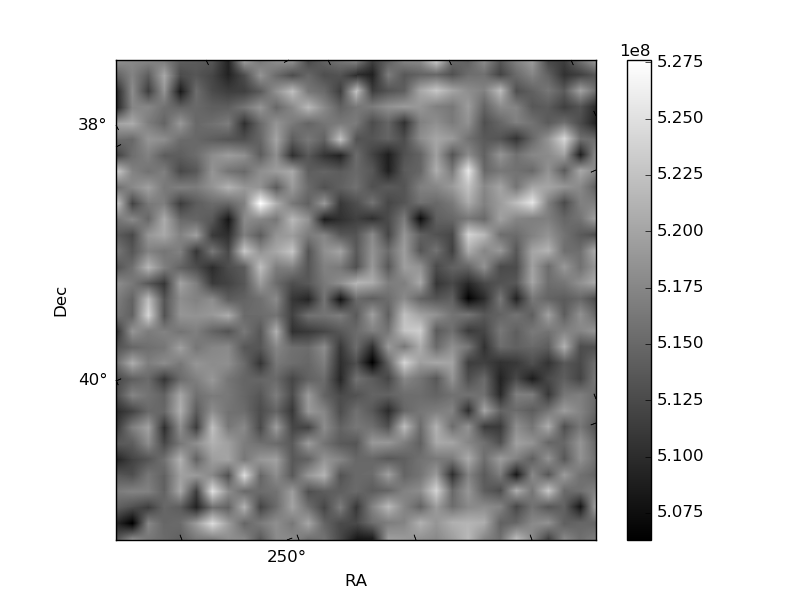
Histogram calculated using DETX and DETY for each event in the final _common_clean file
| Quadrant A | 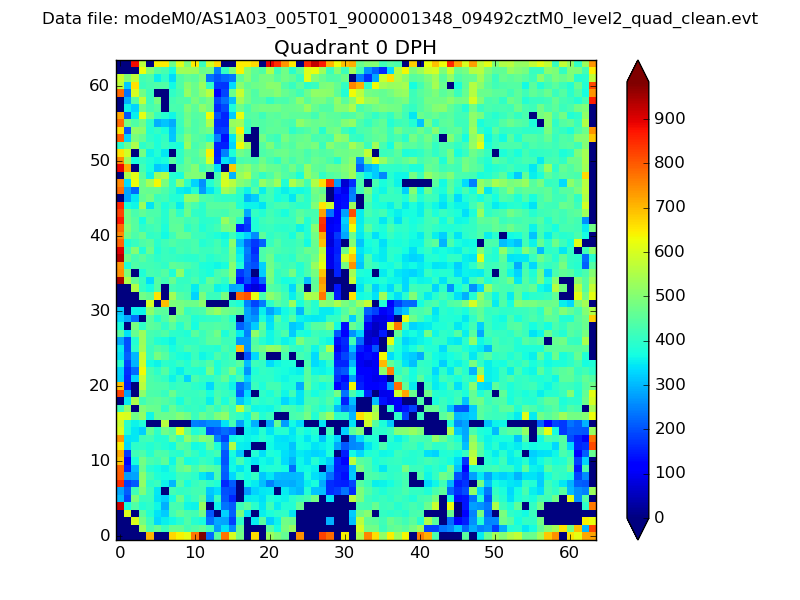 |
 |
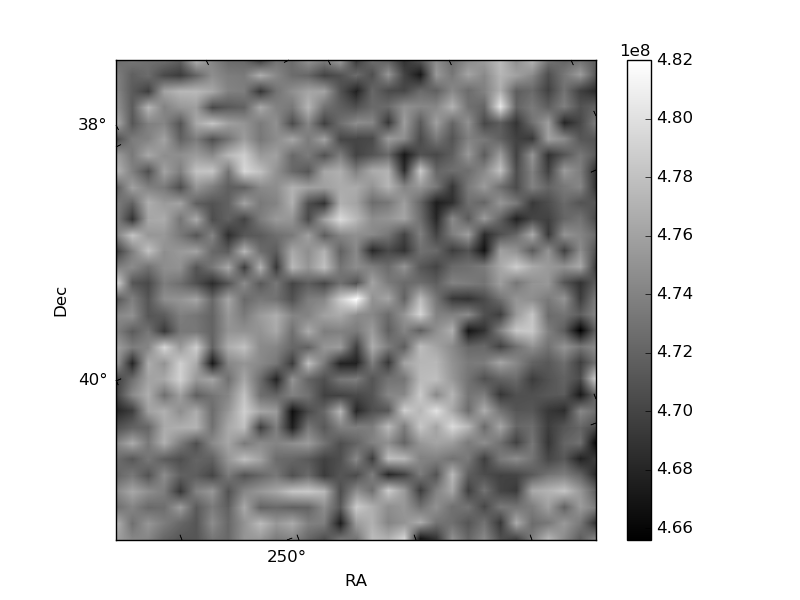
Quadrant B |
|---|---|---|---|
| Quadrant D | 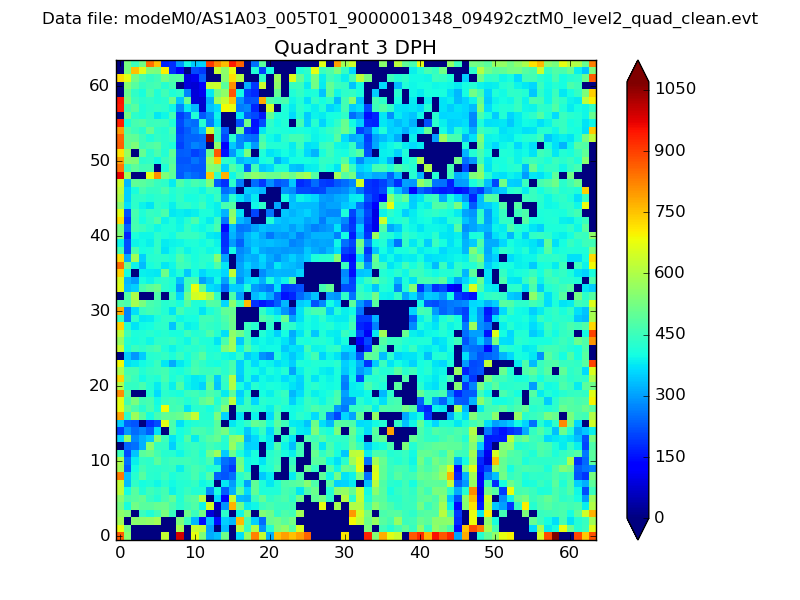 |
 |
Quadrant C |
| Plot type | Count rate plots | Images |
|---|---|---|
| Comparison with Poisson distribution Blue bars denote a histogram of data divided into 1 sec bins. Red curve is a Poisson curve with rate = median count rate of data. |
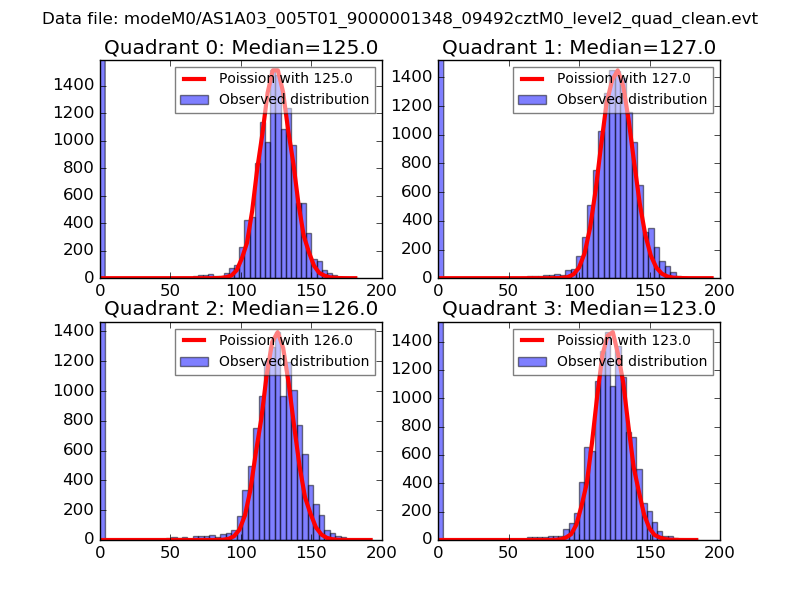 |
 |
| Quadrant-wise count rates Data is divided into 100 sec bins |
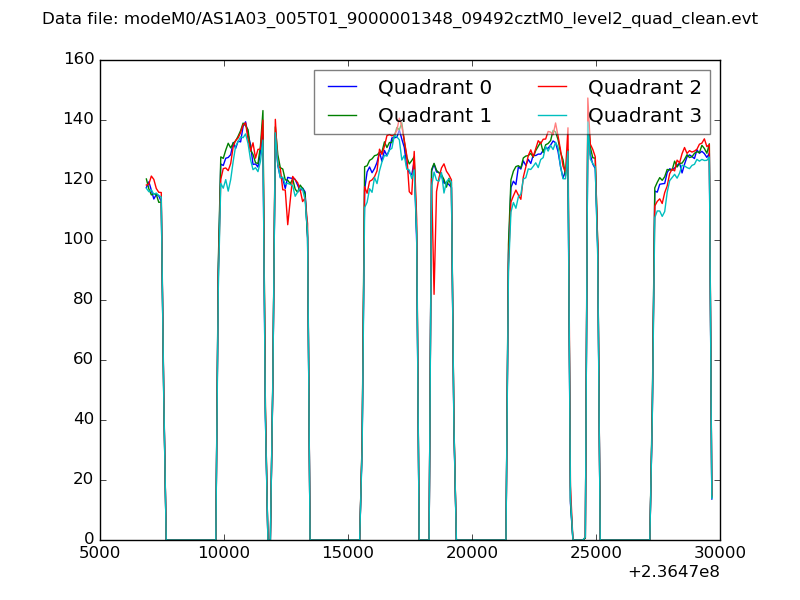 |
|
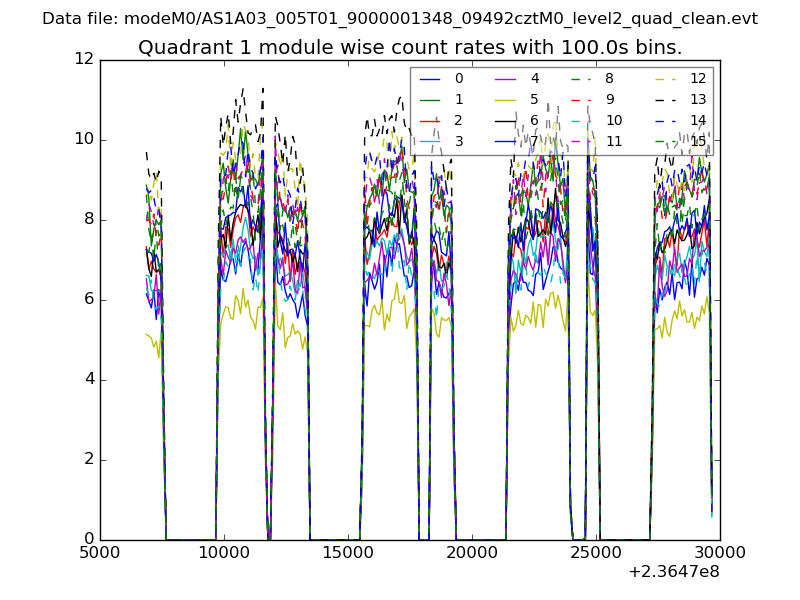
| Module-wise count rates for Quadrant A Data is divided into 100 sec bins |
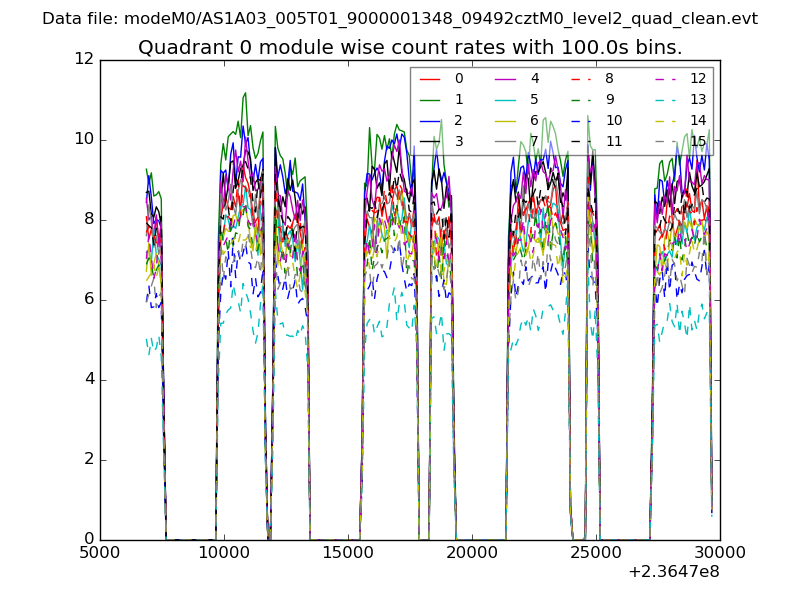 |
 |
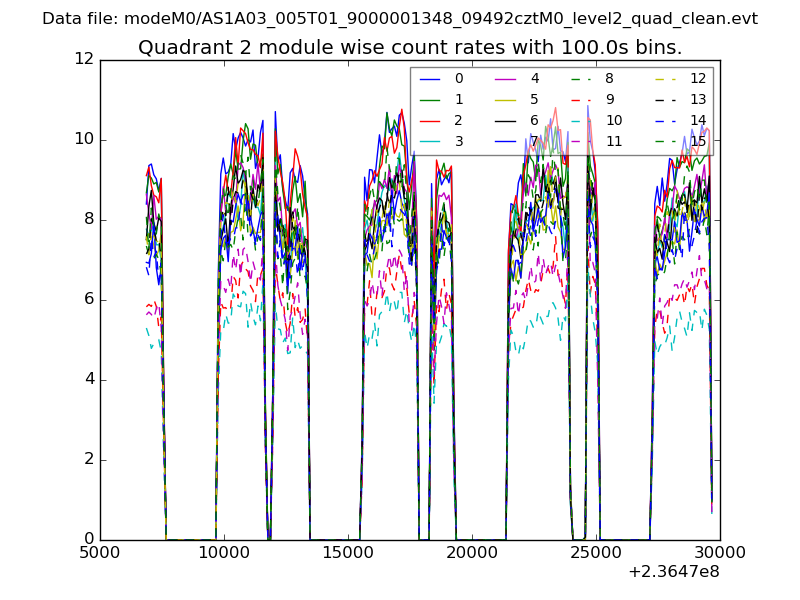
| Module-wise count rates for Quadrant B Data is divided into 100 sec bins |
 |
 |
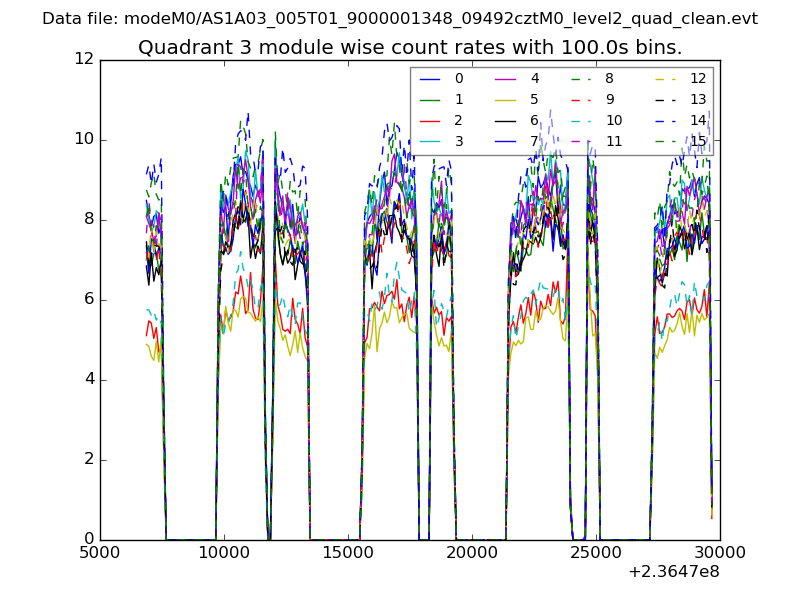
| Module-wise count rates for Quadrant C Data is divided into 100 sec bins |
 |
 |
| Module-wise count rates for Quadrant D Data is divided into 100 sec bins |
 |
 |
| Parameter | Plot |
|---|---|
| CZT HV Monitor | 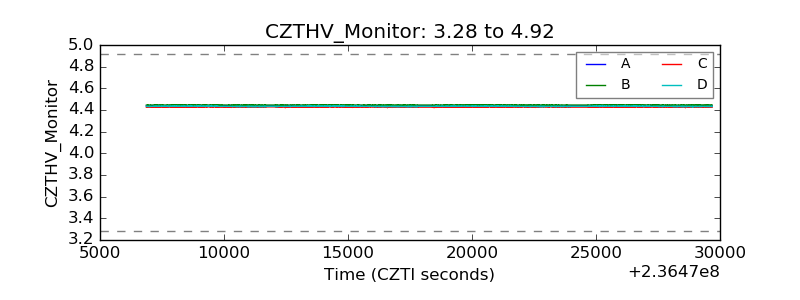 |
| D_VDD | 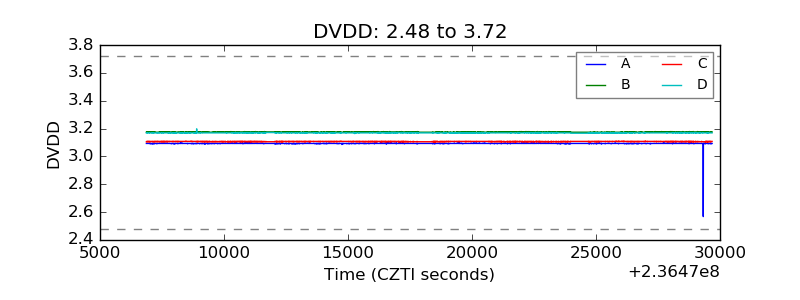 |
| Temperature 1 | 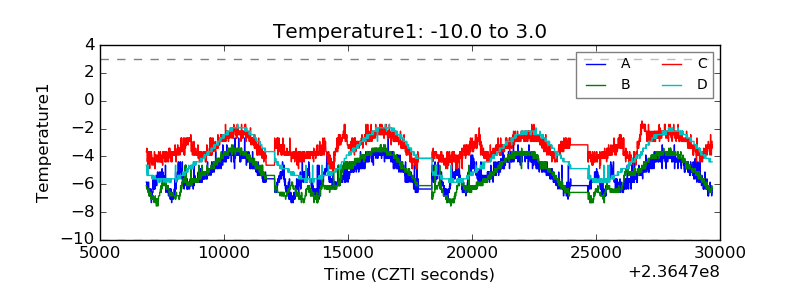 |
| Veto HV Monitor | 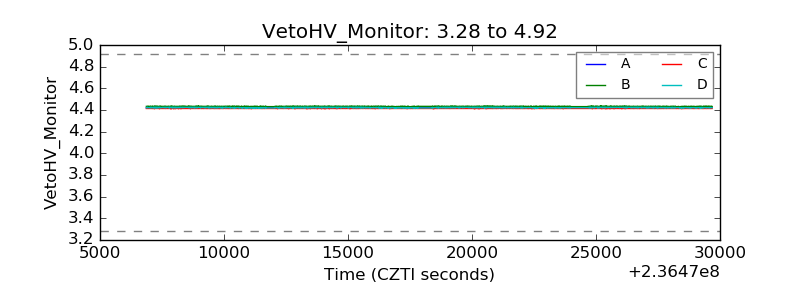 |
| Veto LLD |  |
| Alpha Counter | 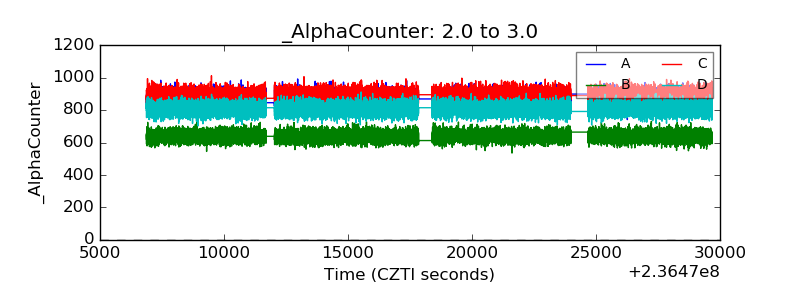 |
| _CPM_Rate | 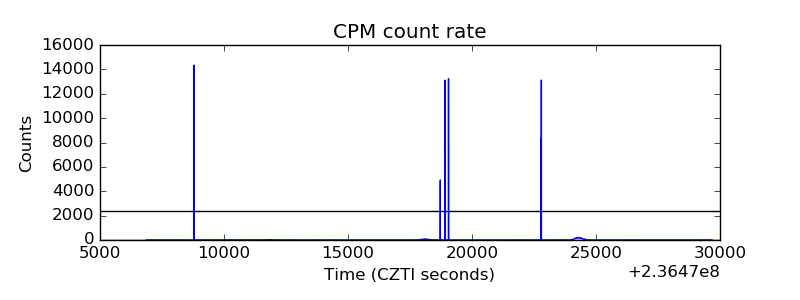 |
| CZT Counter | 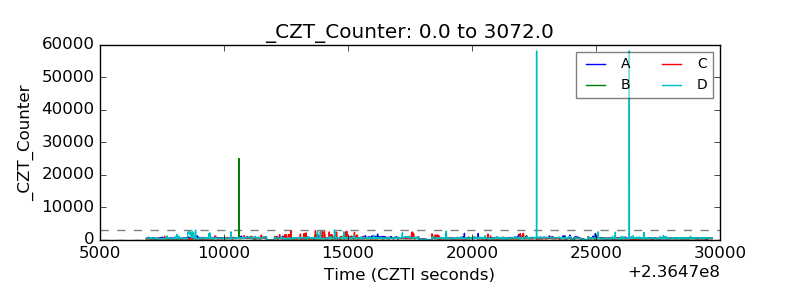 |
| +2.5 Volts monitor |  |
| +5 Volts monitor |  |
| _ROLL_ROT | 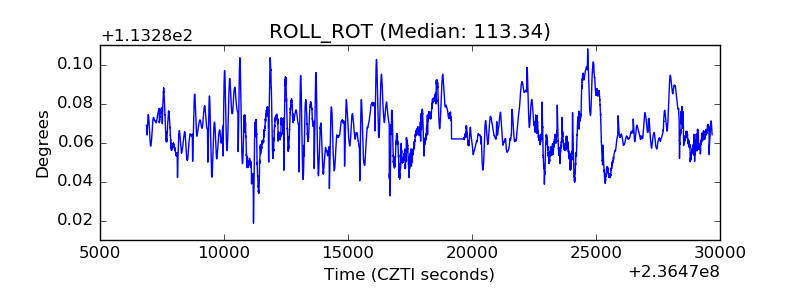 |
| _Roll_DEC |  |
| _Roll_RA | 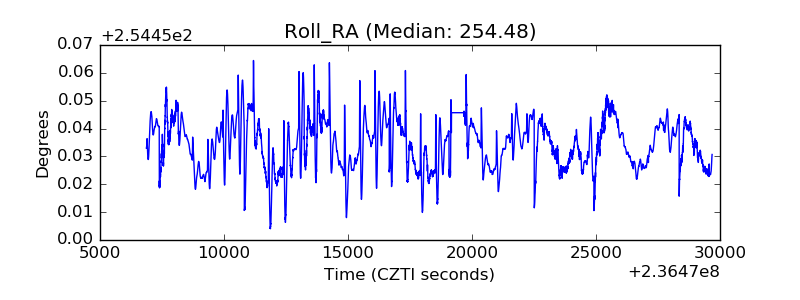 |
| Veto Counter | 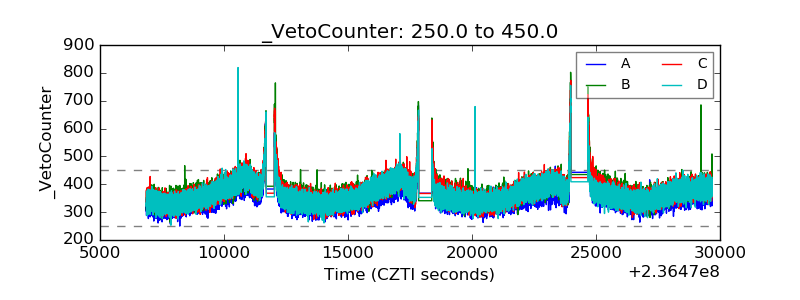 |