| Param | Original file | Final file |
|---|---|---|
| Filename | modeM0/AS1A03_005T01_9000001348_09493cztM0_level2.evt | modeM0/AS1A03_005T01_9000001348_09493cztM0_level2_quad_clean.evt |
| Size (bytes) | 1,594,457,280 | 255,101,760 |
| Size | 1.5 GB | 243.3 MB |
| Events in quadrant A | 12,540,561 | 1,567,642 |
| Events in quadrant B | 9,695,108 | 1,588,727 |
| Events in quadrant C | 11,344,984 | 1,572,204 |
| Events in quadrant D | 13,272,738 | 1,533,871 |
| Mode M0 | |||
|---|---|---|---|
| Quadrant | BADHDUFLAG | Total packets | Discarded packets |
| A | 0 | 51177 | 5 |
| B | 0 | 43357 | 3 |
| C | 0 | 48484 | 3 |
| D | 0 | 54071 | 5 |
| Mode SS | |||
|---|---|---|---|
| Quadrant | BADHDUFLAG | Total packets | Discarded packets |
| A | 0 | 432 | 0 |
| B | 0 | 432 | 0 |
| C | 0 | 432 | 0 |
| D | 0 | 432 | 0 |
| Mode M9 | |||
|---|---|---|---|
| Quadrant | BADHDUFLAG | Total packets | Discarded packets |
| A | 0 | 15 | 0 |
| B | 0 | 15 | 0 |
| C | 0 | 15 | 0 |
| D | 0 | 15 | 0 |
| Quadrant | Total seconds | Saturated seconds | Saturation percentage |
|---|---|---|---|
| A | 21259 | 216 | 1.016040% |
| B | 21260 | 151 | 0.710254% |
| C | 21260 | 528 | 2.483537% |
| D | 21259 | 387 | 1.820405% |
Noise dominated data is calculated using 1-second bins in cleaned event files. If a bin has >2000 counts, and if more than 50% of those come from <1% of pixels, then it is considered to be noise-dominated and hence unusable.
| Quadrant | # 1 sec bins | Bins with >0 counts | Bins with >2000 counts | High rate bins dominated by noise | Noise dominated (total time) | Noise dominated (detector-on time) | Marked lightcurve |
|---|---|---|---|---|---|---|---|
| A | 22815 | 21263 | 12 | 12 | 0.05% | 0.06% |  |
| B | 22815 | 21263 | 0 | 0 | 0.00% | 0.00% |  |
| C | 22815 | 21263 | 289 | 289 | 1.27% | 1.36% | 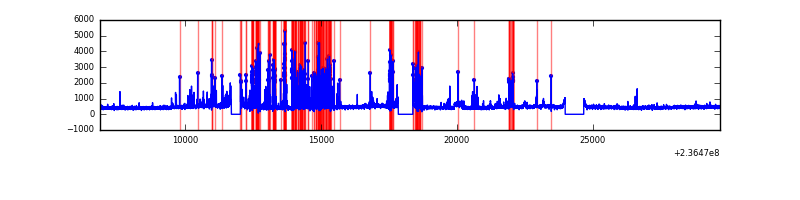 |
| D | 22815 | 21263 | 260 | 260 | 1.14% | 1.22% |  |
Top three noisy pixels from each quadrant. If the there are fewer than three noisy pixels in the level2.evt file, extra rows are filled as -1
| Pixel properties | Quadrant properties | ||||||
|---|---|---|---|---|---|---|---|
| Quadrant | DetID | PixID | Counts | Sigma | Mean | Median | Sigma |
| A | 8 | 5 | 2384449 | 4752.72 | 2460 | 2410 | 501.2 |
| A | 1 | 162 | 354258 | 702.02 | 2460 | 2410 | 501.2 |
| A | 1 | 178 | 130845 | 256.26 | 2460 | 2410 | 501.2 |
| B | 4 | 173 | 129045 | 270.57 | 2463 | 2403 | 468.1 |
| B | 12 | 111 | 54904 | 112.17 | 2463 | 2403 | 468.1 |
| B | 11 | 111 | 44834 | 90.65 | 2463 | 2403 | 468.1 |
| C | 4 | 254 | 1866282 | 3391.2 | 2382 | 2399 | 549.6 |
| C | 9 | 68 | 181836 | 326.47 | 2382 | 2399 | 549.6 |
| C | 13 | 61 | 17535 | 27.54 | 2382 | 2399 | 549.6 |
| D | 8 | 195 | 1898251 | 3183.66 | 2375 | 2317 | 595.5 |
| D | 1 | 52 | 834339 | 1397.13 | 2375 | 2317 | 595.5 |
| D | 2 | 136 | 607400 | 1016.06 | 2375 | 2317 | 595.5 |
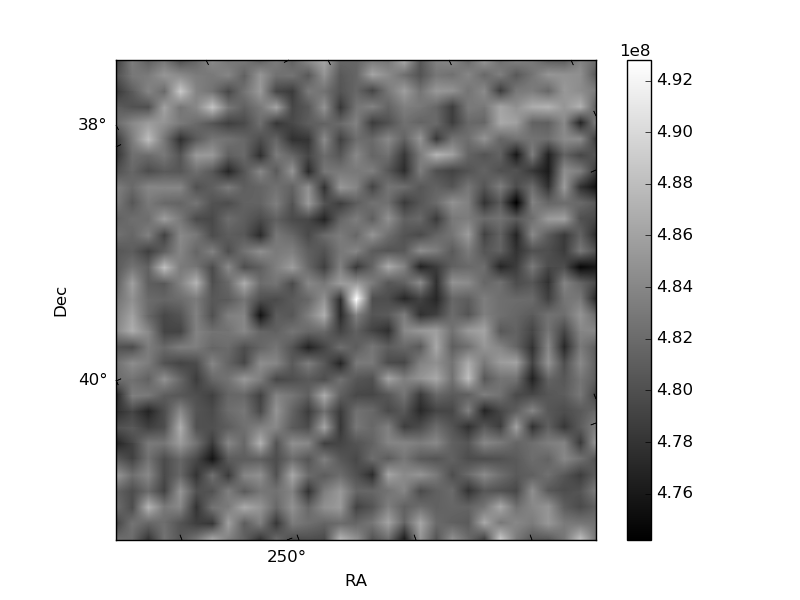
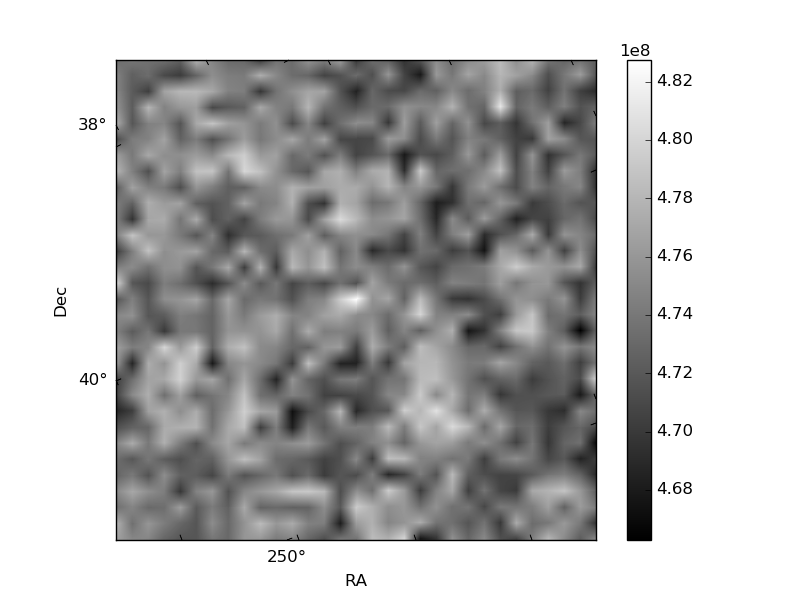
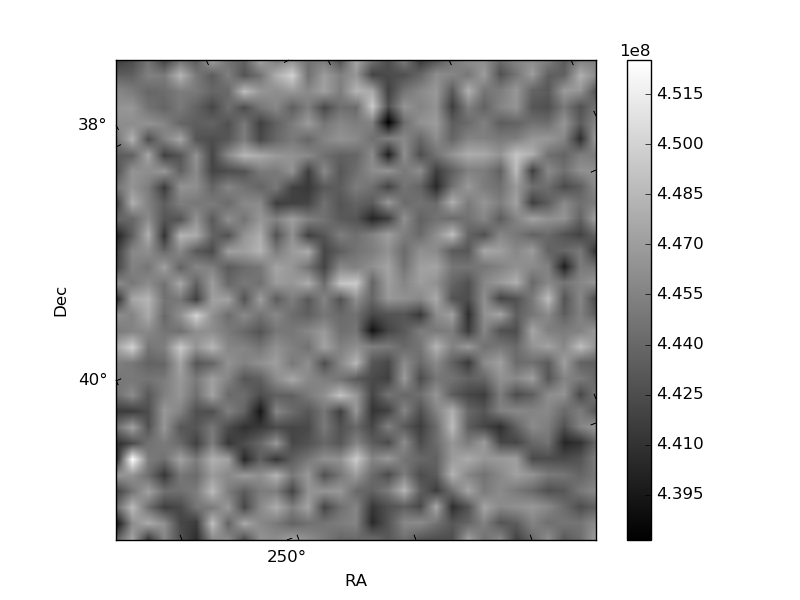
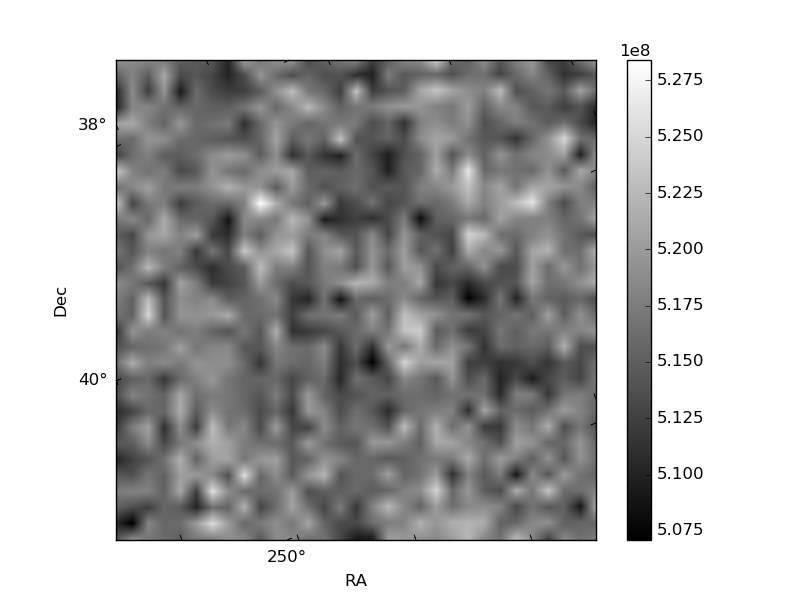
Histogram calculated using DETX and DETY for each event in the final _common_clean file
| Quadrant A | 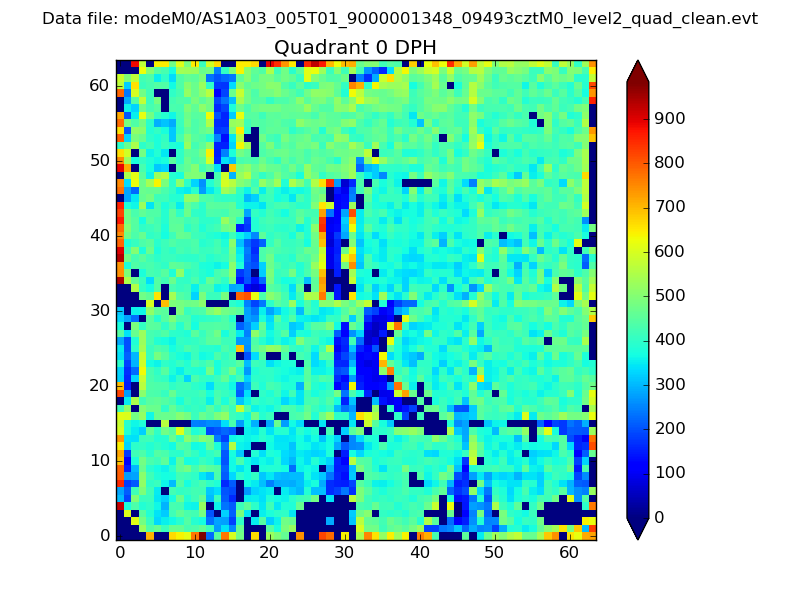 |
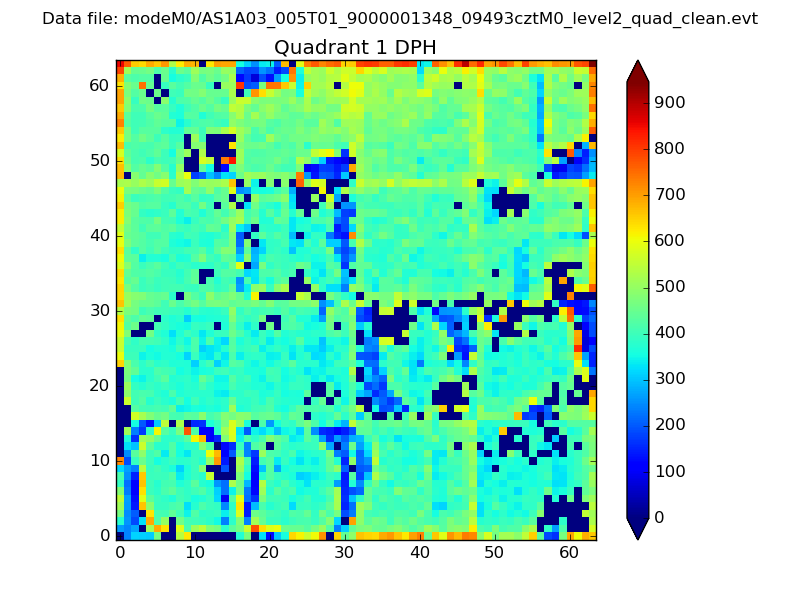 |
Quadrant B |
|---|---|---|---|
| Quadrant D | 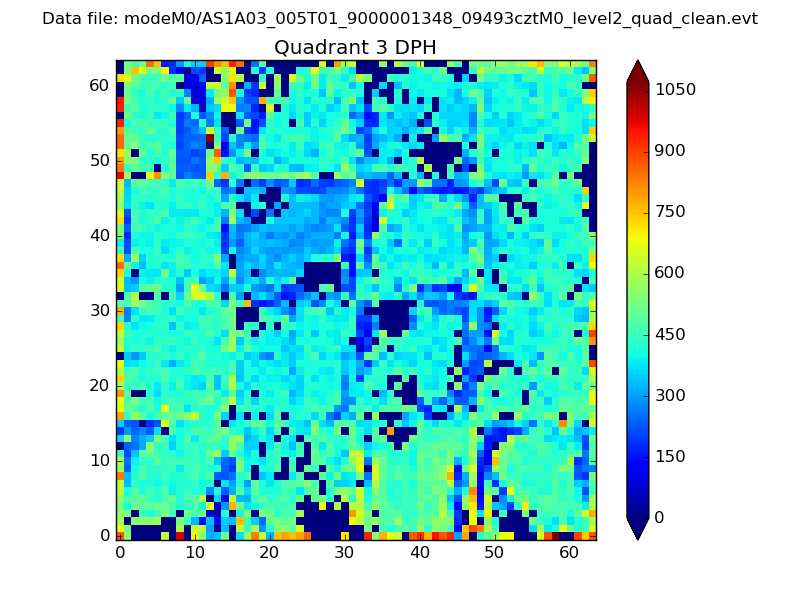 |
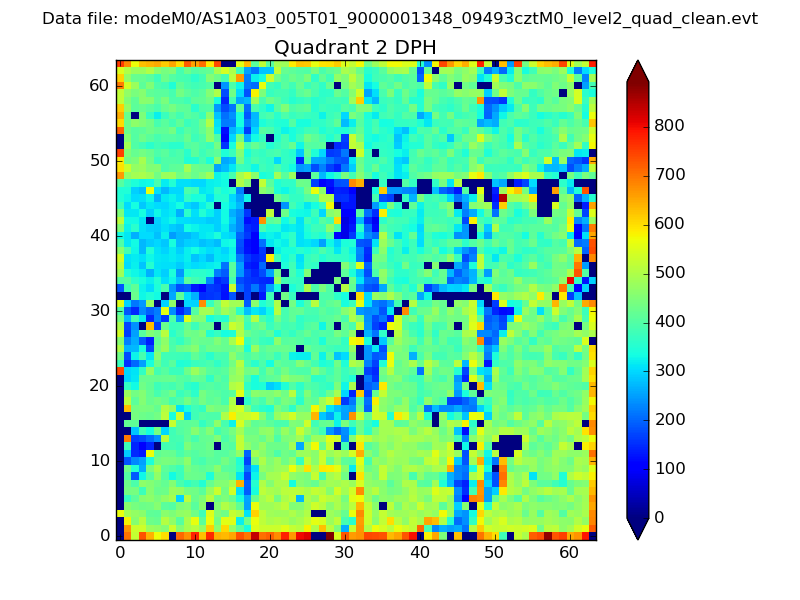 |
Quadrant C |
| Plot type | Count rate plots | Images |
|---|---|---|
| Comparison with Poisson distribution Blue bars denote a histogram of data divided into 1 sec bins. Red curve is a Poisson curve with rate = median count rate of data. |
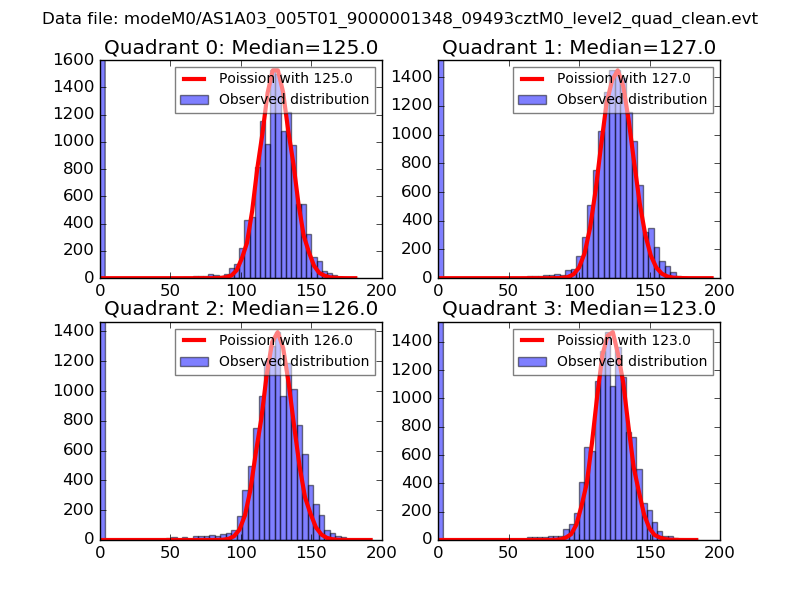 |
 |
| Quadrant-wise count rates Data is divided into 100 sec bins |
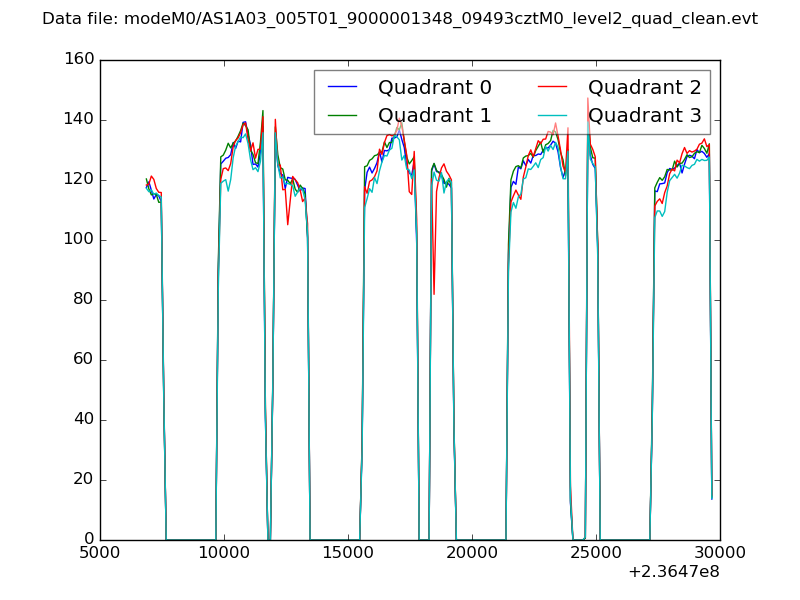 |
|
| Module-wise count rates for Quadrant A Data is divided into 100 sec bins |
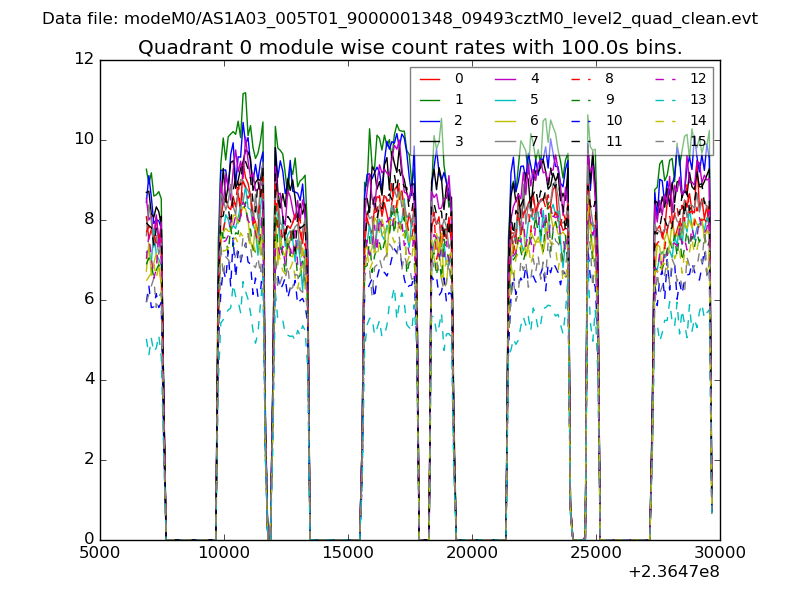 |
 |
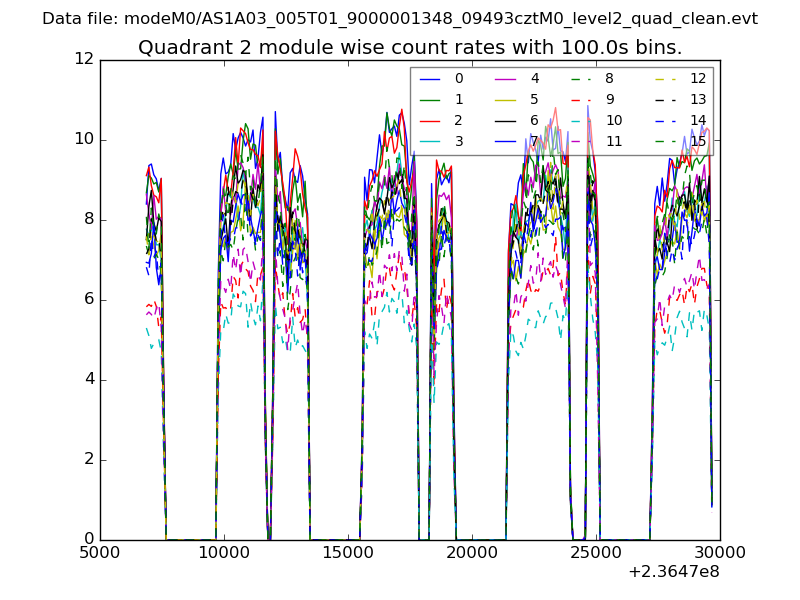
| Module-wise count rates for Quadrant B Data is divided into 100 sec bins |
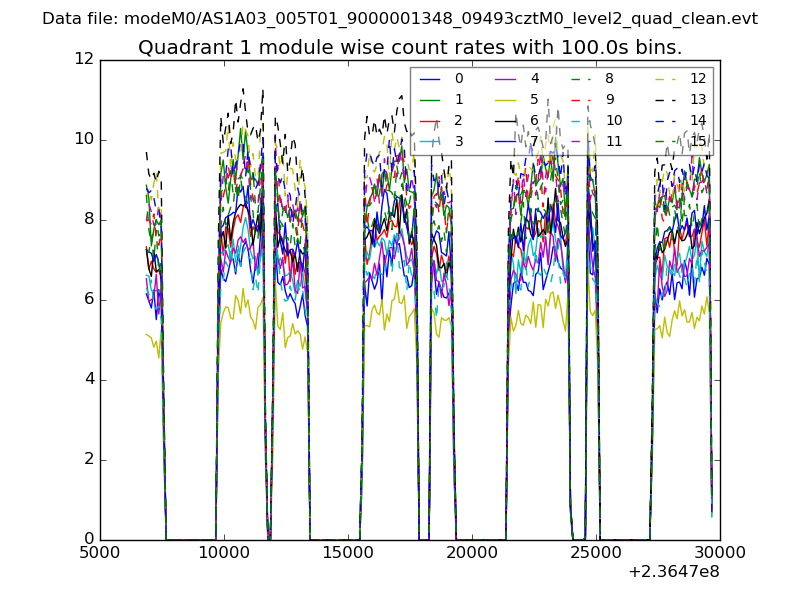 |
 |
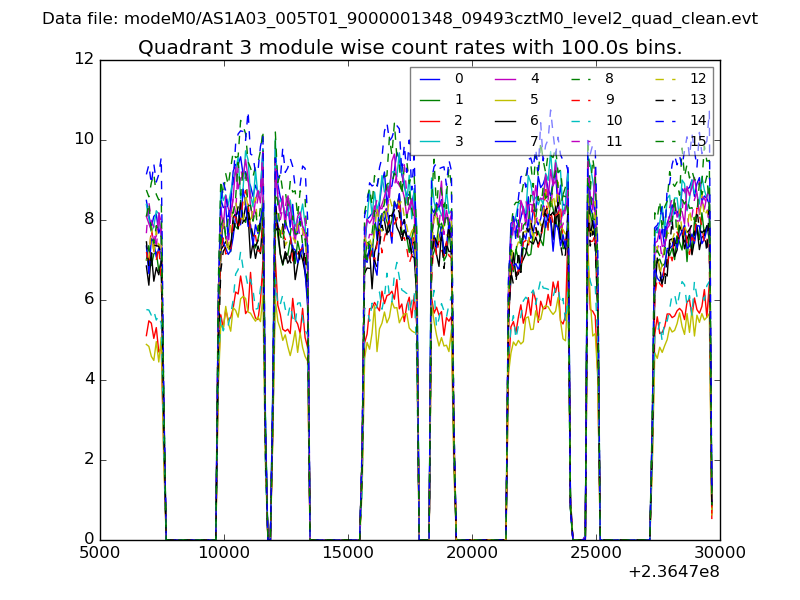
| Module-wise count rates for Quadrant C Data is divided into 100 sec bins |
 |
 |
| Module-wise count rates for Quadrant D Data is divided into 100 sec bins |
 |
 |
| Parameter | Plot |
|---|---|
| CZT HV Monitor | 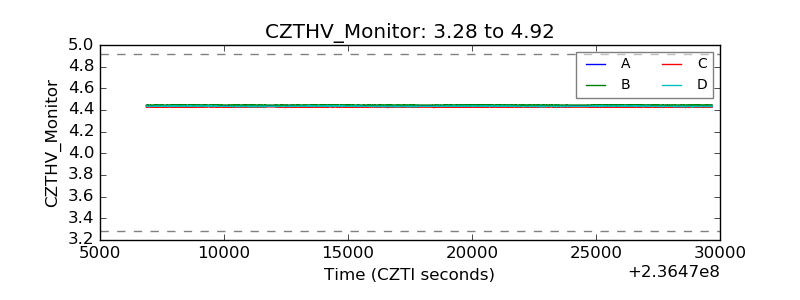 |
| D_VDD | 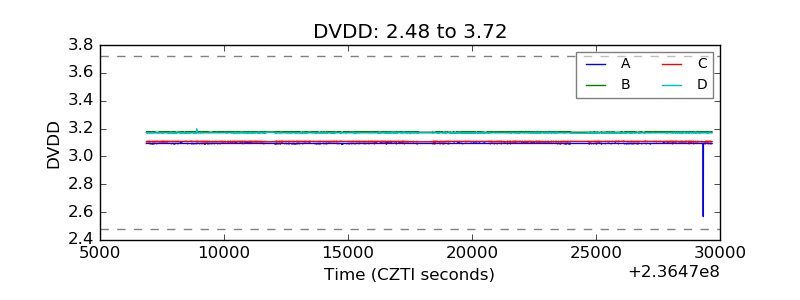 |
| Temperature 1 | 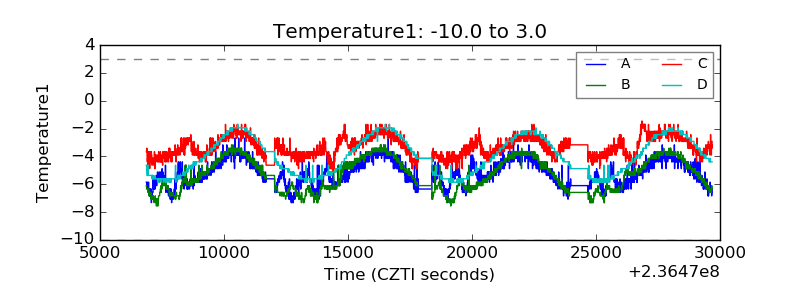 |
| Veto HV Monitor | 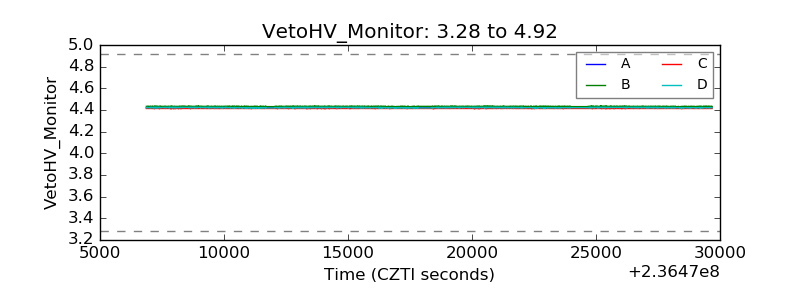 |
| Veto LLD | 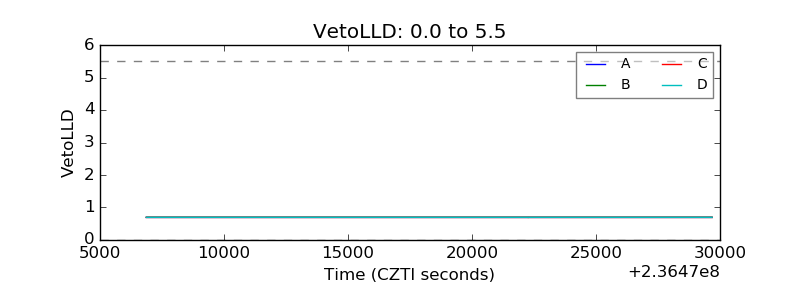 |
| Alpha Counter | 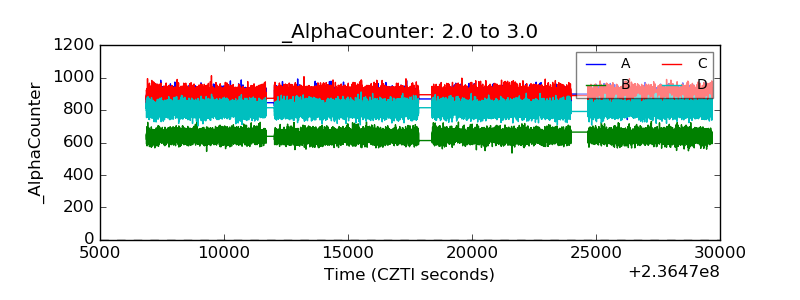 |
| _CPM_Rate | 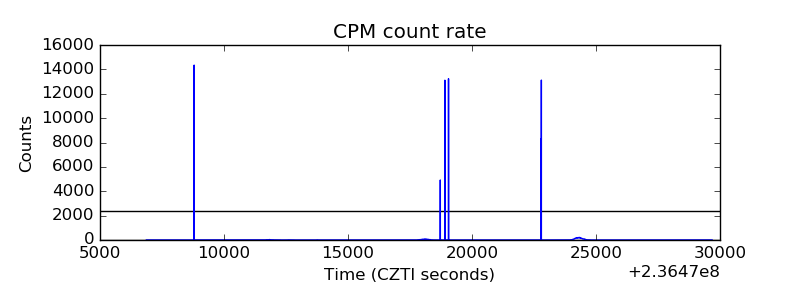 |
| CZT Counter | 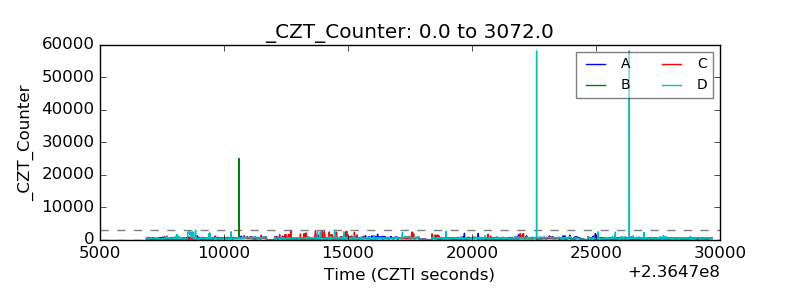 |
| +2.5 Volts monitor |  |
| +5 Volts monitor | 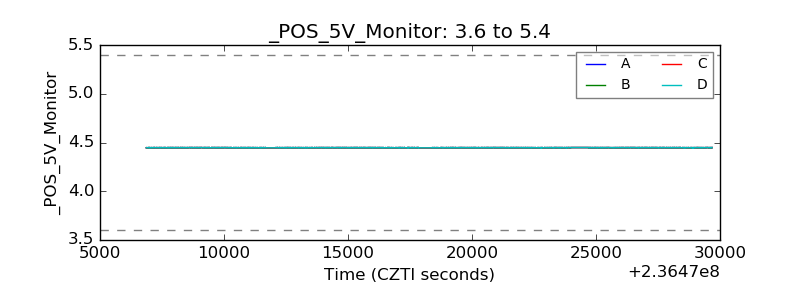 |
| _ROLL_ROT | 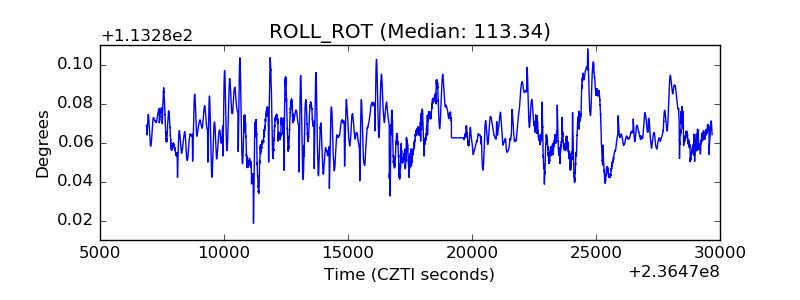 |
| _Roll_DEC | 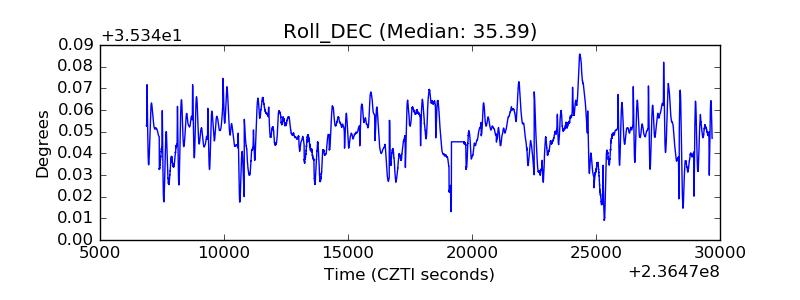 |
| _Roll_RA | 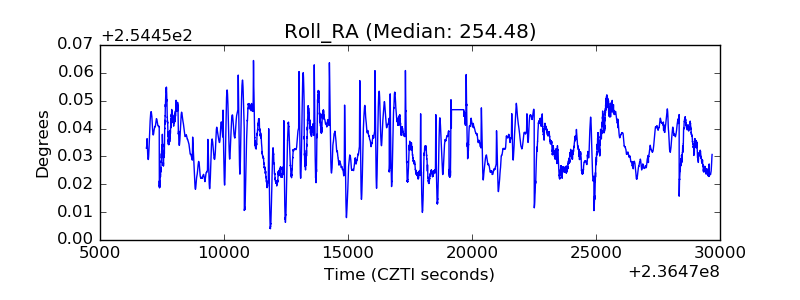 |
| Veto Counter | 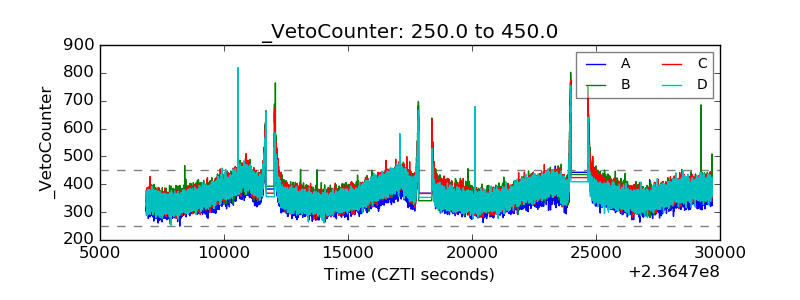 |