| Param | Original file | Final file |
|---|---|---|
| Filename | modeM0/AS1G05_230T06_9000001350_09490cztM0_level2.evt | modeM0/AS1G05_230T06_9000001350_09490cztM0_level2_quad_clean.evt |
| Size (bytes) | 436,642,560 | 61,562,880 |
| Size | 416.4 MB | 58.7 MB |
| Events in quadrant A | 3,681,266 | 358,884 |
| Events in quadrant B | 2,961,499 | 367,191 |
| Events in quadrant C | 2,804,652 | 363,059 |
| Events in quadrant D | 3,360,985 | 348,837 |
| Mode M0 | |||
|---|---|---|---|
| Quadrant | BADHDUFLAG | Total packets | Discarded packets |
| A | 0 | 16709 | 1808 |
| B | 0 | 13962 | 1287 |
| C | 0 | 13807 | 1288 |
| D | 0 | 15633 | 1677 |
| Mode SS | |||
|---|---|---|---|
| Quadrant | BADHDUFLAG | Total packets | Discarded packets |
| A | 0 | 138 | 10 |
| B | 0 | 138 | 8 |
| C | 0 | 138 | 20 |
| D | 0 | 138 | 10 |
| Mode M9 | |||
|---|---|---|---|
| Quadrant | BADHDUFLAG | Total packets | Discarded packets |
| A | 0 | 14 | 3 |
| B | 0 | 14 | 2 |
| C | 0 | 14 | 3 |
| D | 0 | 14 | 1 |
| Quadrant | Total seconds | Saturated seconds | Saturation percentage |
|---|---|---|---|
| A | 6028 | 77 | 1.277372% |
| B | 6125 | 49 | 0.800000% |
| C | 6124 | 46 | 0.751143% |
| D | 6063 | 71 | 1.171037% |
Noise dominated data is calculated using 1-second bins in cleaned event files. If a bin has >2000 counts, and if more than 50% of those come from <1% of pixels, then it is considered to be noise-dominated and hence unusable.
| Quadrant | # 1 sec bins | Bins with >0 counts | Bins with >2000 counts | High rate bins dominated by noise | Noise dominated (total time) | Noise dominated (detector-on time) | Marked lightcurve |
|---|---|---|---|---|---|---|---|
| A | 7791 | 6556 | 8 | 8 | 0.10% | 0.12% | 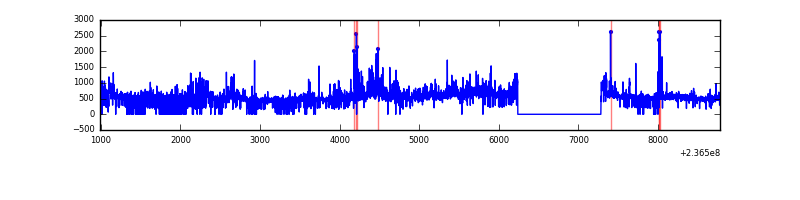 |
| B | 7785 | 6600 | 1 | 1 | 0.01% | 0.02% | 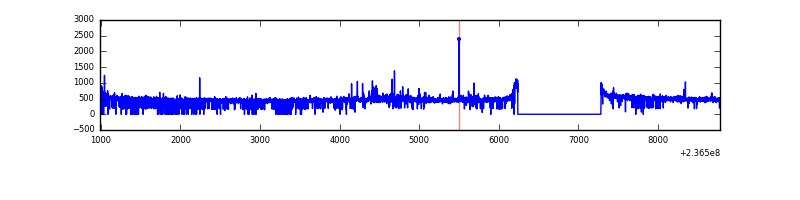 |
| C | 7791 | 6632 | 0 | 0 | 0.00% | 0.00% | 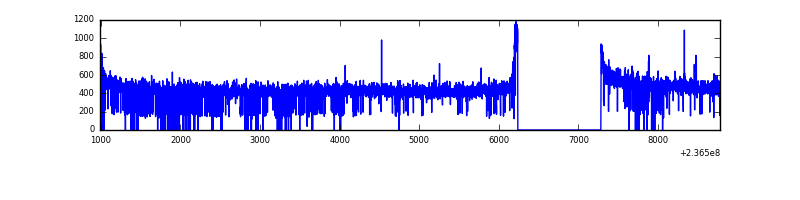 |
| D | 7791 | 6592 | 30 | 30 | 0.39% | 0.46% | 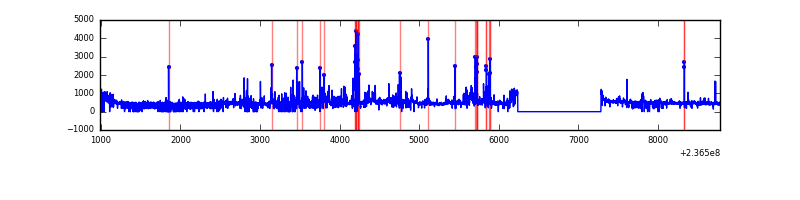 |
Top three noisy pixels from each quadrant. If the there are fewer than three noisy pixels in the level2.evt file, extra rows are filled as -1
| Pixel properties | Quadrant properties | ||||||
|---|---|---|---|---|---|---|---|
| Quadrant | DetID | PixID | Counts | Sigma | Mean | Median | Sigma |
| A | 8 | 5 | 531740 | 3593.61 | 725 | 709 | 147.8 |
| A | 1 | 162 | 152471 | 1027.01 | 725 | 709 | 147.8 |
| A | 1 | 178 | 65357 | 437.49 | 725 | 709 | 147.8 |
| B | 0 | 214 | 54869 | 381.02 | 741 | 722 | 142.1 |
| B | 12 | 111 | 16021 | 107.66 | 741 | 722 | 142.1 |
| B | 11 | 111 | 12977 | 86.24 | 741 | 722 | 142.1 |
| C | 9 | 68 | 11035 | 62.38 | 714 | 716 | 165.4 |
| C | 4 | 254 | 5436 | 28.54 | 714 | 716 | 165.4 |
| C | 13 | 61 | 5421 | 28.44 | 714 | 716 | 165.4 |
| D | 1 | 52 | 287133 | 1684.23 | 699 | 682 | 170.1 |
| D | 8 | 195 | 139239 | 814.67 | 699 | 682 | 170.1 |
| D | 10 | 172 | 85626 | 499.44 | 699 | 682 | 170.1 |
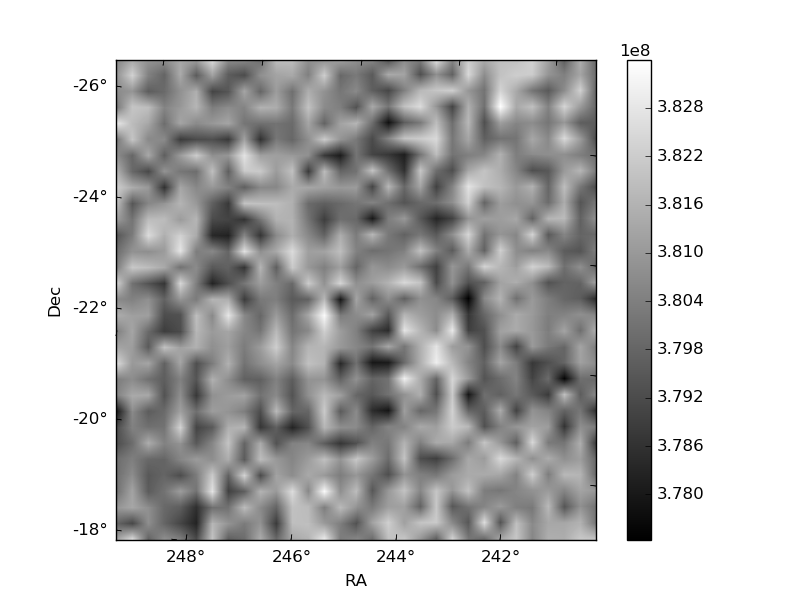
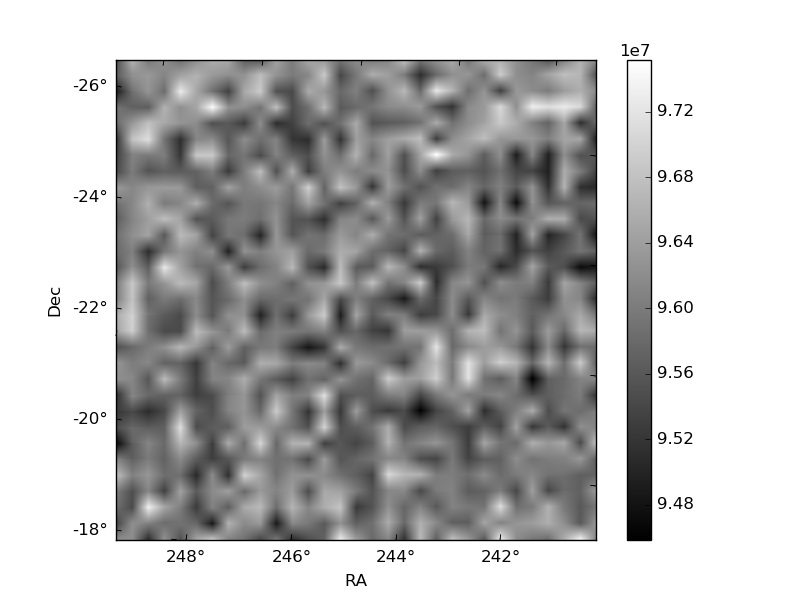
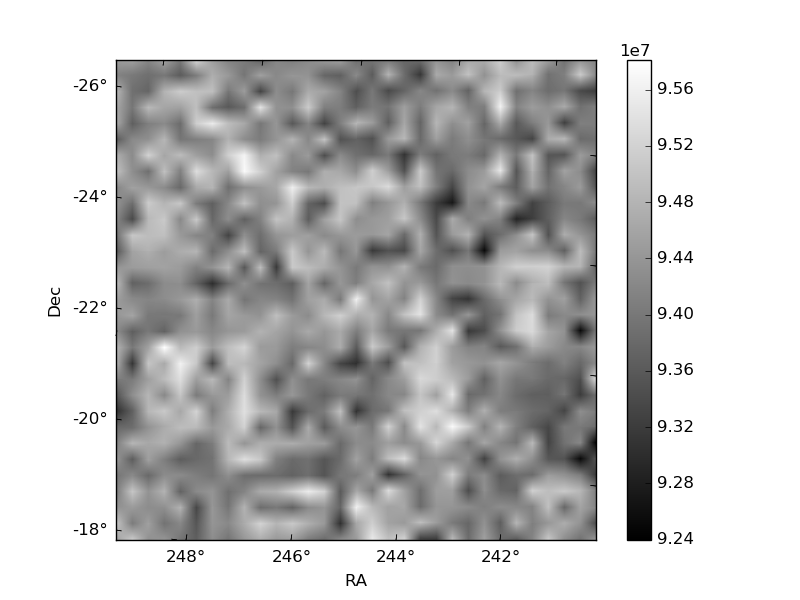
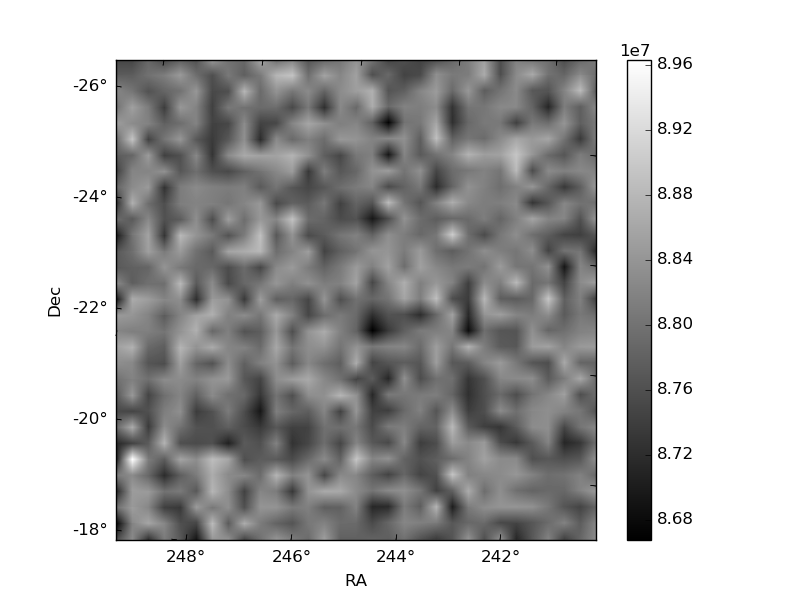
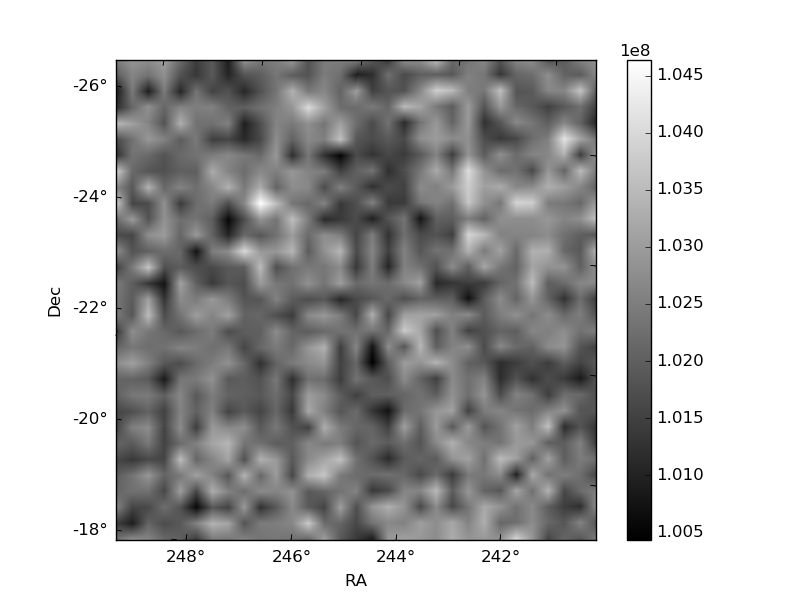
Histogram calculated using DETX and DETY for each event in the final _common_clean file
| Quadrant A | 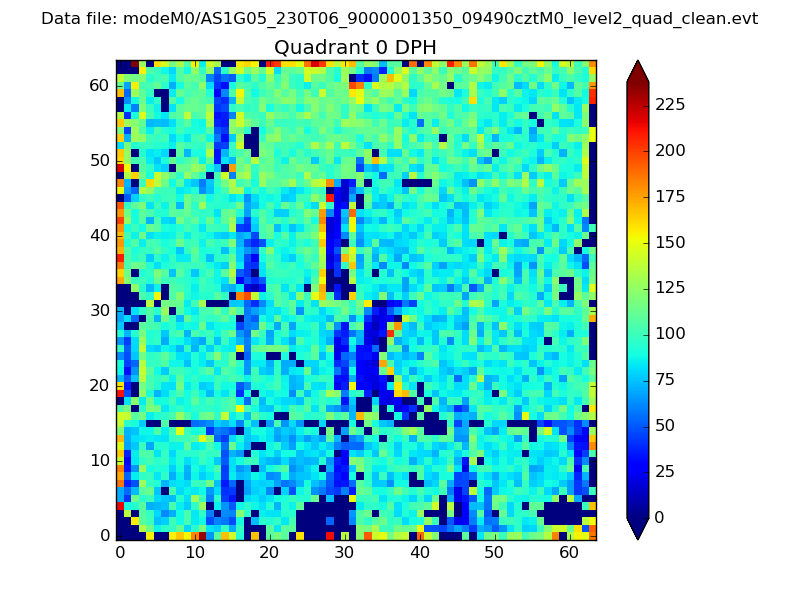 |
 |
Quadrant B |
|---|---|---|---|
| Quadrant D | 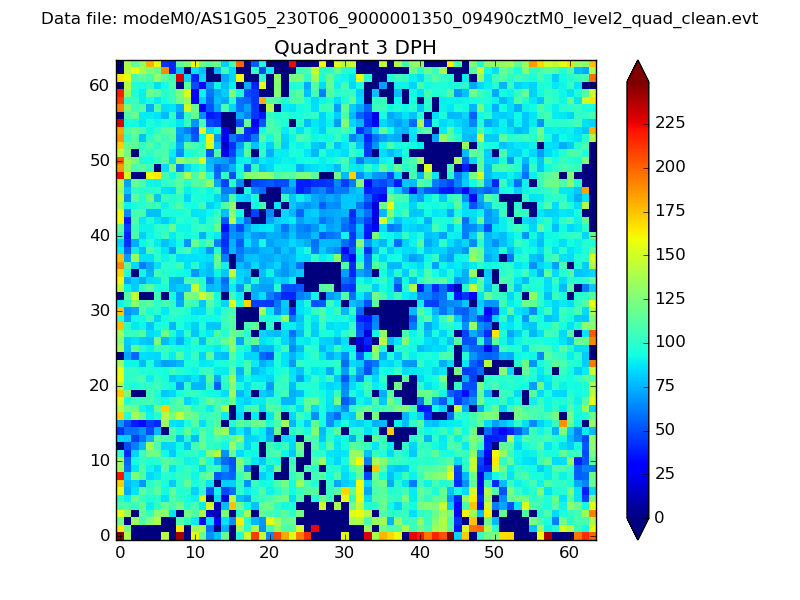 |
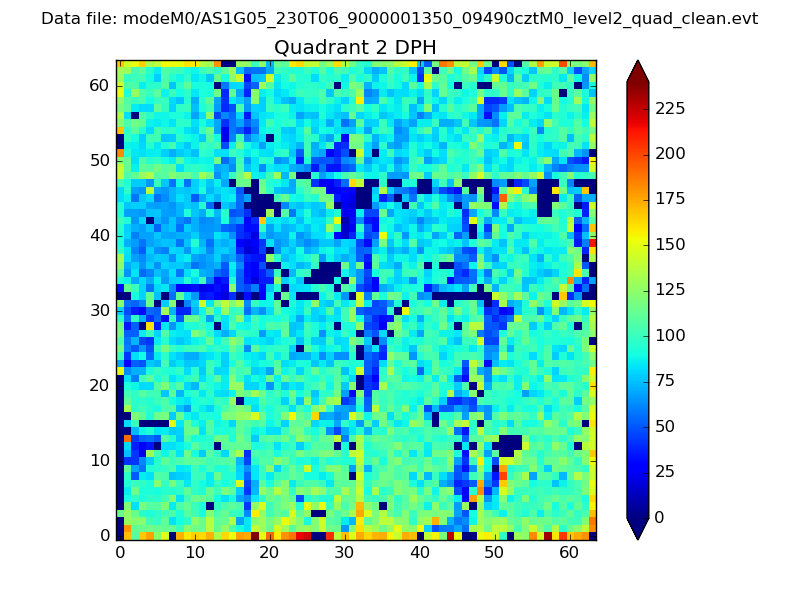 |
Quadrant C |
| Plot type | Count rate plots | Images |
|---|---|---|
| Comparison with Poisson distribution Blue bars denote a histogram of data divided into 1 sec bins. Red curve is a Poisson curve with rate = median count rate of data. |
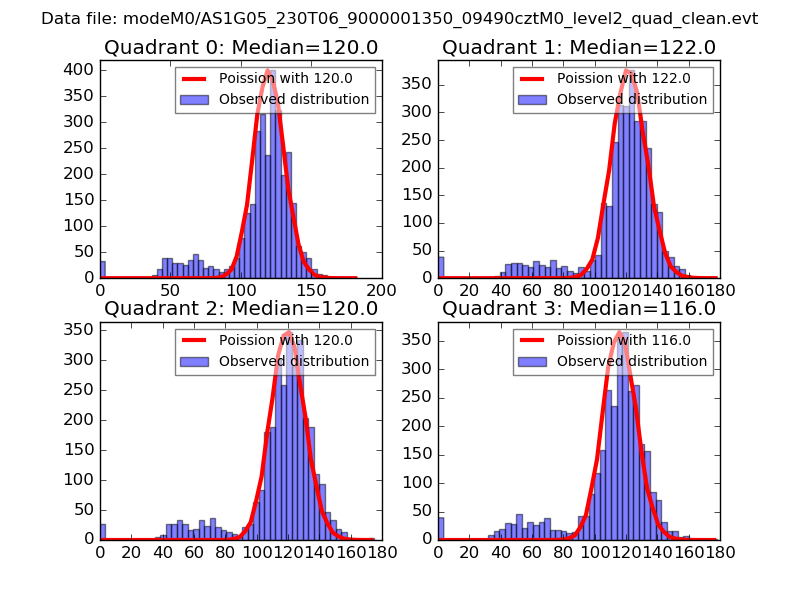 |
 |
| Quadrant-wise count rates Data is divided into 100 sec bins |
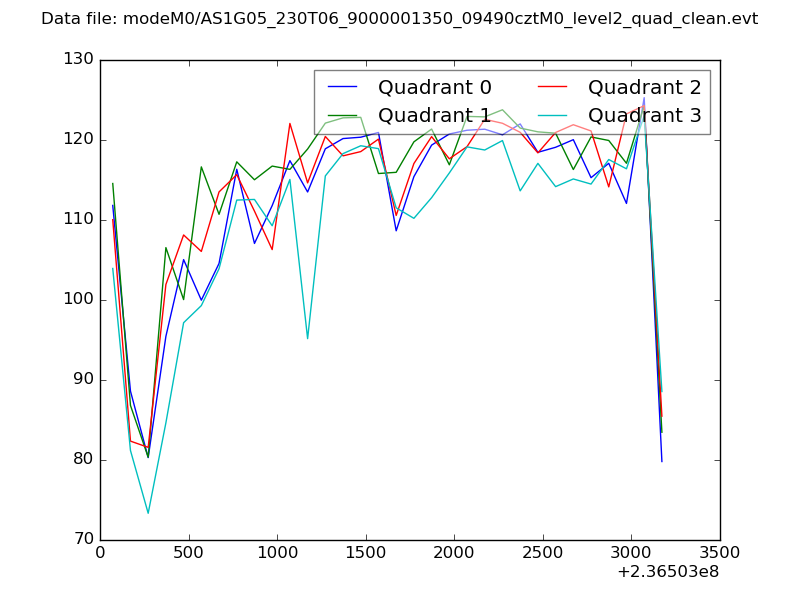 |
|
| Module-wise count rates for Quadrant A Data is divided into 100 sec bins |
 |
 |
| Module-wise count rates for Quadrant B Data is divided into 100 sec bins |
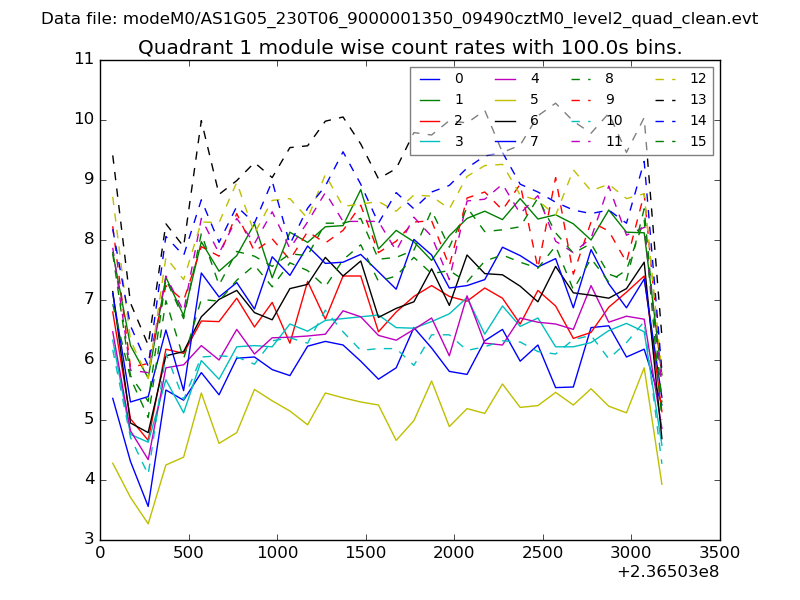 |
 |
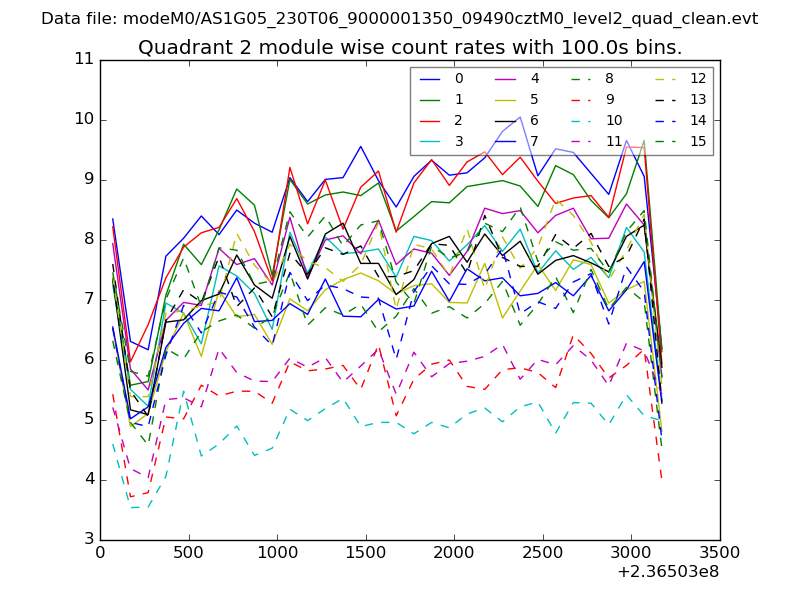
| Module-wise count rates for Quadrant C Data is divided into 100 sec bins |
 |
 |
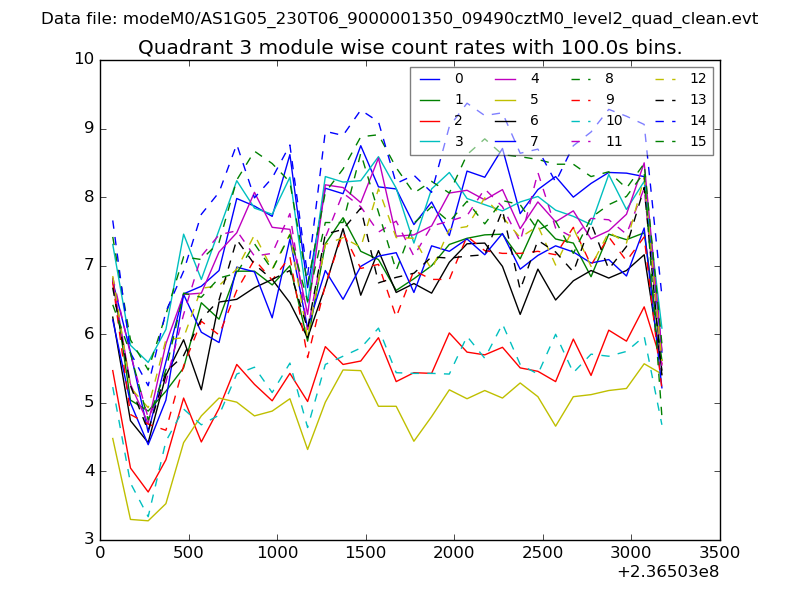
| Module-wise count rates for Quadrant D Data is divided into 100 sec bins |
 |
 |
| Parameter | Plot |
|---|---|
| CZT HV Monitor | 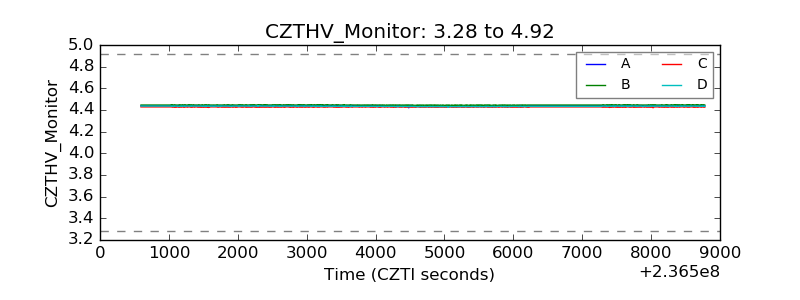 |
| D_VDD | 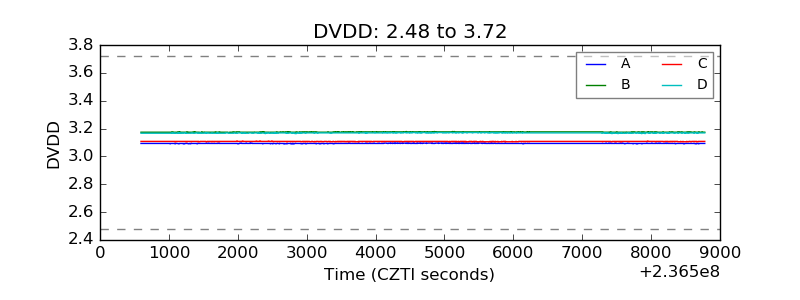 |
| Temperature 1 | 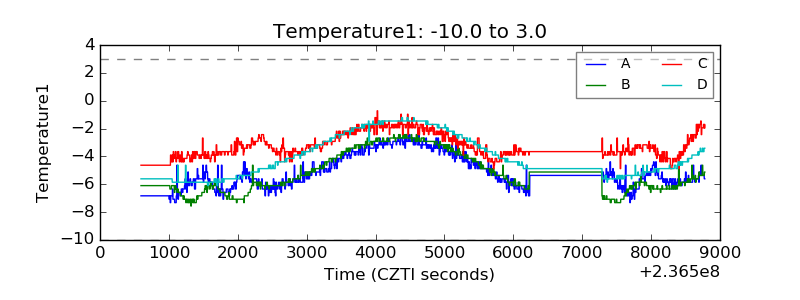 |
| Veto HV Monitor | 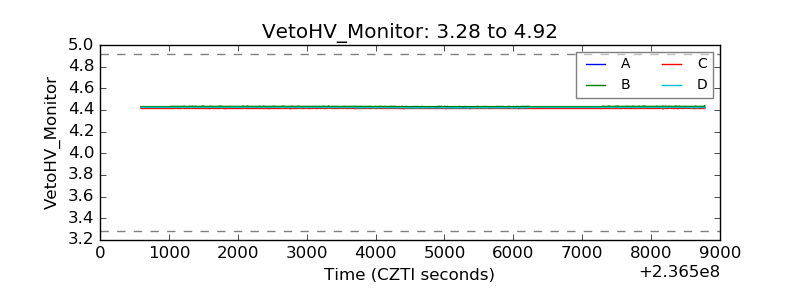 |
| Veto LLD | 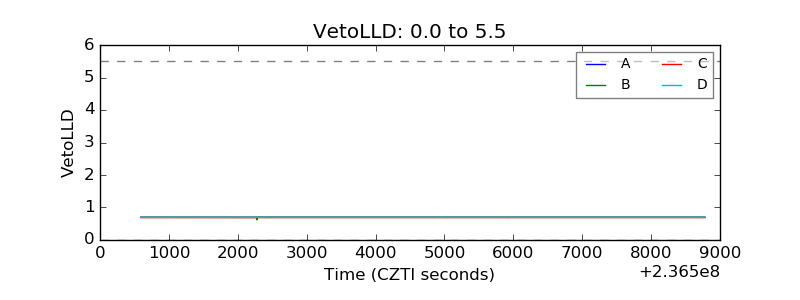 |
| Alpha Counter | 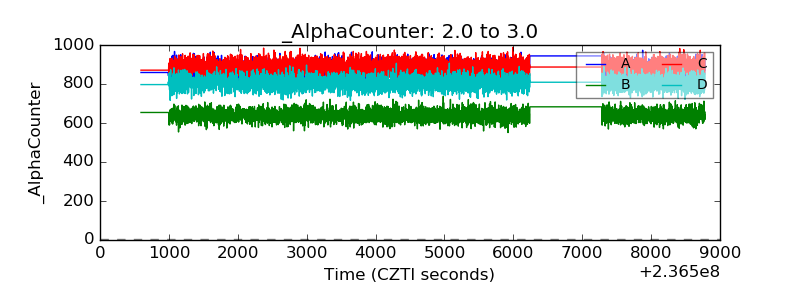 |
| _CPM_Rate | 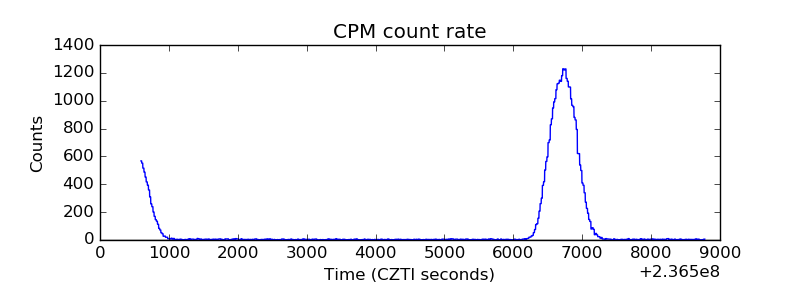 |
| CZT Counter | 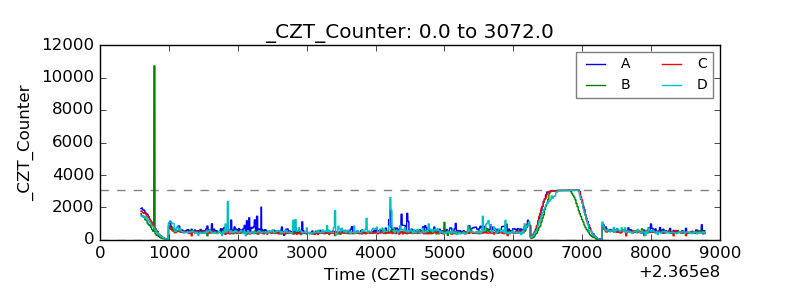 |
| +2.5 Volts monitor |  |
| +5 Volts monitor |  |
| _ROLL_ROT | 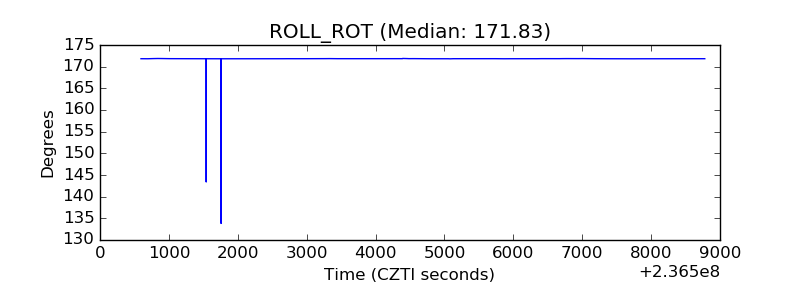 |
| _Roll_DEC | 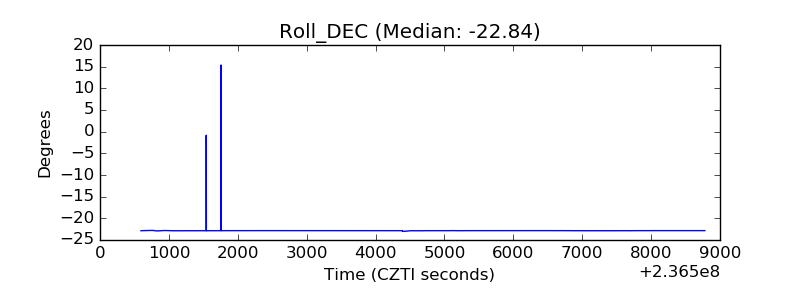 |
| _Roll_RA | 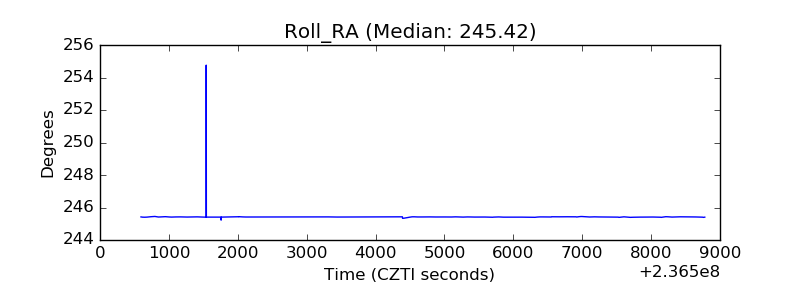 |
| Veto Counter | 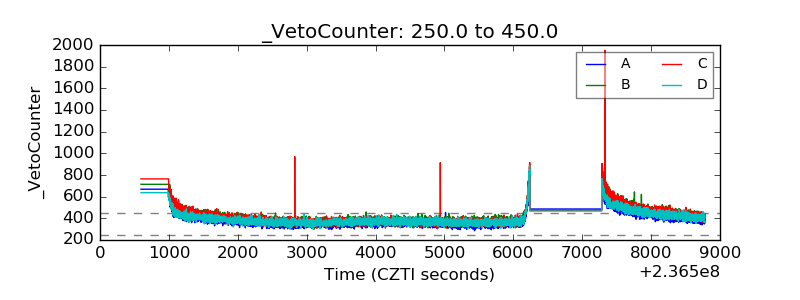 |