| Param | Original file | Final file |
|---|---|---|
| Filename | modeM0/AS1G05_230T06_9000001350_09495cztM0_level2.evt | modeM0/AS1G05_230T06_9000001350_09495cztM0_level2_quad_clean.evt |
| Size (bytes) | 210,876,480 | 46,733,760 |
| Size | 201.1 MB | 44.6 MB |
| Events in quadrant A | 1,818,046 | 311,378 |
| Events in quadrant B | 1,470,325 | 315,913 |
| Events in quadrant C | 1,422,351 | 311,683 |
| Events in quadrant D | 1,494,874 | 287,989 |
| Mode M0 | |||
|---|---|---|---|
| Quadrant | BADHDUFLAG | Total packets | Discarded packets |
| A | 0 | 16617 | 9533 |
| B | 0 | 12202 | 6153 |
| C | 0 | 12218 | 6301 |
| D | 0 | 13014 | 6957 |
| Mode SS | |||
|---|---|---|---|
| Quadrant | BADHDUFLAG | Total packets | Discarded packets |
| A | 0 | 111 | 63 |
| B | 0 | 111 | 57 |
| C | 0 | 111 | 57 |
| D | 0 | 111 | 57 |
| Mode M9 | |||
|---|---|---|---|
| Quadrant | BADHDUFLAG | Total packets | Discarded packets |
| A | 0 | 14 | 2 |
| B | 0 | 14 | 2 |
| C | 0 | 14 | 7 |
| D | 0 | 14 | 3 |
| Quadrant | Total seconds | Saturated seconds | Saturation percentage |
|---|---|---|---|
| A | 2372 | 207 | 8.726813% |
| B | 2705 | 87 | 3.216266% |
| C | 2737 | 76 | 2.776763% |
| D | 2637 | 96 | 3.640501% |
Noise dominated data is calculated using 1-second bins in cleaned event files. If a bin has >2000 counts, and if more than 50% of those come from <1% of pixels, then it is considered to be noise-dominated and hence unusable.
| Quadrant | # 1 sec bins | Bins with >0 counts | Bins with >2000 counts | High rate bins dominated by noise | Noise dominated (total time) | Noise dominated (detector-on time) | Marked lightcurve |
|---|---|---|---|---|---|---|---|
| A | 6724 | 3158 | 51 | 51 | 0.76% | 1.61% | 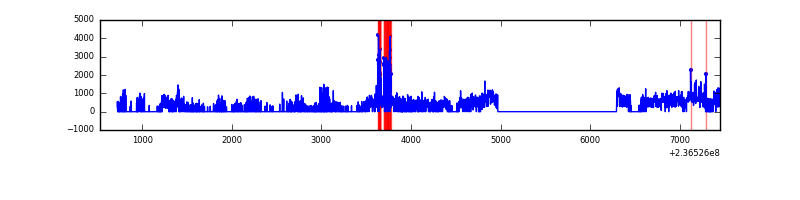 |
| B | 6833 | 3539 | 1 | 1 | 0.01% | 0.03% | 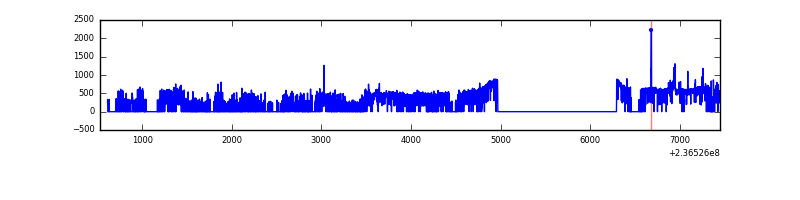 |
| C | 6723 | 3531 | 0 | 0 | 0.00% | 0.00% | 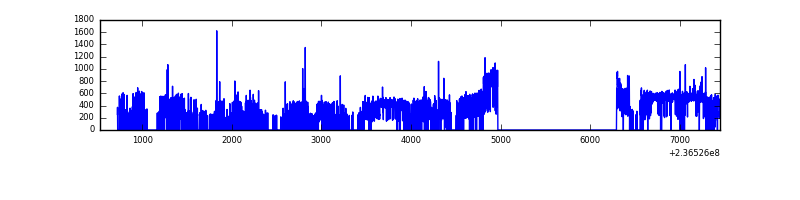 |
| D | 6918 | 3446 | 18 | 18 | 0.26% | 0.52% | 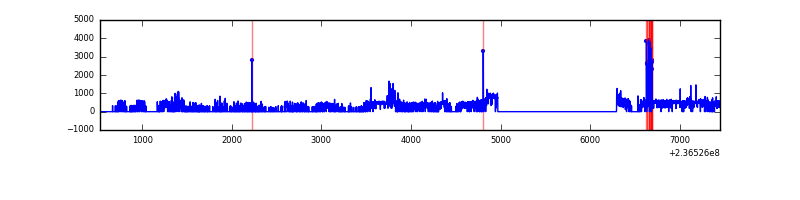 |
Top three noisy pixels from each quadrant. If the there are fewer than three noisy pixels in the level2.evt file, extra rows are filled as -1
| Pixel properties | Quadrant properties | ||||||
|---|---|---|---|---|---|---|---|
| Quadrant | DetID | PixID | Counts | Sigma | Mean | Median | Sigma |
| A | 8 | 5 | 227517 | 3429.74 | 318 | 312 | 66.2 |
| A | 15 | 174 | 169867 | 2559.49 | 318 | 312 | 66.2 |
| A | 1 | 162 | 84089 | 1264.64 | 318 | 312 | 66.2 |
| B | 4 | 173 | 33419 | 478.74 | 359 | 351 | 69.1 |
| B | 0 | 214 | 24931 | 355.86 | 359 | 351 | 69.1 |
| B | 0 | 187 | 9151 | 127.4 | 359 | 351 | 69.1 |
| C | 4 | 254 | 38397 | 463.09 | 350 | 351 | 82.2 |
| C | 9 | 68 | 14041 | 166.63 | 350 | 351 | 82.2 |
| C | 14 | 234 | 2765 | 29.38 | 350 | 351 | 82.2 |
| D | 13 | 104 | 76397 | 886.45 | 340 | 332 | 85.8 |
| D | 12 | 233 | 53830 | 623.46 | 340 | 332 | 85.8 |
| D | 8 | 195 | 26803 | 308.49 | 340 | 332 | 85.8 |
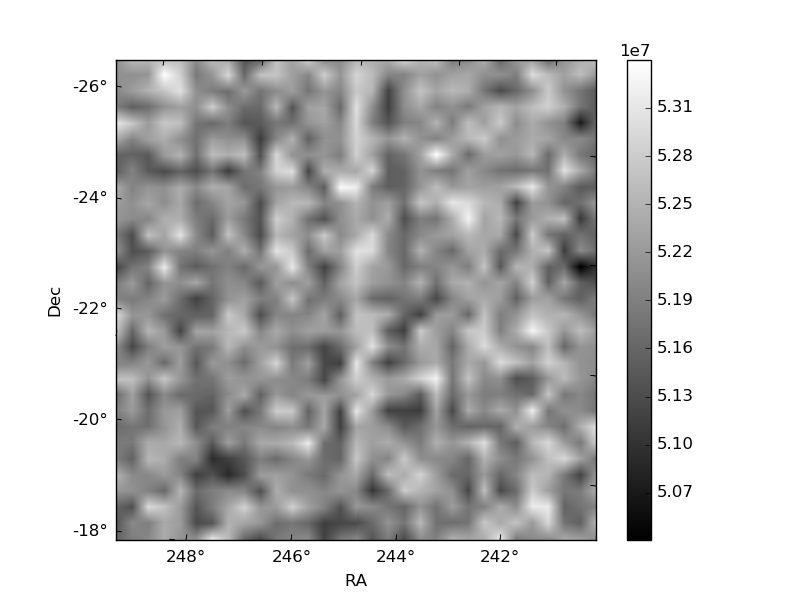
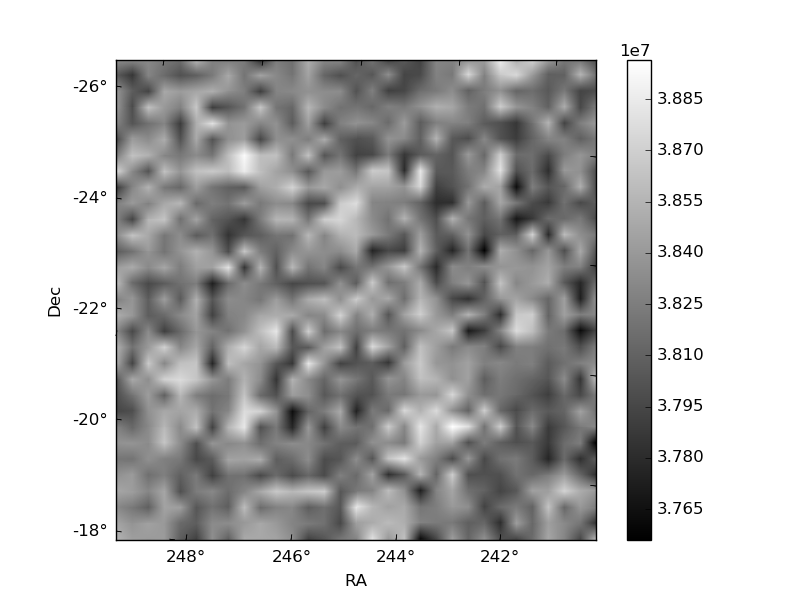
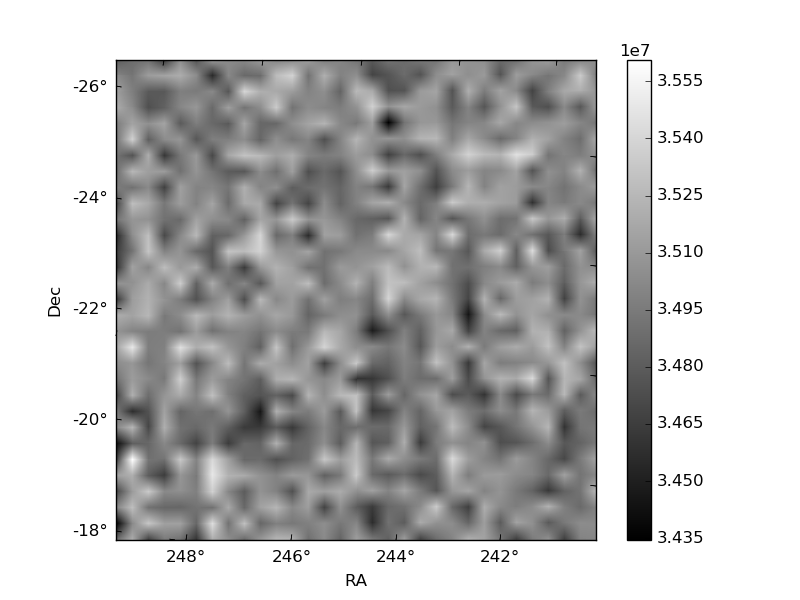
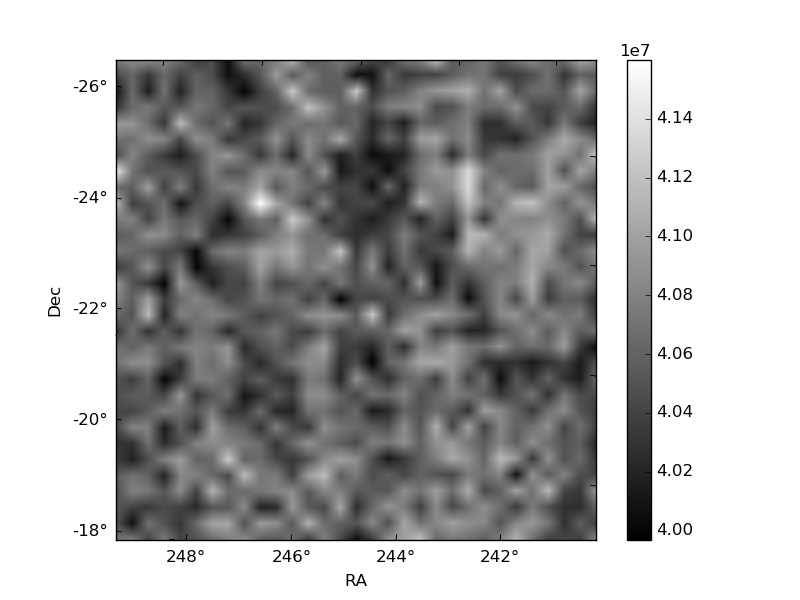
Histogram calculated using DETX and DETY for each event in the final _common_clean file
| Quadrant A |  |
 |
Quadrant B |
|---|---|---|---|
| Quadrant D |  |
 |
Quadrant C |
| Plot type | Count rate plots | Images |
|---|---|---|
| Comparison with Poisson distribution Blue bars denote a histogram of data divided into 1 sec bins. Red curve is a Poisson curve with rate = median count rate of data. |
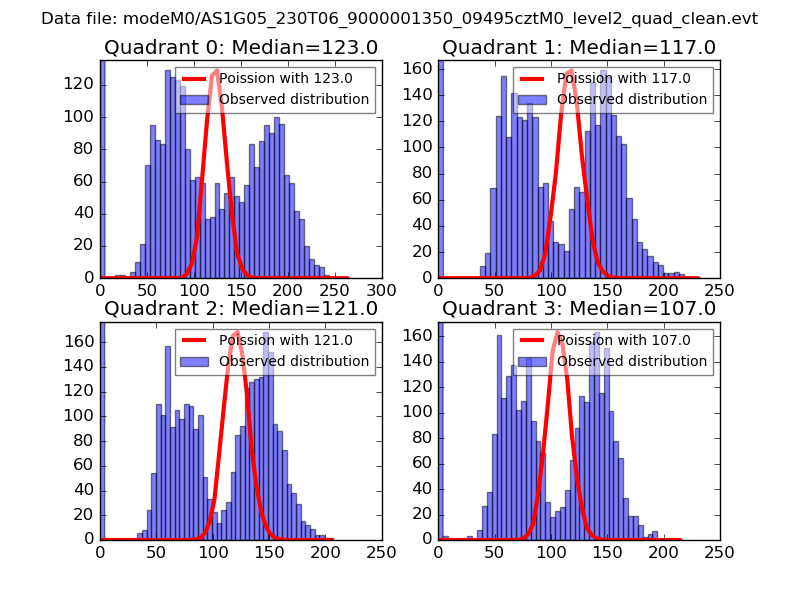 |
 |
| Quadrant-wise count rates Data is divided into 100 sec bins |
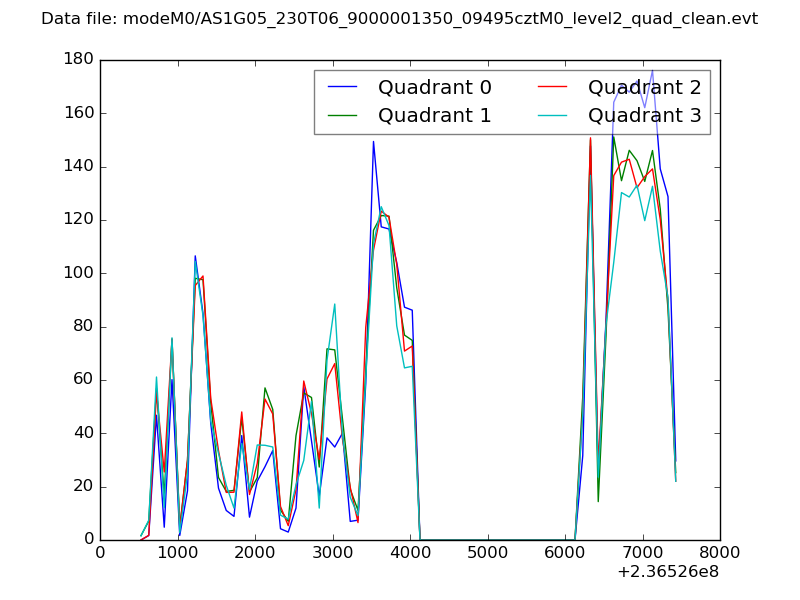 |
|
| Module-wise count rates for Quadrant A Data is divided into 100 sec bins |
 |
 |
| Module-wise count rates for Quadrant B Data is divided into 100 sec bins |
 |
 |
| Module-wise count rates for Quadrant C Data is divided into 100 sec bins |
 |
 |
| Module-wise count rates for Quadrant D Data is divided into 100 sec bins |
 |
 |
| Parameter | Plot |
|---|---|
| CZT HV Monitor |  |
| D_VDD |  |
| Temperature 1 |  |
| Veto HV Monitor |  |
| Veto LLD |  |
| Alpha Counter | 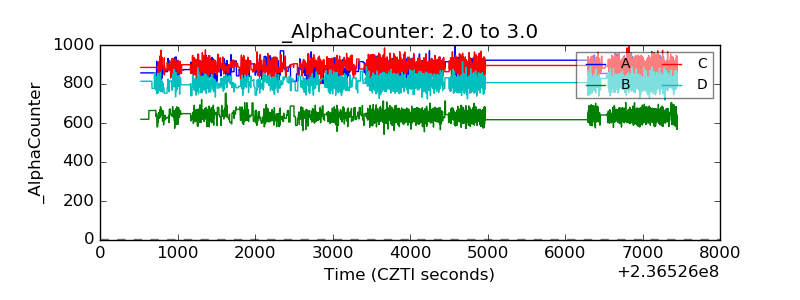 |
| _CPM_Rate | 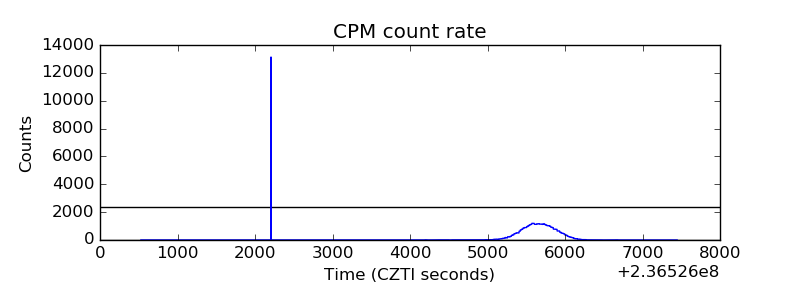 |
| CZT Counter |  |
| +2.5 Volts monitor |  |
| +5 Volts monitor |  |
| _ROLL_ROT |  |
| _Roll_DEC |  |
| _Roll_RA |  |
| Veto Counter |  |