| Param | Original file | Final file |
|---|---|---|
| Filename | modeM0/AS1G05_230T06_9000001350_09497cztM0_level2.evt | modeM0/AS1G05_230T06_9000001350_09497cztM0_level2_quad_clean.evt |
| Size (bytes) | 499,769,280 | 95,621,760 |
| Size | 476.6 MB | 91.2 MB |
| Events in quadrant A | 4,246,222 | 616,110 |
| Events in quadrant B | 3,439,962 | 619,694 |
| Events in quadrant C | 3,296,662 | 601,206 |
| Events in quadrant D | 3,694,541 | 588,319 |
| Mode M0 | |||
|---|---|---|---|
| Quadrant | BADHDUFLAG | Total packets | Discarded packets |
| A | 0 | 17225 | 3 |
| B | 0 | 14577 | 2 |
| C | 0 | 14486 | 2 |
| D | 0 | 15580 | 2 |
| Mode SS | |||
|---|---|---|---|
| Quadrant | BADHDUFLAG | Total packets | Discarded packets |
| A | 0 | 138 | 0 |
| B | 0 | 138 | 0 |
| C | 0 | 138 | 0 |
| D | 0 | 138 | 0 |
| Mode M9 | |||
|---|---|---|---|
| Quadrant | BADHDUFLAG | Total packets | Discarded packets |
| A | 0 | 16 | 0 |
| B | 0 | 16 | 0 |
| C | 0 | 16 | 0 |
| D | 0 | 17 | 0 |
| Quadrant | Total seconds | Saturated seconds | Saturation percentage |
|---|---|---|---|
| A | 6747 | 120 | 1.778568% |
| B | 6747 | 80 | 1.185712% |
| C | 6747 | 55 | 0.815177% |
| D | 6747 | 110 | 1.630354% |
Noise dominated data is calculated using 1-second bins in cleaned event files. If a bin has >2000 counts, and if more than 50% of those come from <1% of pixels, then it is considered to be noise-dominated and hence unusable.
| Quadrant | # 1 sec bins | Bins with >0 counts | Bins with >2000 counts | High rate bins dominated by noise | Noise dominated (total time) | Noise dominated (detector-on time) | Marked lightcurve |
|---|---|---|---|---|---|---|---|
| A | 7707 | 6748 | 3 | 3 | 0.04% | 0.04% | 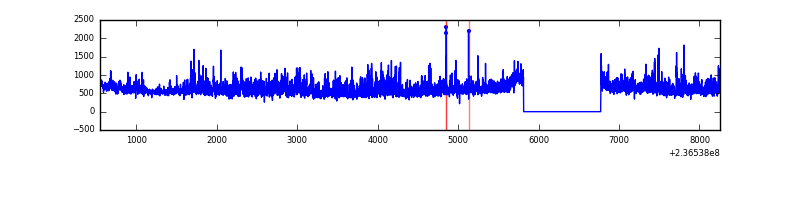 |
| B | 7707 | 6748 | 9 | 9 | 0.12% | 0.13% | 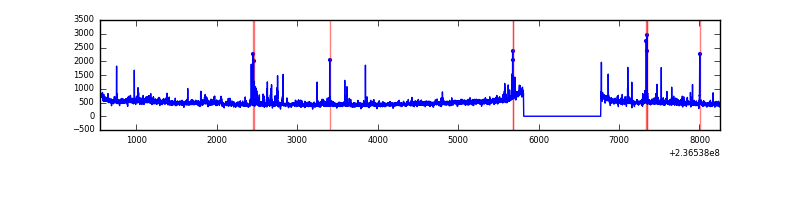 |
| C | 7707 | 6748 | 26 | 26 | 0.34% | 0.39% | 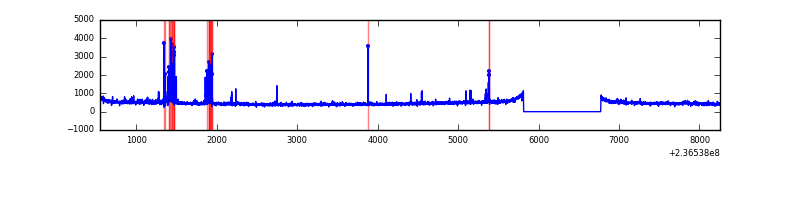 |
| D | 7707 | 6748 | 73 | 73 | 0.95% | 1.08% | 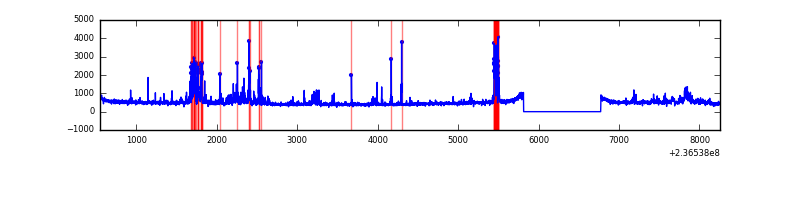 |
Top three noisy pixels from each quadrant. If the there are fewer than three noisy pixels in the level2.evt file, extra rows are filled as -1
| Pixel properties | Quadrant properties | ||||||
|---|---|---|---|---|---|---|---|
| Quadrant | DetID | PixID | Counts | Sigma | Mean | Median | Sigma |
| A | 8 | 5 | 479430 | 2851.4 | 824 | 809 | 167.9 |
| A | 1 | 162 | 268573 | 1595.21 | 824 | 809 | 167.9 |
| A | 1 | 178 | 116761 | 690.79 | 824 | 809 | 167.9 |
| B | 0 | 214 | 105810 | 669.21 | 821 | 802 | 156.9 |
| B | 4 | 80 | 58421 | 367.2 | 821 | 802 | 156.9 |
| B | 0 | 246 | 24820 | 153.07 | 821 | 802 | 156.9 |
| C | 4 | 254 | 128502 | 697.16 | 787 | 790 | 183.2 |
| C | 14 | 234 | 59855 | 322.42 | 787 | 790 | 183.2 |
| C | 9 | 68 | 38961 | 208.37 | 787 | 790 | 183.2 |
| D | 12 | 233 | 422138 | 2052.52 | 789 | 771 | 205.3 |
| D | 7 | 71 | 101321 | 489.79 | 789 | 771 | 205.3 |
| D | 8 | 195 | 39995 | 191.06 | 789 | 771 | 205.3 |
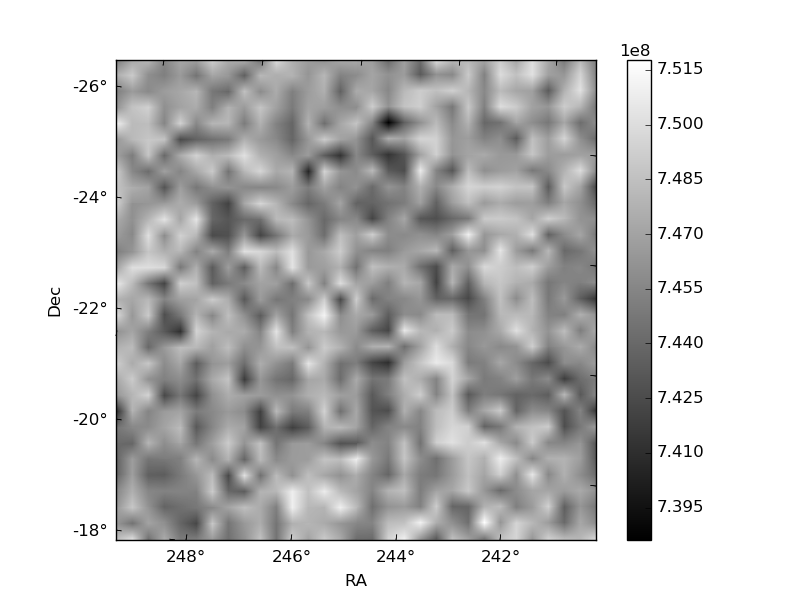
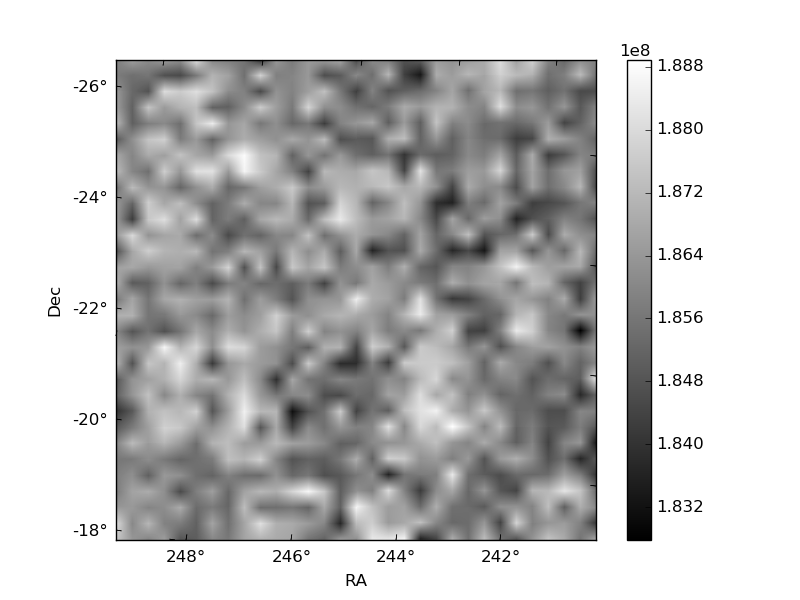
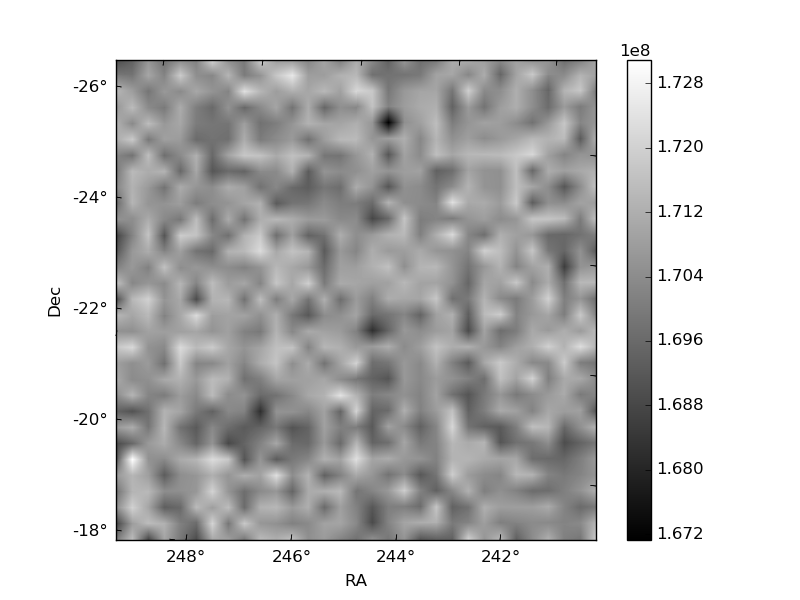
Histogram calculated using DETX and DETY for each event in the final _common_clean file
| Quadrant A | 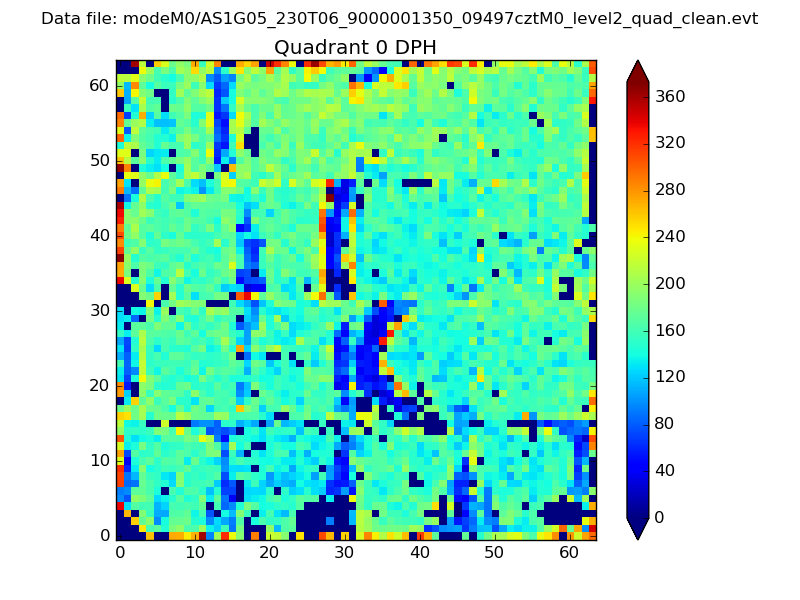 |
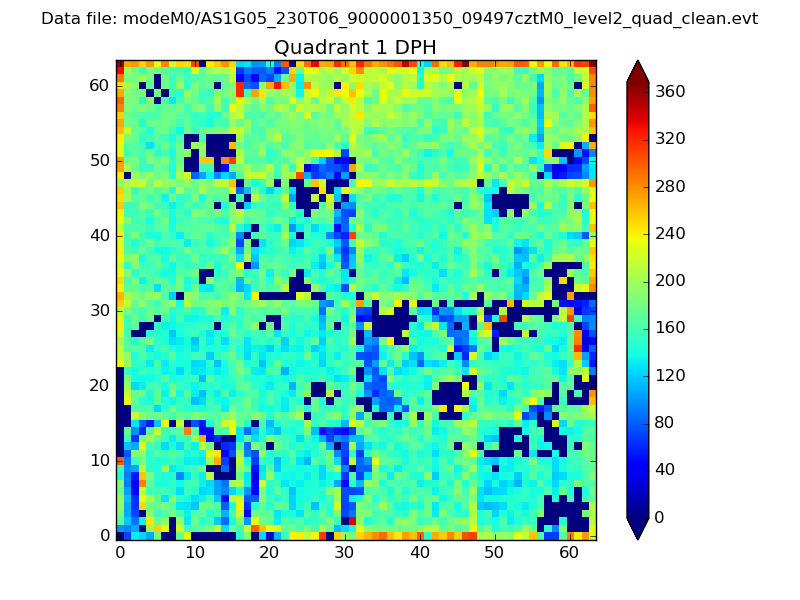 |
Quadrant B |
|---|---|---|---|
| Quadrant D | 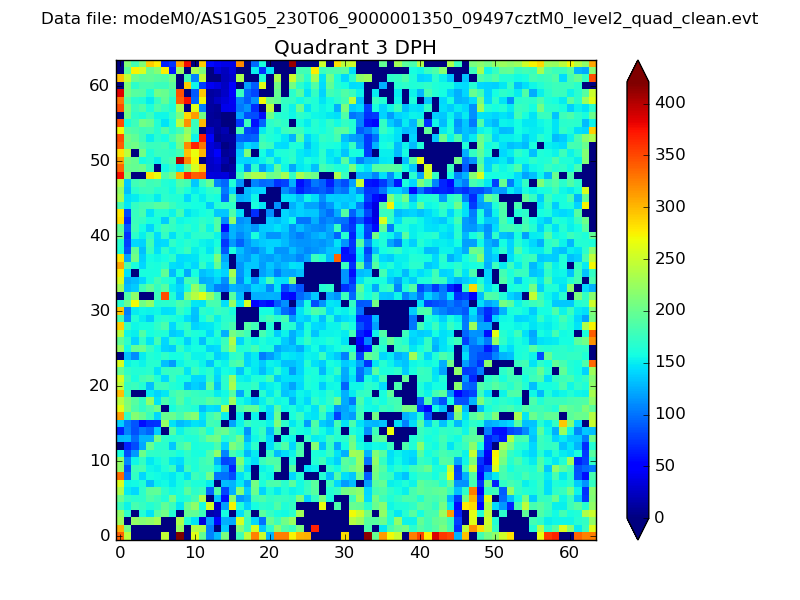 |
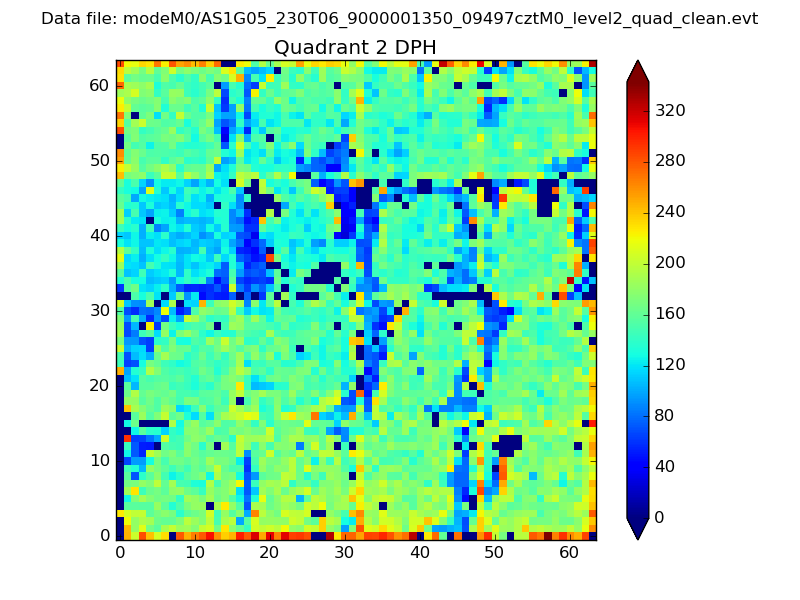 |
Quadrant C |
| Plot type | Count rate plots | Images |
|---|---|---|
| Comparison with Poisson distribution Blue bars denote a histogram of data divided into 1 sec bins. Red curve is a Poisson curve with rate = median count rate of data. |
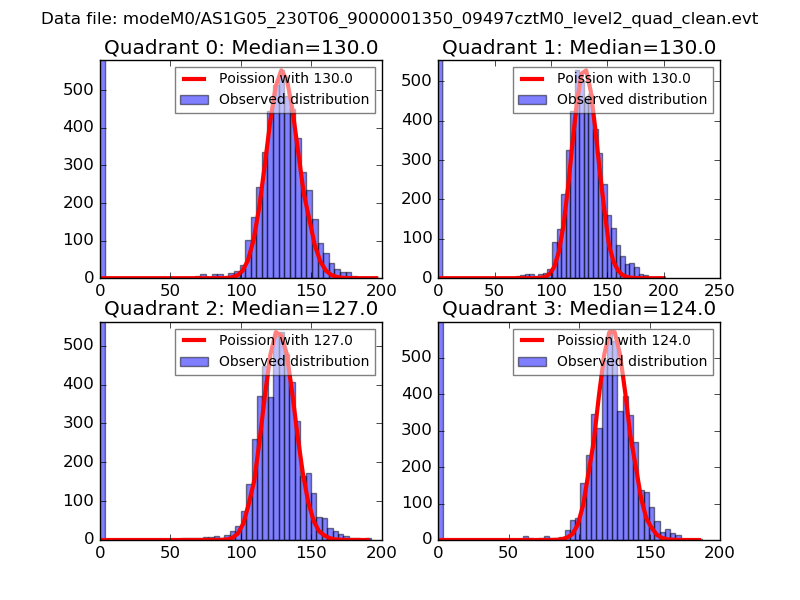 |
 |
| Quadrant-wise count rates Data is divided into 100 sec bins |
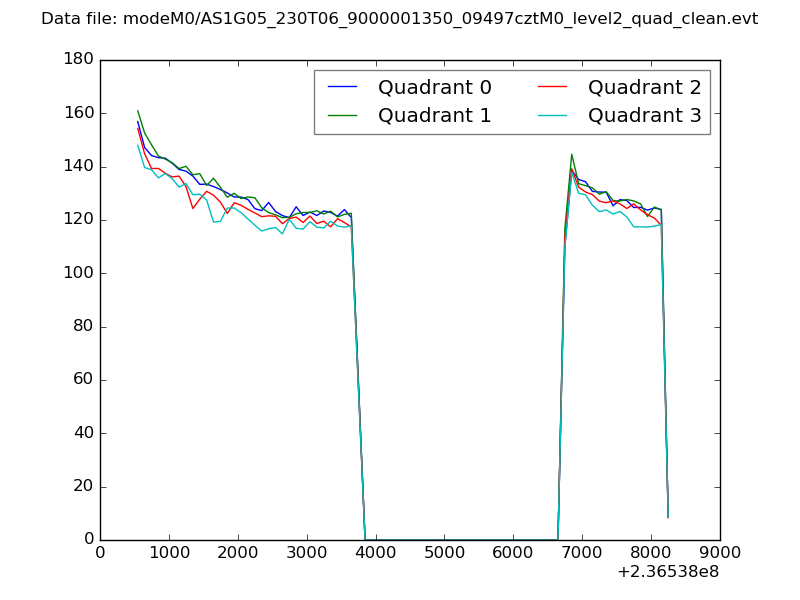 |
|
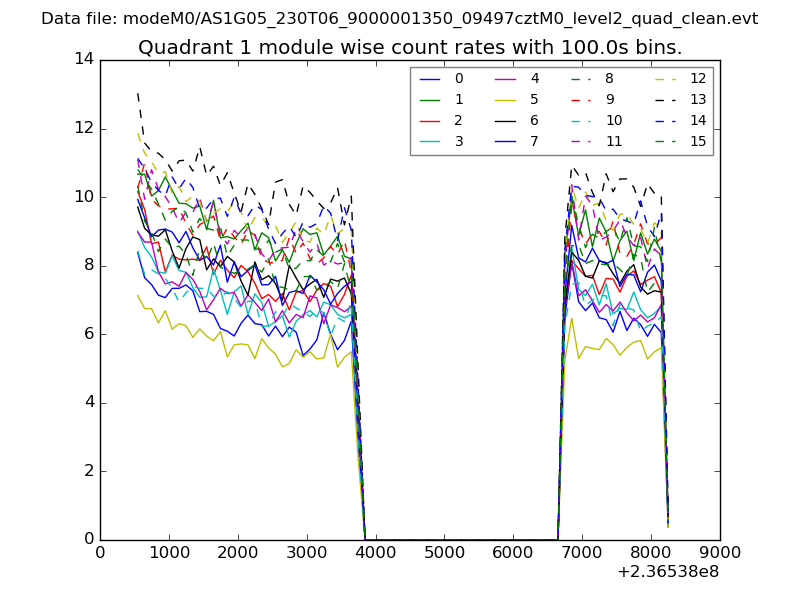
| Module-wise count rates for Quadrant A Data is divided into 100 sec bins |
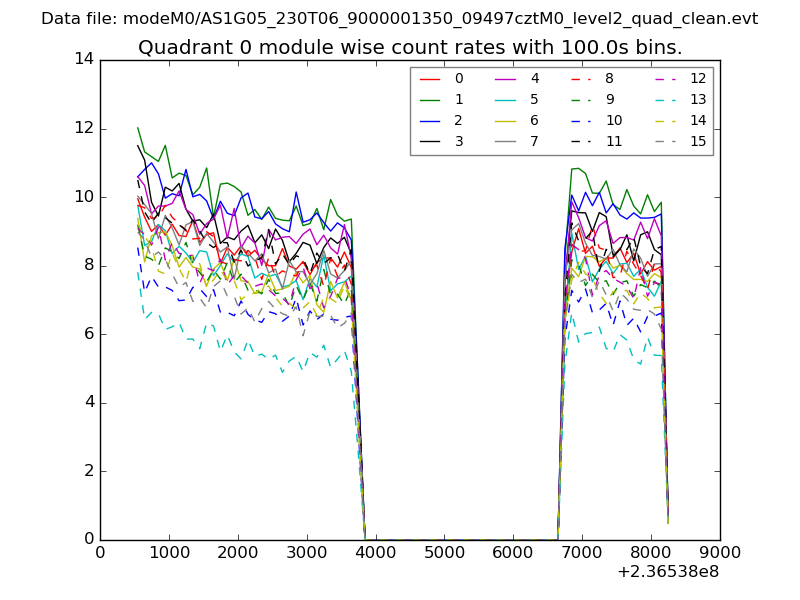 |
 |
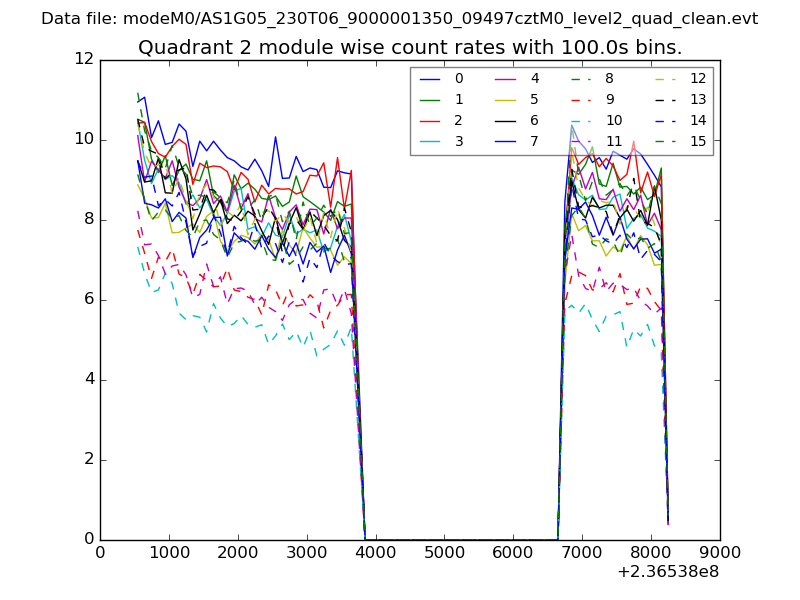
| Module-wise count rates for Quadrant B Data is divided into 100 sec bins |
 |
 |
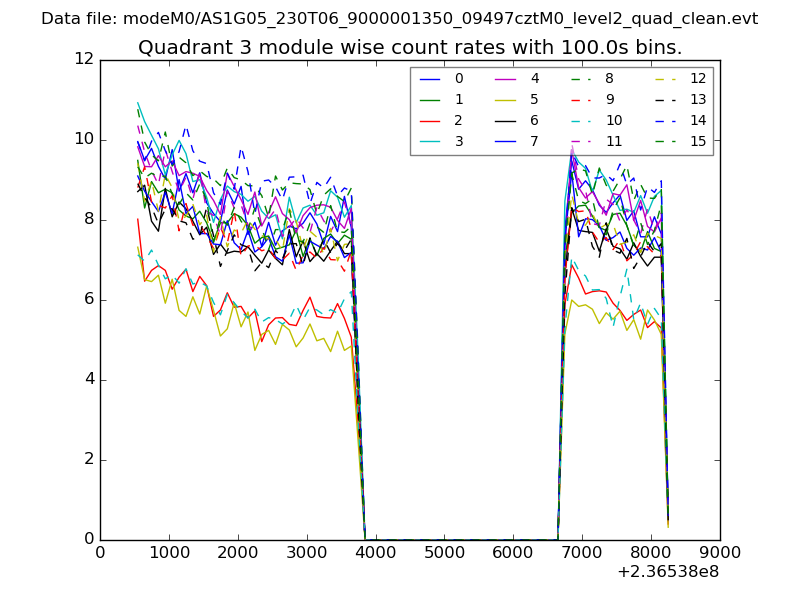
| Module-wise count rates for Quadrant C Data is divided into 100 sec bins |
 |
 |
| Module-wise count rates for Quadrant D Data is divided into 100 sec bins |
 |
 |
| Parameter | Plot |
|---|---|
| CZT HV Monitor | 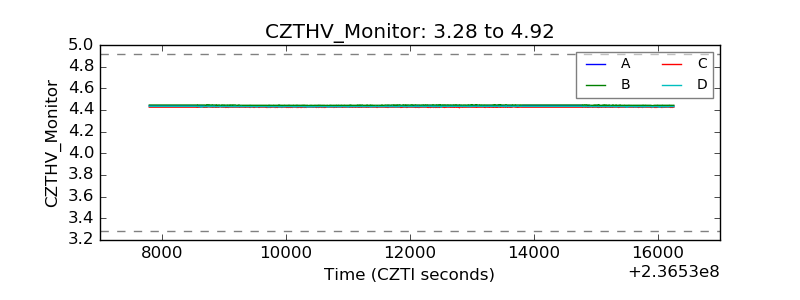 |
| D_VDD | 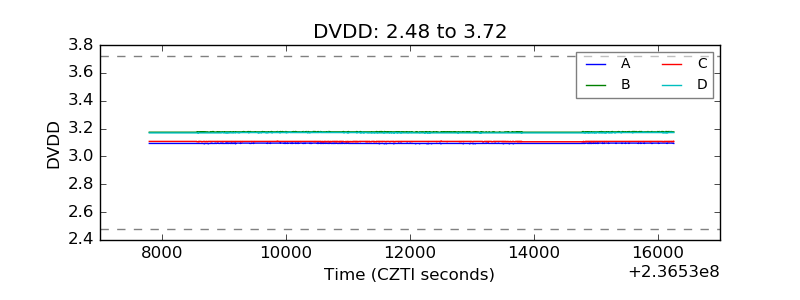 |
| Temperature 1 | 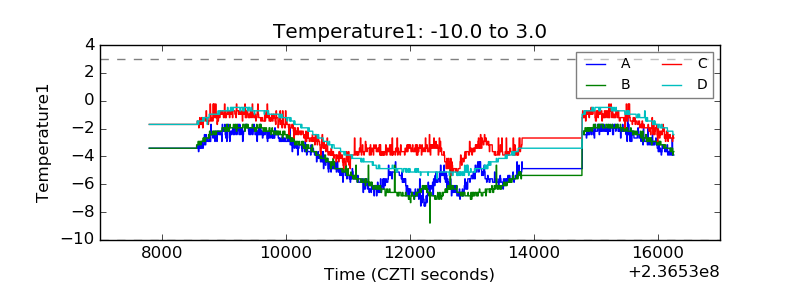 |
| Veto HV Monitor | 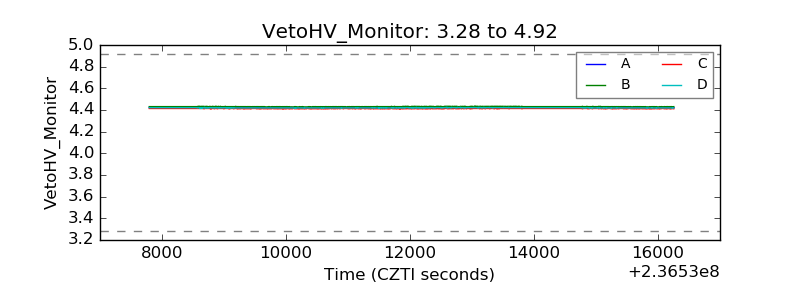 |
| Veto LLD | 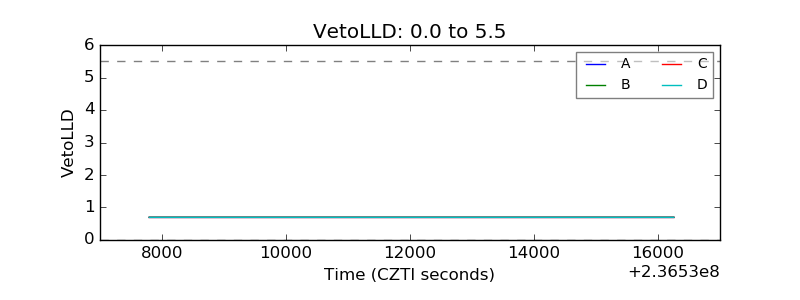 |
| Alpha Counter | 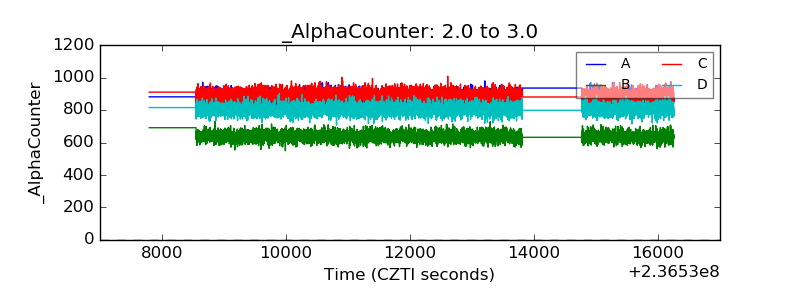 |
| _CPM_Rate | 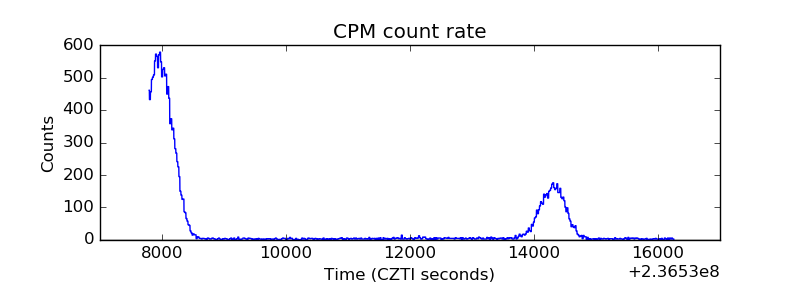 |
| CZT Counter | 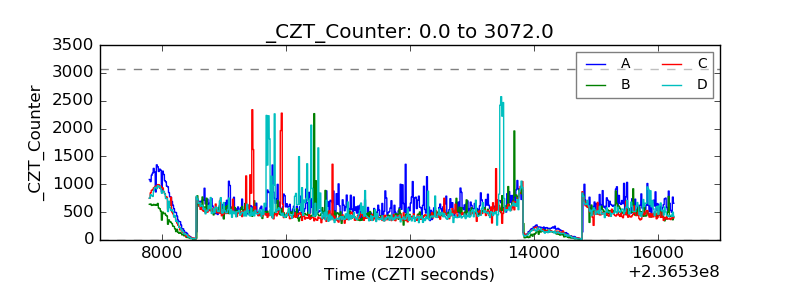 |
| +2.5 Volts monitor | 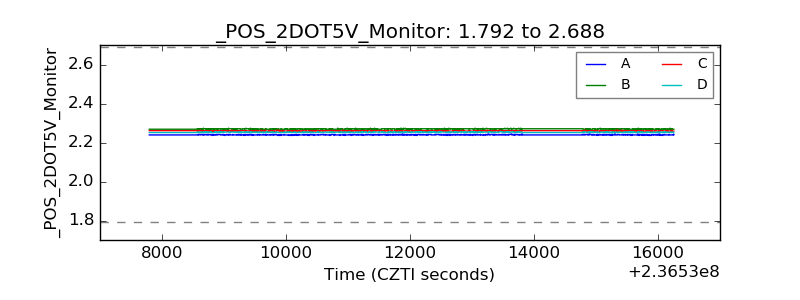 |
| +5 Volts monitor |  |
| _ROLL_ROT | 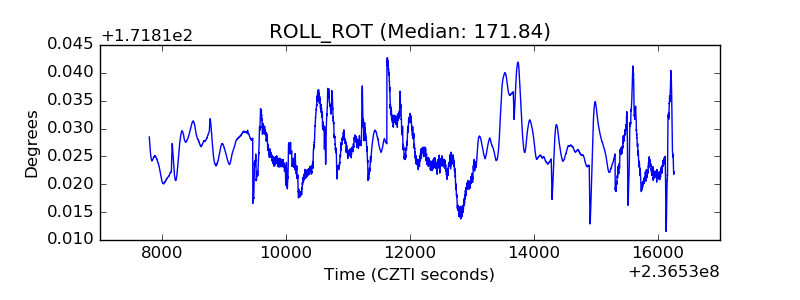 |
| _Roll_DEC | 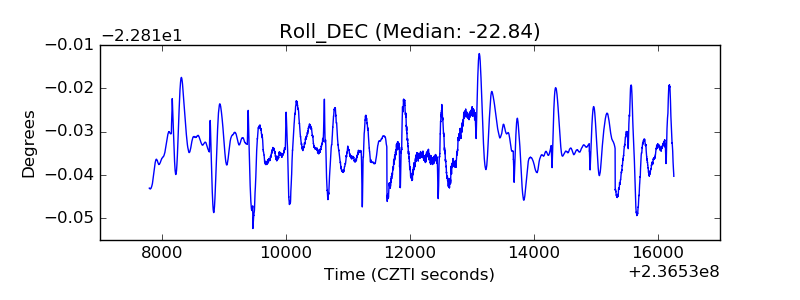 |
| _Roll_RA | 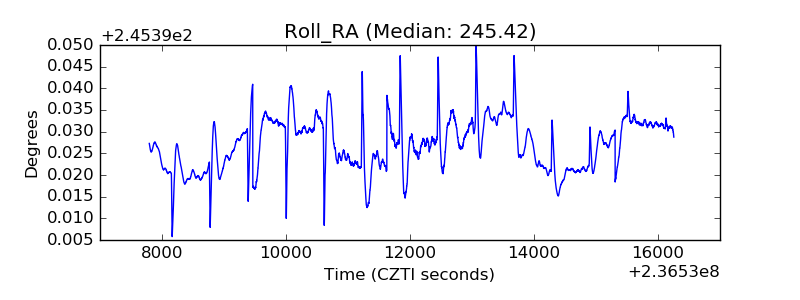 |
| Veto Counter | 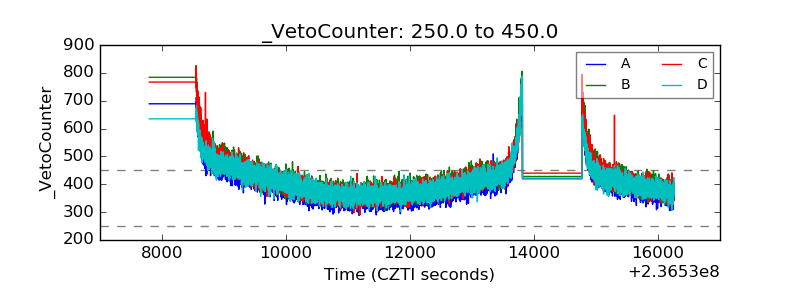 |