| Param | Original file | Final file |
|---|---|---|
| Filename | modeM0/AS1G05_230T06_9000001350_09499cztM0_level2.evt | modeM0/AS1G05_230T06_9000001350_09499cztM0_level2_quad_clean.evt |
| Size (bytes) | 589,055,040 | 106,640,640 |
| Size | 561.8 MB | 101.7 MB |
| Events in quadrant A | 5,126,250 | 677,160 |
| Events in quadrant B | 3,750,300 | 694,234 |
| Events in quadrant C | 3,969,324 | 675,097 |
| Events in quadrant D | 4,472,846 | 648,649 |
| Mode M0 | |||
|---|---|---|---|
| Quadrant | BADHDUFLAG | Total packets | Discarded packets |
| A | 0 | 20596 | 94 |
| B | 0 | 16352 | 67 |
| C | 0 | 17275 | 55 |
| D | 0 | 18894 | 113 |
| Mode SS | |||
|---|---|---|---|
| Quadrant | BADHDUFLAG | Total packets | Discarded packets |
| A | 0 | 158 | 0 |
| B | 0 | 158 | 0 |
| C | 0 | 158 | 0 |
| D | 0 | 158 | 0 |
| Mode M9 | |||
|---|---|---|---|
| Quadrant | BADHDUFLAG | Total packets | Discarded packets |
| A | 0 | 6 | 0 |
| B | 0 | 6 | 0 |
| C | 0 | 6 | 0 |
| D | 0 | 6 | 0 |
| Quadrant | Total seconds | Saturated seconds | Saturation percentage |
|---|---|---|---|
| A | 7677 | 229 | 2.982936% |
| B | 7680 | 95 | 1.236979% |
| C | 7687 | 144 | 1.873293% |
| D | 7674 | 229 | 2.984102% |
Noise dominated data is calculated using 1-second bins in cleaned event files. If a bin has >2000 counts, and if more than 50% of those come from <1% of pixels, then it is considered to be noise-dominated and hence unusable.
| Quadrant | # 1 sec bins | Bins with >0 counts | Bins with >2000 counts | High rate bins dominated by noise | Noise dominated (total time) | Noise dominated (detector-on time) | Marked lightcurve |
|---|---|---|---|---|---|---|---|
| A | 8389 | 7713 | 11 | 11 | 0.13% | 0.14% | 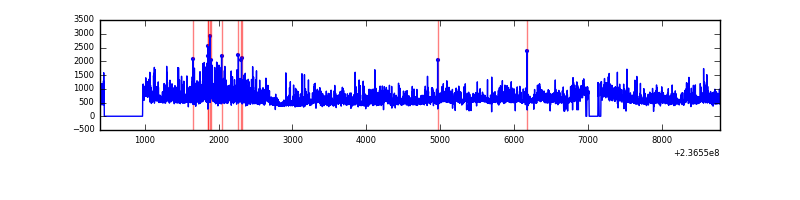 |
| B | 8389 | 7713 | 1 | 1 | 0.01% | 0.01% | 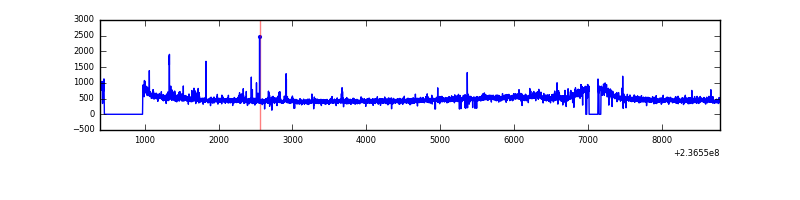 |
| C | 8389 | 7713 | 52 | 52 | 0.62% | 0.67% | 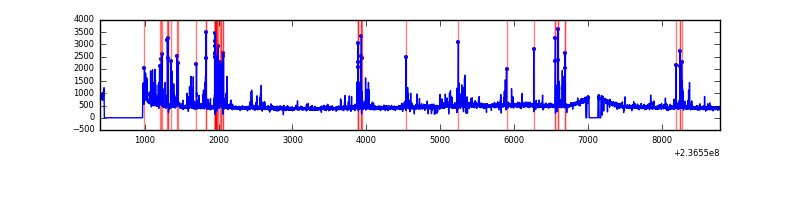 |
| D | 8389 | 7711 | 154 | 154 | 1.84% | 2.00% | 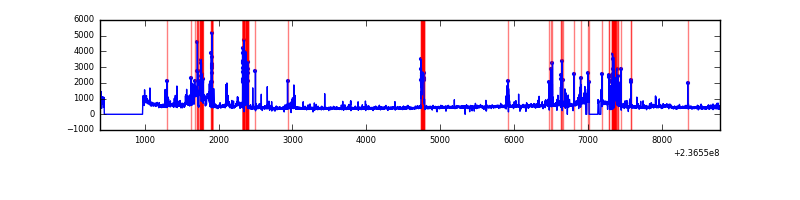 |
Top three noisy pixels from each quadrant. If the there are fewer than three noisy pixels in the level2.evt file, extra rows are filled as -1
| Pixel properties | Quadrant properties | ||||||
|---|---|---|---|---|---|---|---|
| Quadrant | DetID | PixID | Counts | Sigma | Mean | Median | Sigma |
| A | 8 | 5 | 798422 | 4230.91 | 916 | 896 | 188.5 |
| A | 1 | 162 | 323578 | 1711.84 | 916 | 896 | 188.5 |
| A | 1 | 178 | 161424 | 851.61 | 916 | 896 | 188.5 |
| B | 0 | 214 | 59064 | 325.9 | 924 | 901 | 178.5 |
| B | 0 | 219 | 38856 | 212.67 | 924 | 901 | 178.5 |
| B | 4 | 80 | 24908 | 134.51 | 924 | 901 | 178.5 |
| C | 4 | 254 | 495718 | 2412.4 | 881 | 883 | 205.1 |
| C | 9 | 68 | 19261 | 89.6 | 881 | 883 | 205.1 |
| C | 12 | 4 | 9509 | 42.05 | 881 | 883 | 205.1 |
| D | 7 | 71 | 579732 | 2510.37 | 874 | 851 | 230.6 |
| D | 8 | 195 | 181047 | 781.44 | 874 | 851 | 230.6 |
| D | 1 | 52 | 135179 | 582.53 | 874 | 851 | 230.6 |
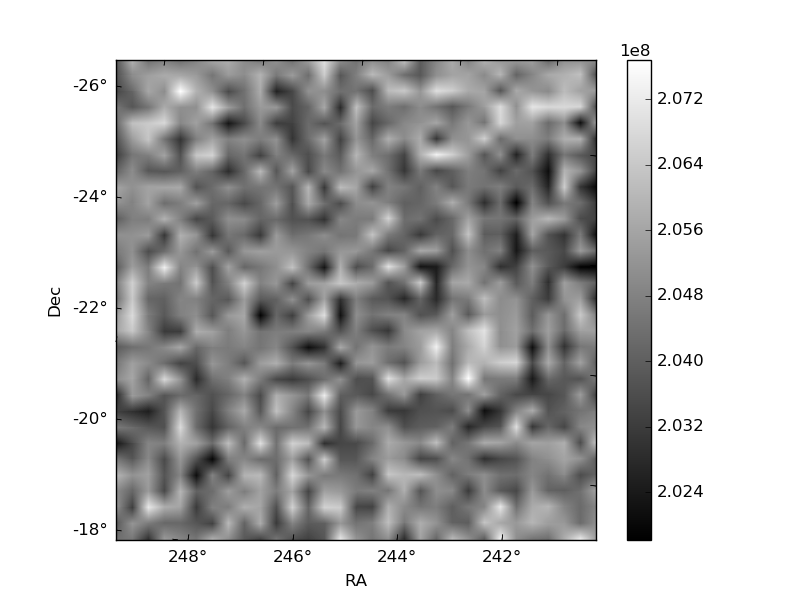
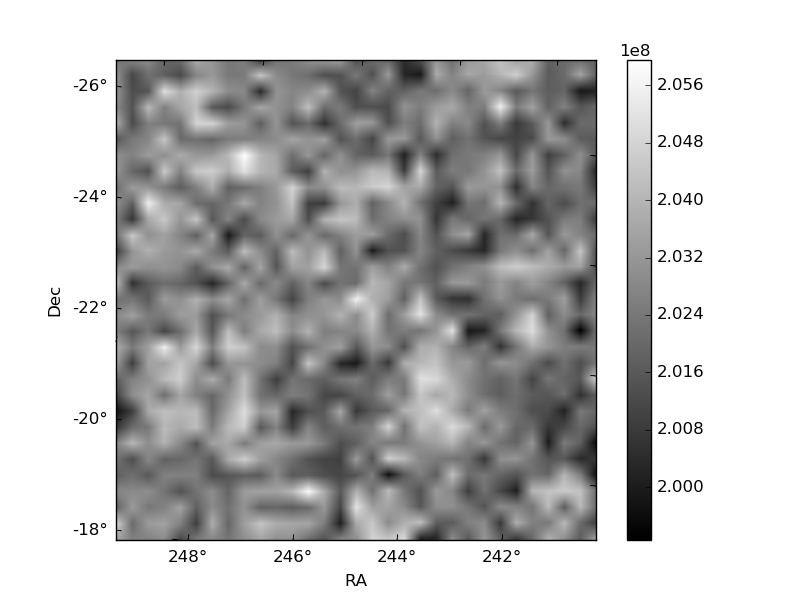
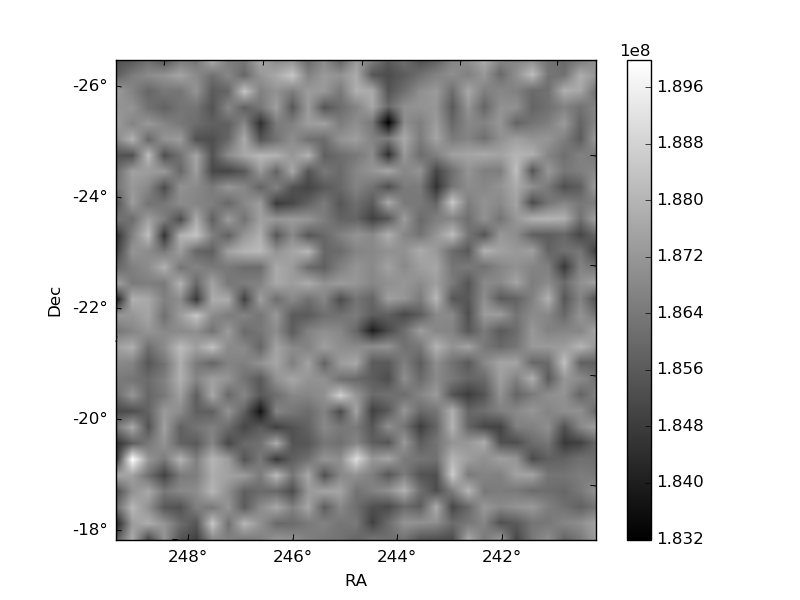
Histogram calculated using DETX and DETY for each event in the final _common_clean file
| Quadrant A | 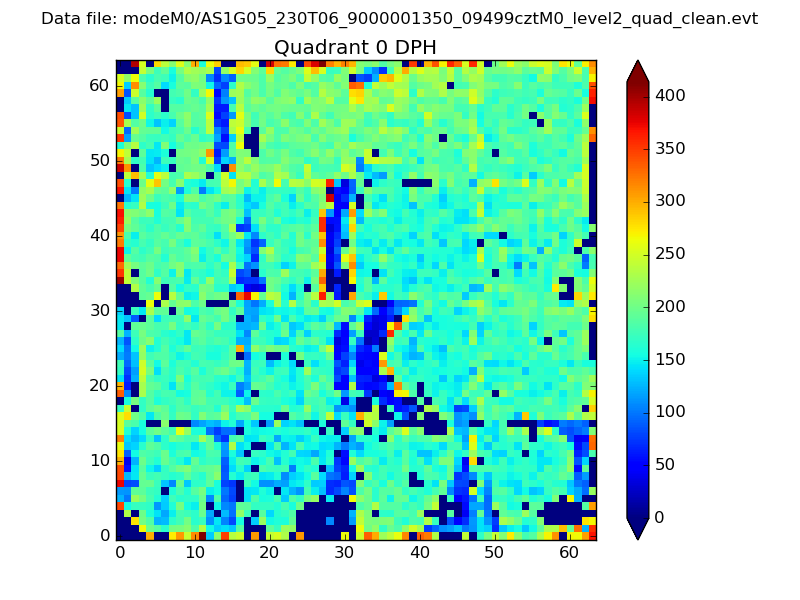 |
 |
Quadrant B |
|---|---|---|---|
| Quadrant D |  |
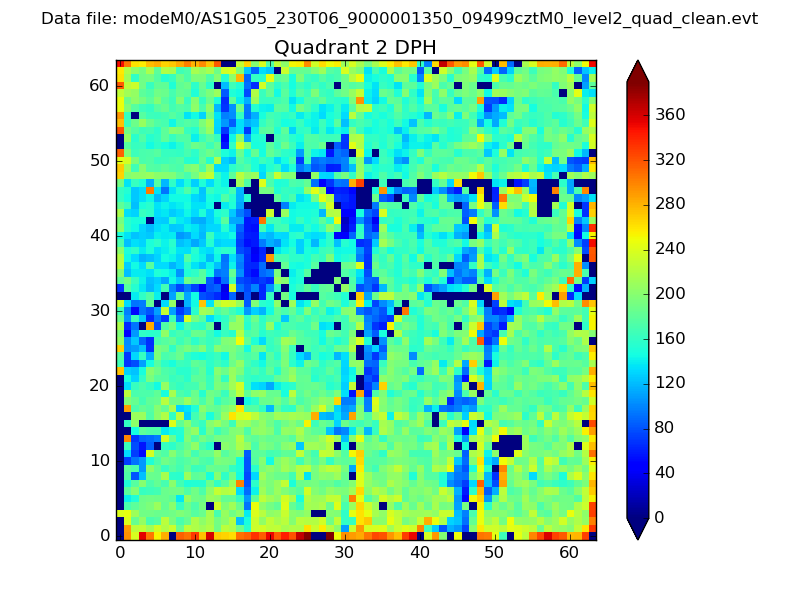 |
Quadrant C |
| Plot type | Count rate plots | Images |
|---|---|---|
| Comparison with Poisson distribution Blue bars denote a histogram of data divided into 1 sec bins. Red curve is a Poisson curve with rate = median count rate of data. |
 |
 |
| Quadrant-wise count rates Data is divided into 100 sec bins |
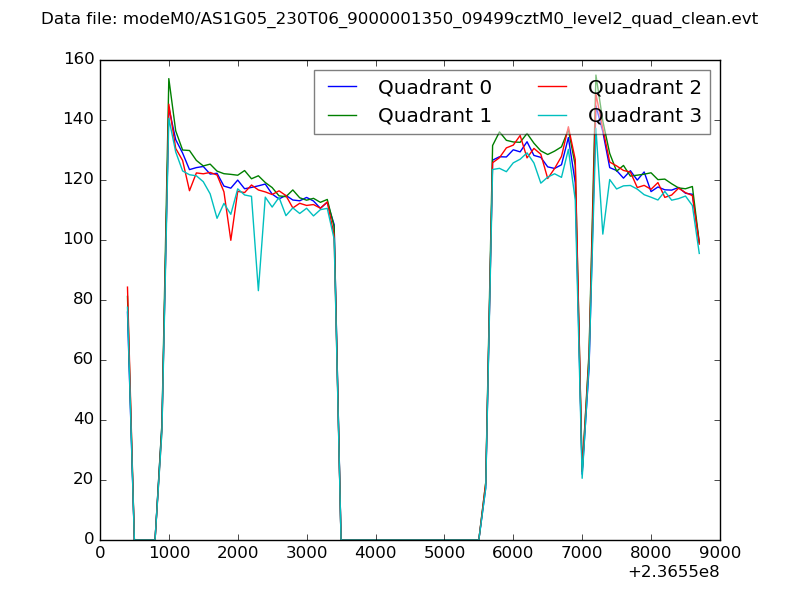 |
|
| Module-wise count rates for Quadrant A Data is divided into 100 sec bins |
 |
 |
| Module-wise count rates for Quadrant B Data is divided into 100 sec bins |
 |
 |
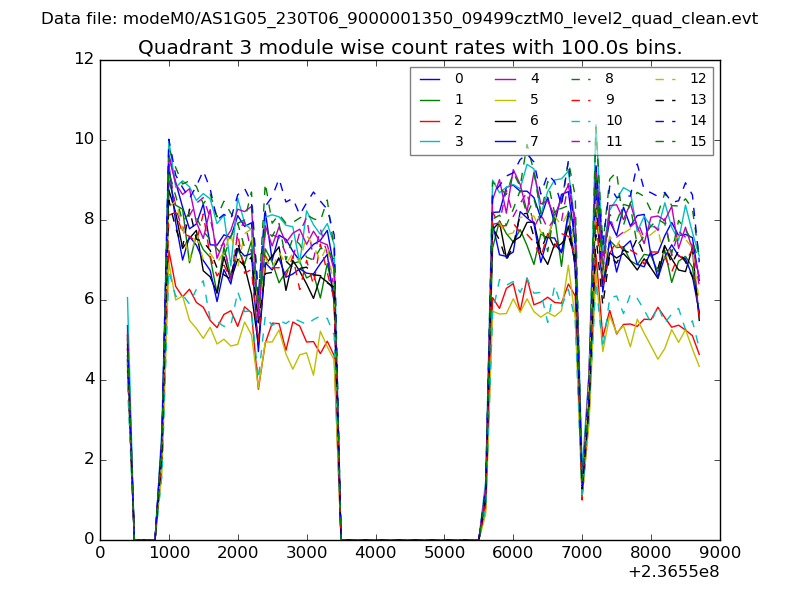
| Module-wise count rates for Quadrant C Data is divided into 100 sec bins |
 |
 |
| Module-wise count rates for Quadrant D Data is divided into 100 sec bins |
 |
 |
| Parameter | Plot |
|---|---|
| CZT HV Monitor |  |
| D_VDD | 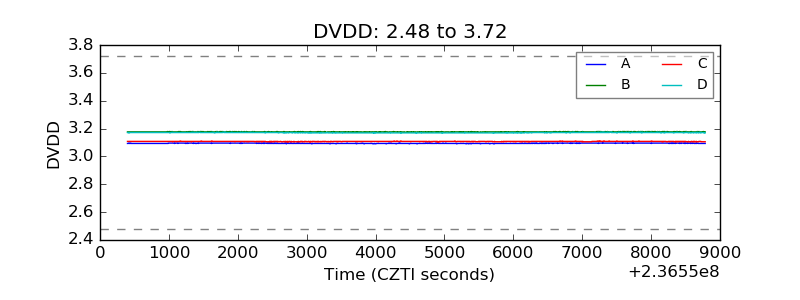 |
| Temperature 1 | 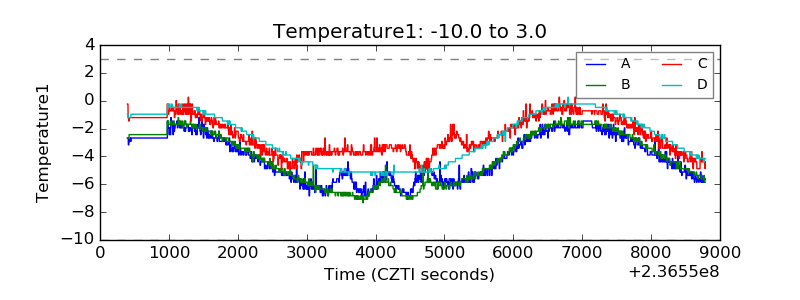 |
| Veto HV Monitor | 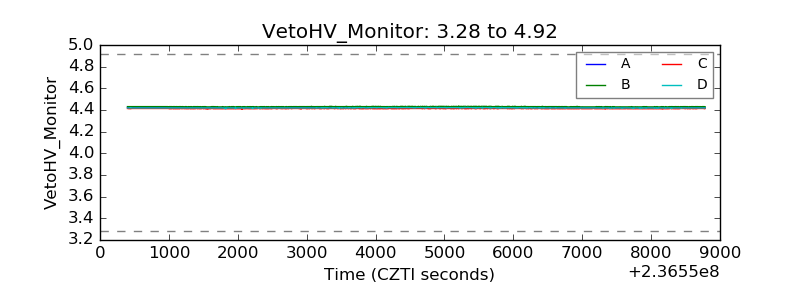 |
| Veto LLD | 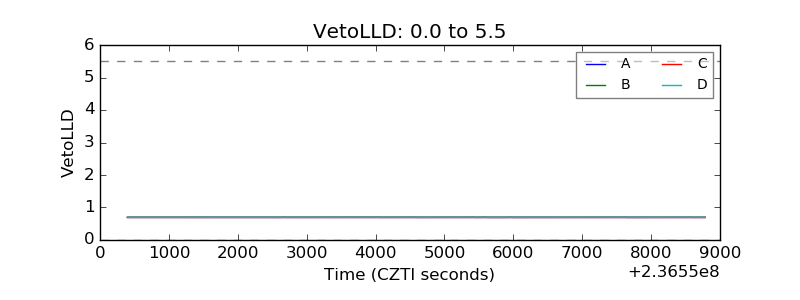 |
| Alpha Counter | 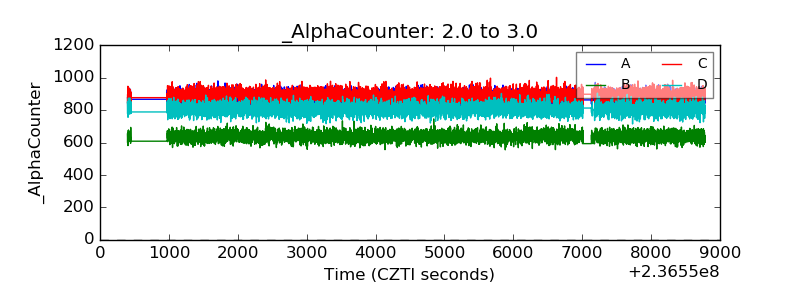 |
| _CPM_Rate | 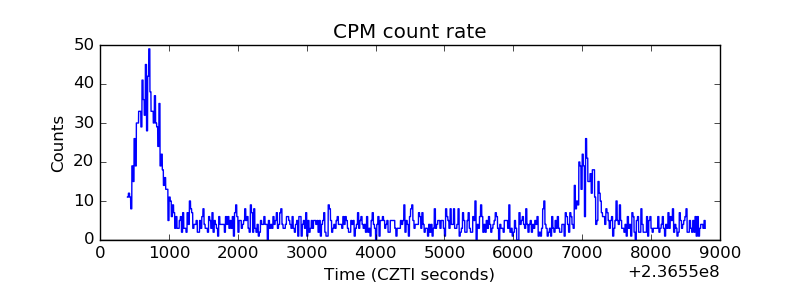 |
| CZT Counter | 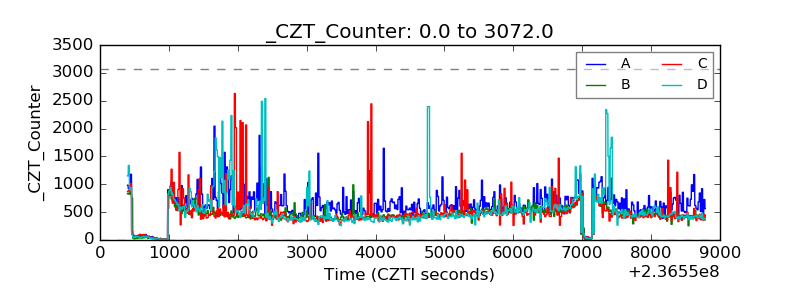 |
| +2.5 Volts monitor |  |
| +5 Volts monitor |  |
| _ROLL_ROT | 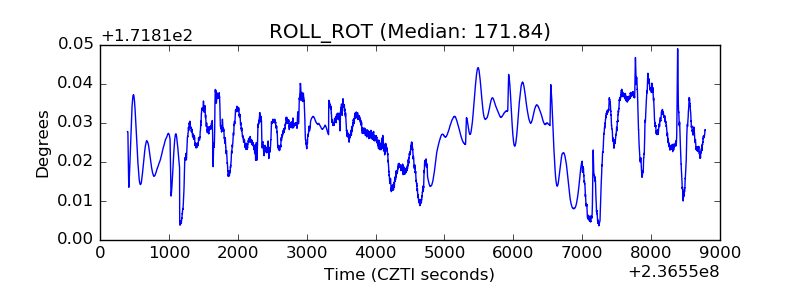 |
| _Roll_DEC | 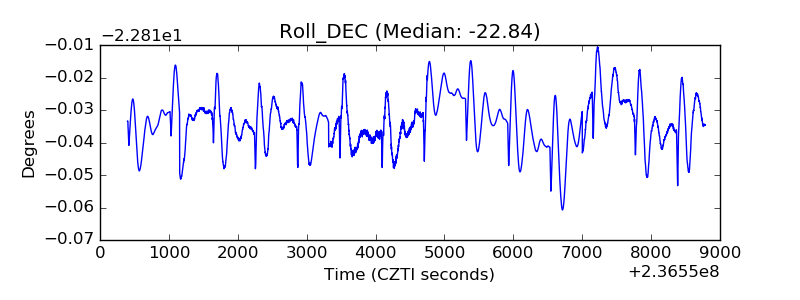 |
| _Roll_RA | 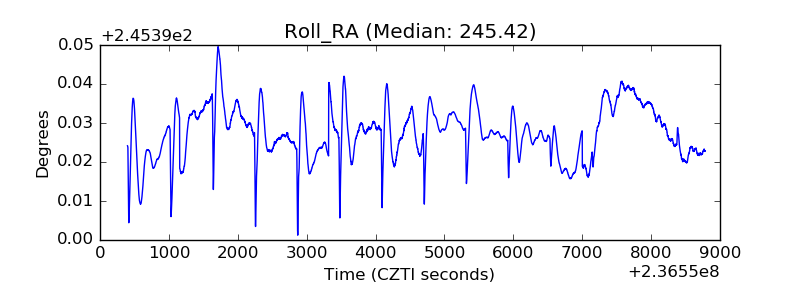 |
| Veto Counter |  |