| Param | Original file | Final file |
|---|---|---|
| Filename | modeM0/AS1G05_230T06_9000001350_09504cztM0_level2.evt | modeM0/AS1G05_230T06_9000001350_09504cztM0_level2_quad_clean.evt |
| Size (bytes) | 1,835,337,600 | 259,061,760 |
| Size | 1.7 GB | 247.1 MB |
| Events in quadrant A | 16,262,631 | 1,568,553 |
| Events in quadrant B | 10,869,761 | 1,614,240 |
| Events in quadrant C | 11,719,753 | 1,571,211 |
| Events in quadrant D | 15,164,427 | 1,492,589 |
| Mode M0 | |||
|---|---|---|---|
| Quadrant | BADHDUFLAG | Total packets | Discarded packets |
| A | 0 | 65165 | 652 |
| B | 0 | 48048 | 336 |
| C | 0 | 51466 | 360 |
| D | 0 | 62017 | 573 |
| Mode SS | |||
|---|---|---|---|
| Quadrant | BADHDUFLAG | Total packets | Discarded packets |
| A | 0 | 478 | 4 |
| B | 0 | 478 | 2 |
| C | 0 | 478 | 4 |
| D | 0 | 478 | 4 |
| Mode M9 | |||
|---|---|---|---|
| Quadrant | BADHDUFLAG | Total packets | Discarded packets |
| A | 0 | 28 | 0 |
| B | 0 | 28 | 0 |
| C | 0 | 28 | 0 |
| D | 0 | 28 | 0 |
| Quadrant | Total seconds | Saturated seconds | Saturation percentage |
|---|---|---|---|
| A | 23187 | 432 | 1.863113% |
| B | 23253 | 149 | 0.640778% |
| C | 23240 | 436 | 1.876076% |
| D | 23219 | 867 | 3.734011% |
Noise dominated data is calculated using 1-second bins in cleaned event files. If a bin has >2000 counts, and if more than 50% of those come from <1% of pixels, then it is considered to be noise-dominated and hence unusable.
| Quadrant | # 1 sec bins | Bins with >0 counts | Bins with >2000 counts | High rate bins dominated by noise | Noise dominated (total time) | Noise dominated (detector-on time) | Marked lightcurve |
|---|---|---|---|---|---|---|---|
| A | 26287 | 23390 | 62 | 62 | 0.24% | 0.27% | 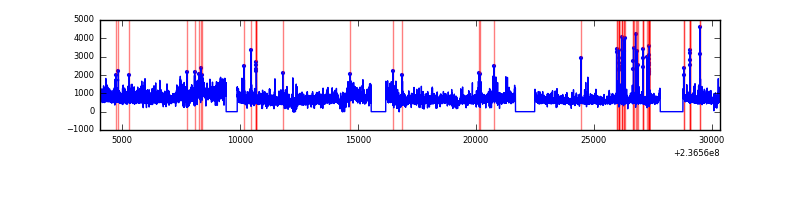 |
| B | 26287 | 23402 | 7 | 7 | 0.03% | 0.03% | 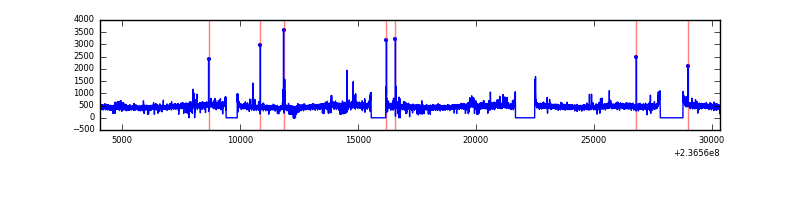 |
| C | 26287 | 23395 | 288 | 288 | 1.10% | 1.23% | 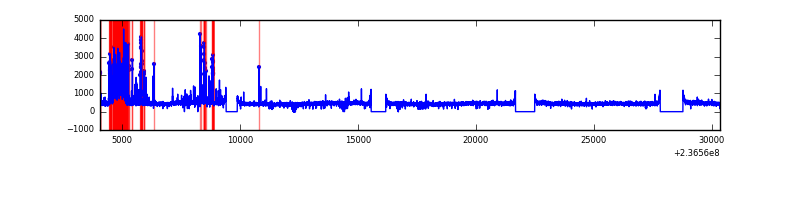 |
| D | 26287 | 23393 | 757 | 757 | 2.88% | 3.24% | 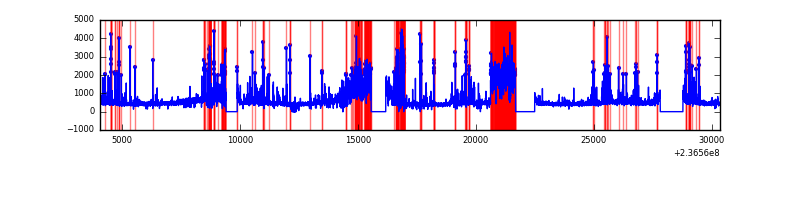 |
Top three noisy pixels from each quadrant. If the there are fewer than three noisy pixels in the level2.evt file, extra rows are filled as -1
| Pixel properties | Quadrant properties | ||||||
|---|---|---|---|---|---|---|---|
| Quadrant | DetID | PixID | Counts | Sigma | Mean | Median | Sigma |
| A | 8 | 5 | 3904569 | 7176.39 | 2683 | 2628 | 543.7 |
| A | 1 | 162 | 887104 | 1626.71 | 2683 | 2628 | 543.7 |
| A | 1 | 178 | 401898 | 734.33 | 2683 | 2628 | 543.7 |
| B | 0 | 214 | 105311 | 198.0 | 2722 | 2653 | 518.5 |
| B | 0 | 187 | 59310 | 109.27 | 2722 | 2653 | 518.5 |
| B | 12 | 111 | 56979 | 104.78 | 2722 | 2653 | 518.5 |
| C | 4 | 254 | 1470812 | 2443.65 | 2605 | 2621 | 600.8 |
| C | 9 | 68 | 35313 | 54.41 | 2605 | 2621 | 600.8 |
| C | 13 | 61 | 19913 | 28.78 | 2605 | 2621 | 600.8 |
| D | 2 | 16 | 2949941 | 4518.69 | 2563 | 2497 | 652.3 |
| D | 1 | 52 | 1120395 | 1713.83 | 2563 | 2497 | 652.3 |
| D | 8 | 195 | 490642 | 748.37 | 2563 | 2497 | 652.3 |
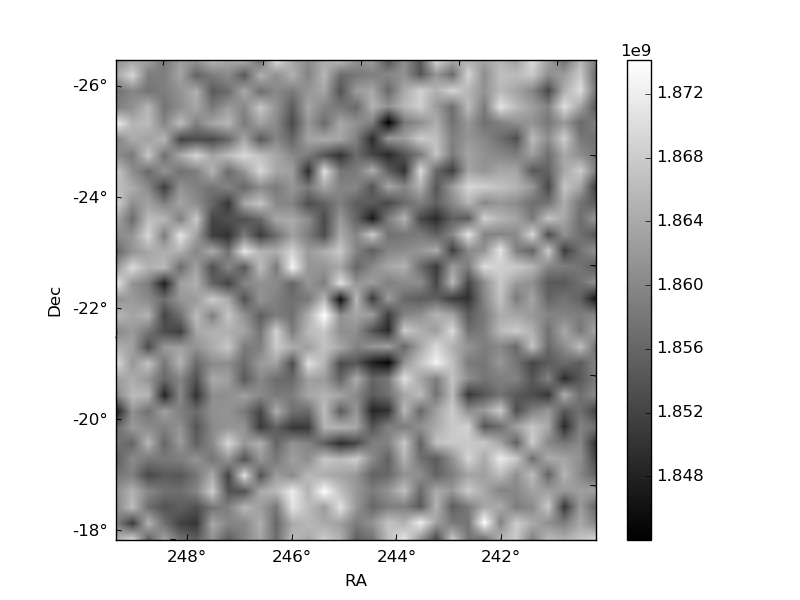
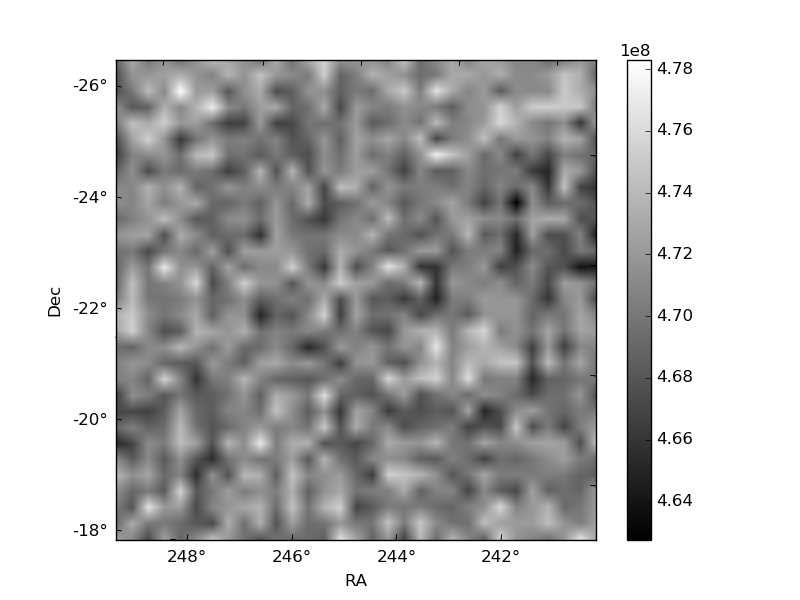
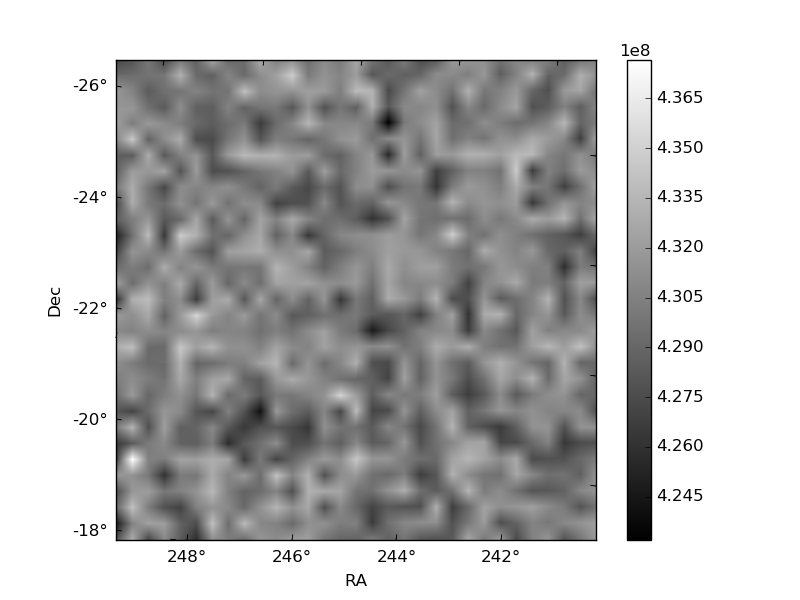
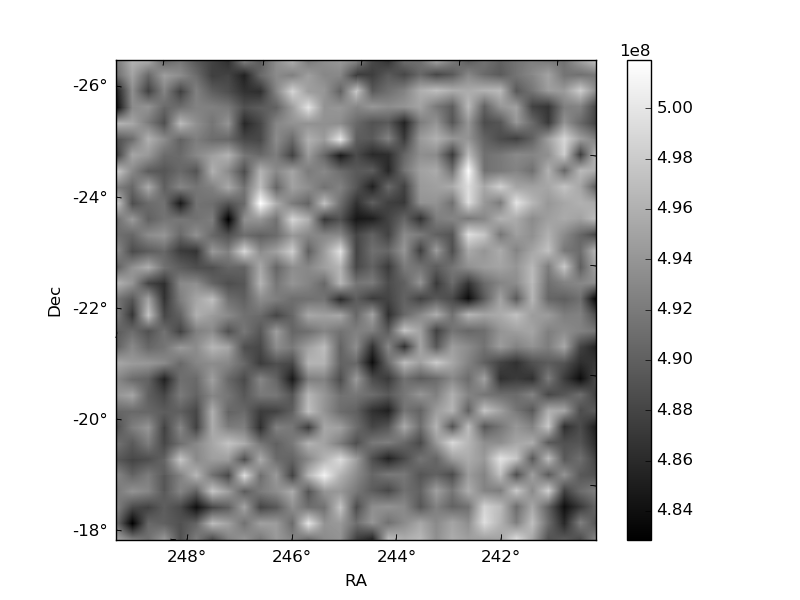
Histogram calculated using DETX and DETY for each event in the final _common_clean file
| Quadrant A | 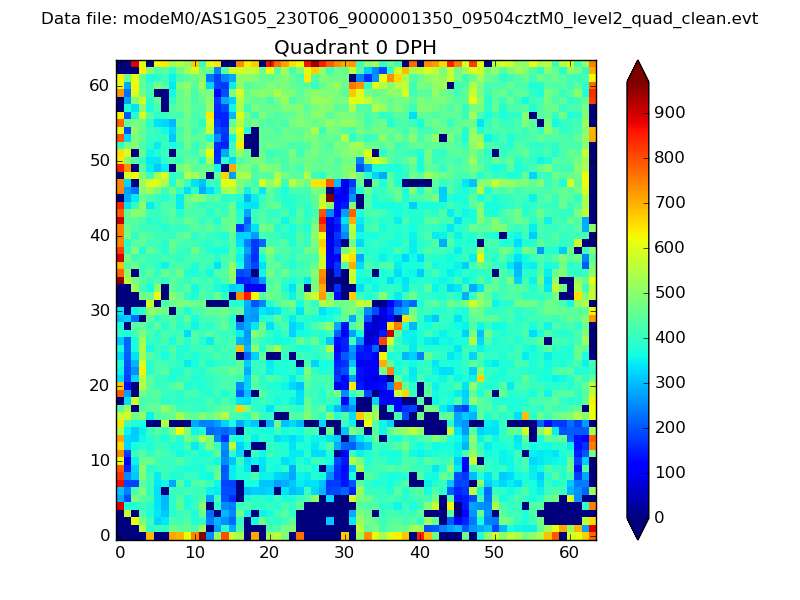 |
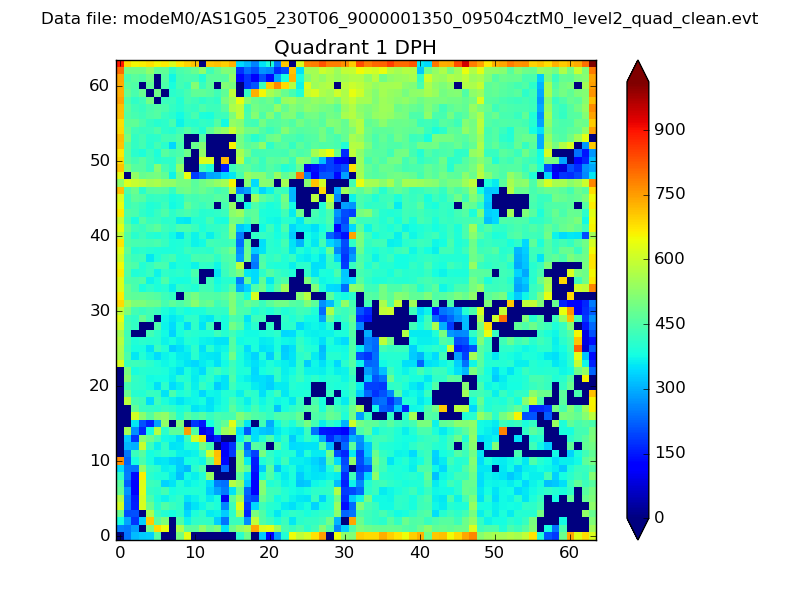 |
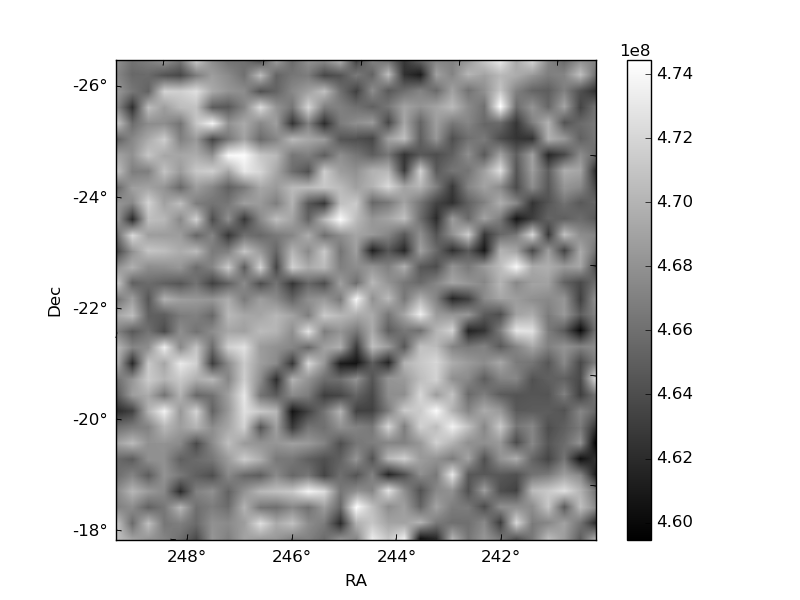
Quadrant B |
|---|---|---|---|
| Quadrant D | 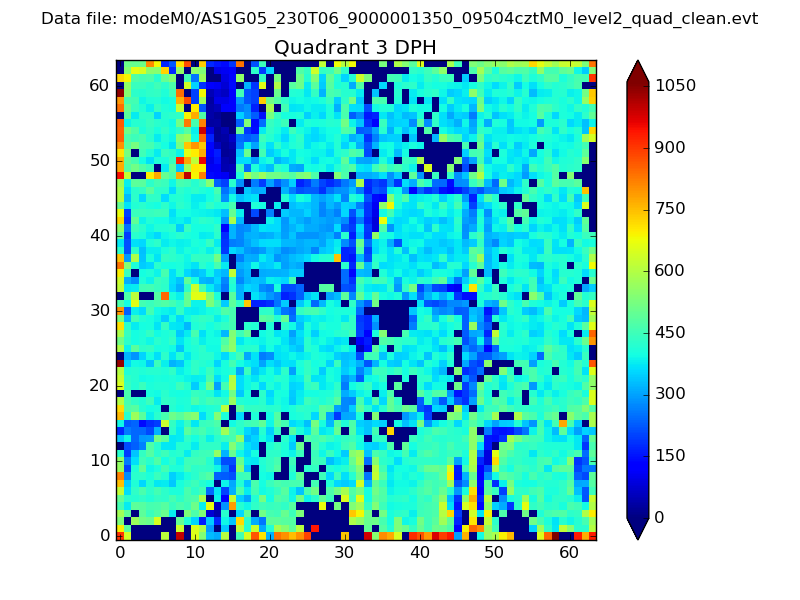 |
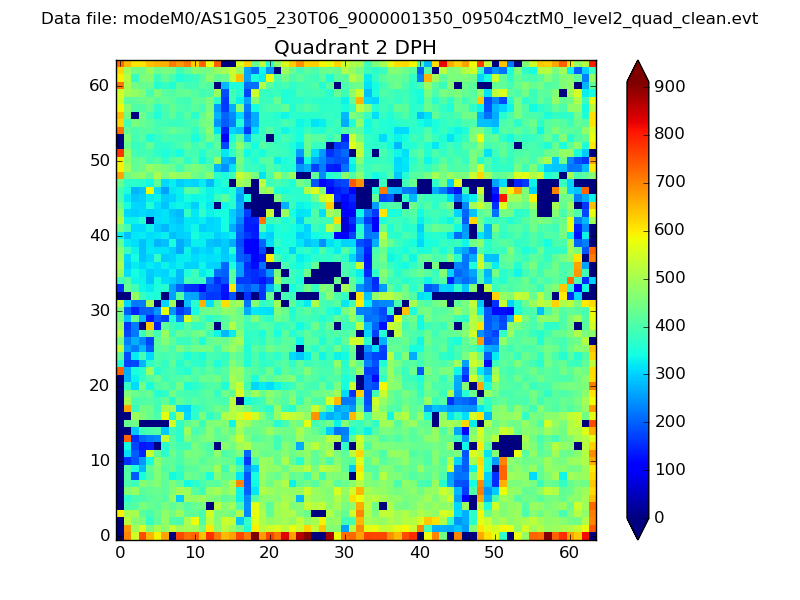 |
Quadrant C |
| Plot type | Count rate plots | Images |
|---|---|---|
| Comparison with Poisson distribution Blue bars denote a histogram of data divided into 1 sec bins. Red curve is a Poisson curve with rate = median count rate of data. |
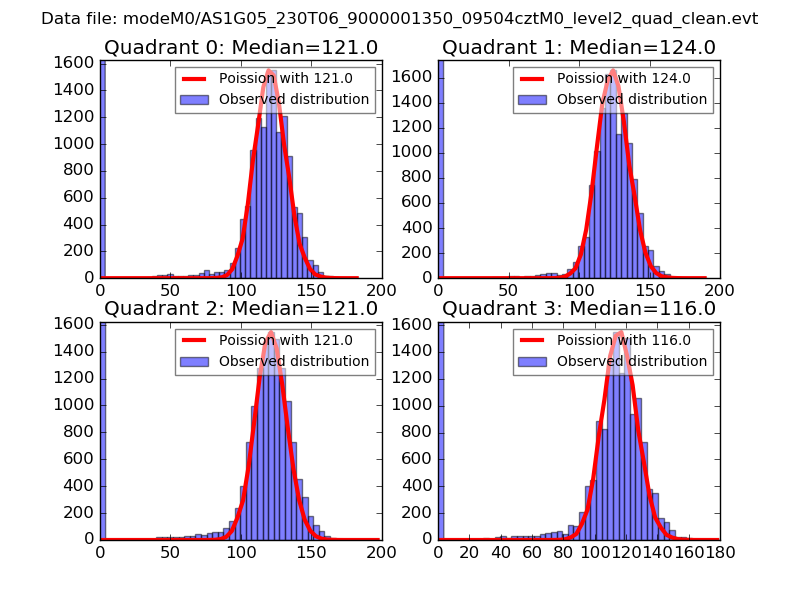 |
 |
| Quadrant-wise count rates Data is divided into 100 sec bins |
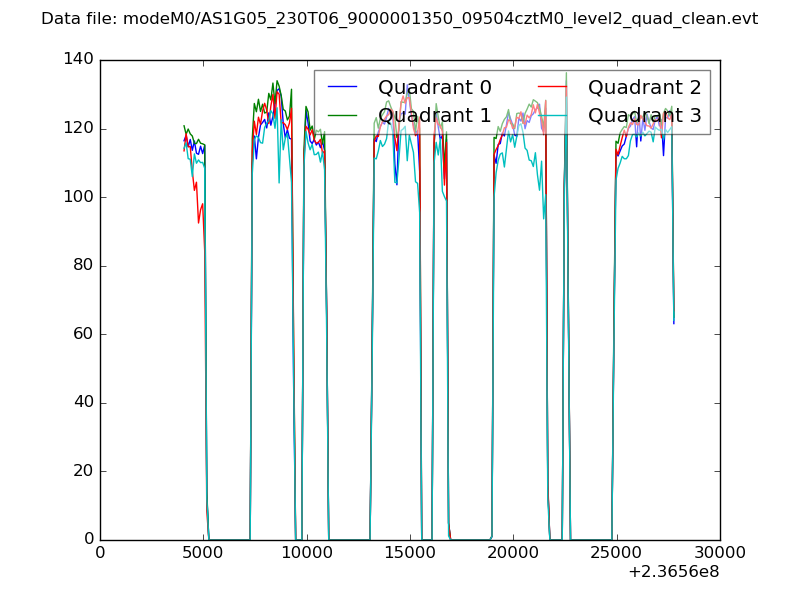 |
|
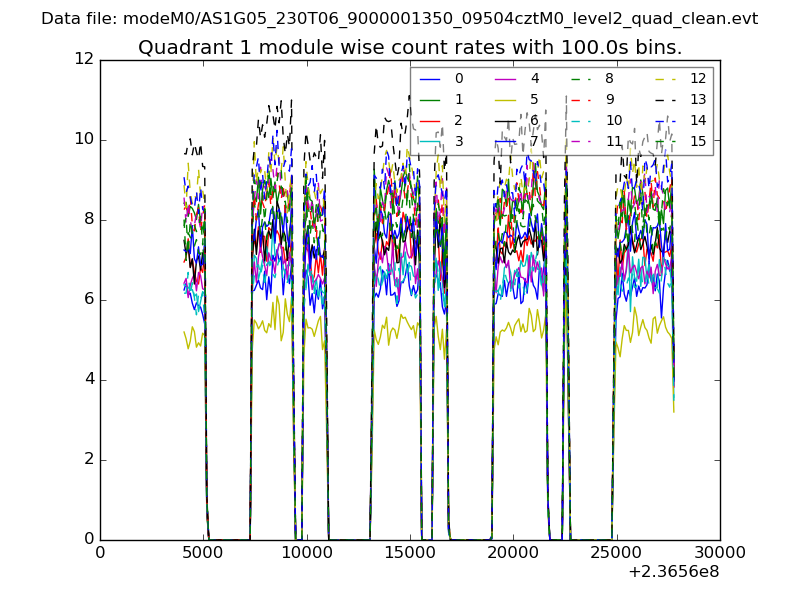
| Module-wise count rates for Quadrant A Data is divided into 100 sec bins |
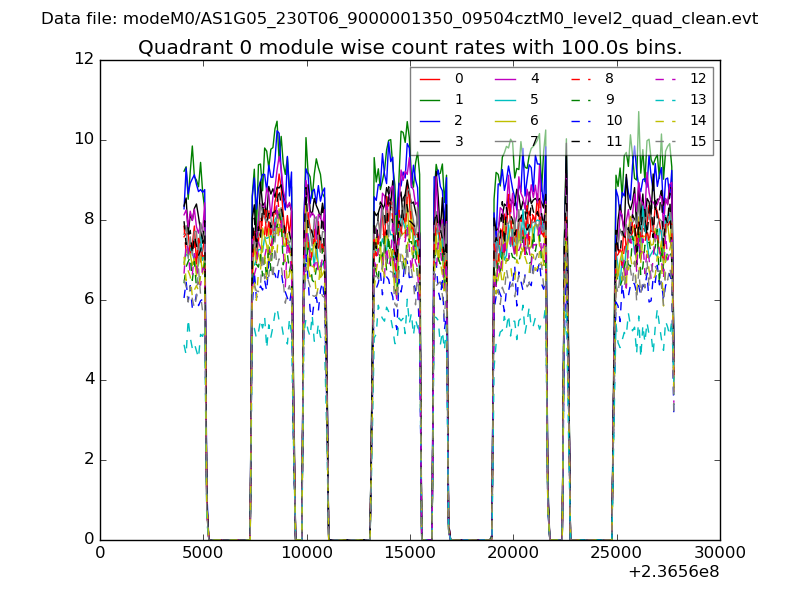 |
 |
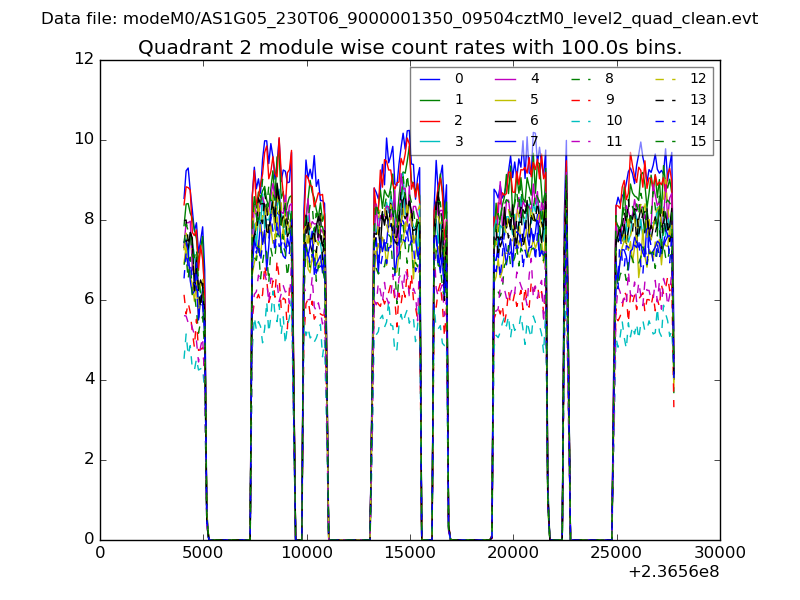
| Module-wise count rates for Quadrant B Data is divided into 100 sec bins |
 |
 |
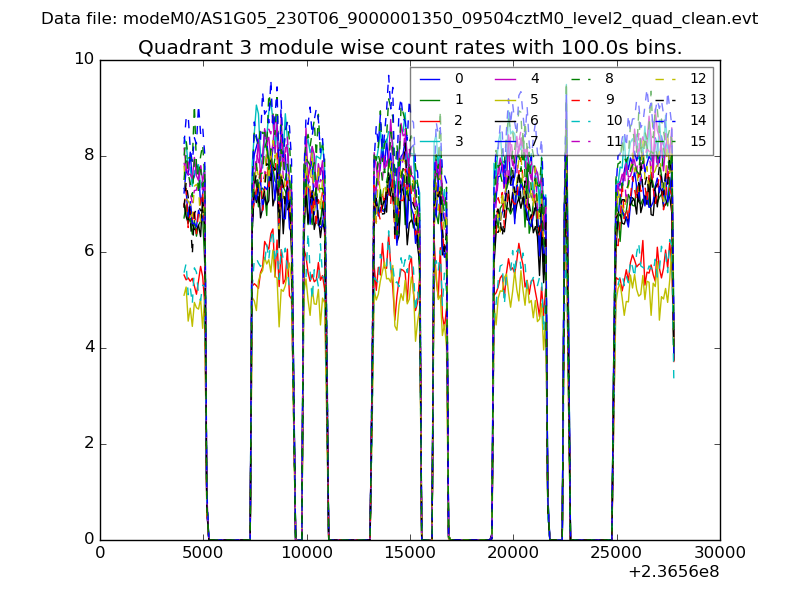
| Module-wise count rates for Quadrant C Data is divided into 100 sec bins |
 |
 |
| Module-wise count rates for Quadrant D Data is divided into 100 sec bins |
 |
 |
| Parameter | Plot |
|---|---|
| CZT HV Monitor | 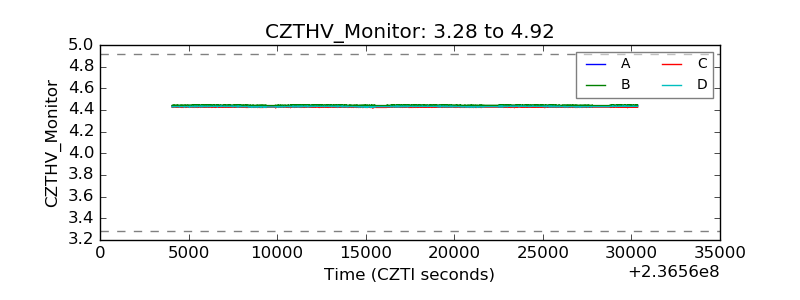 |
| D_VDD | 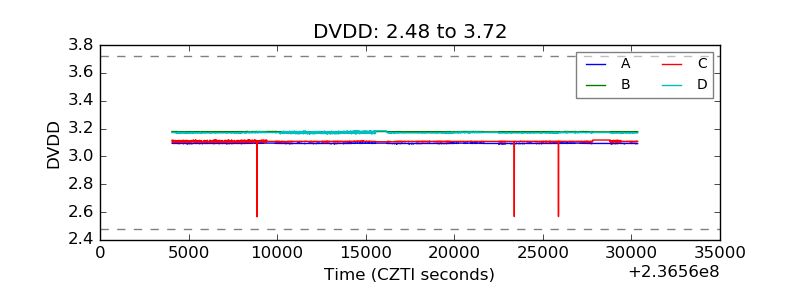 |
| Temperature 1 | 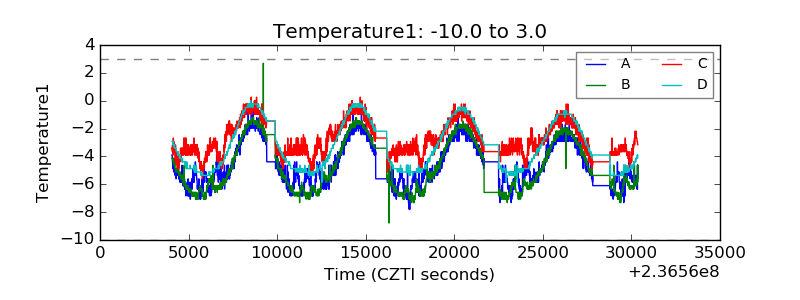 |
| Veto HV Monitor | 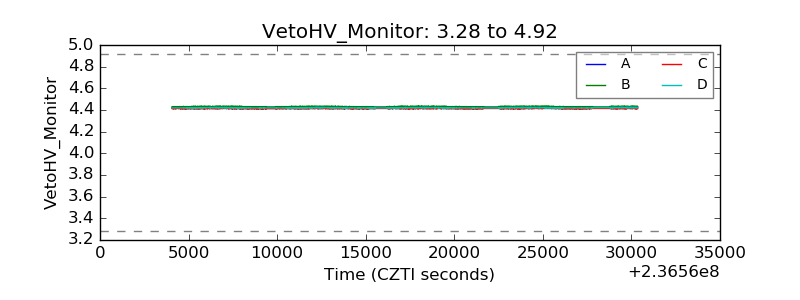 |
| Veto LLD | 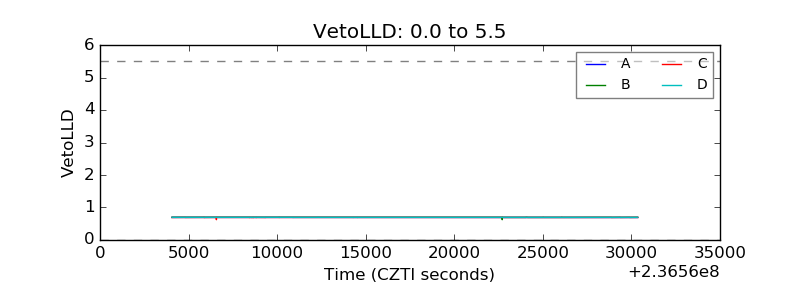 |
| Alpha Counter | 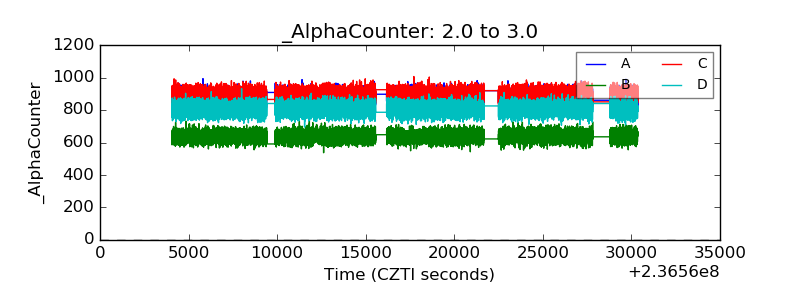 |
| _CPM_Rate | 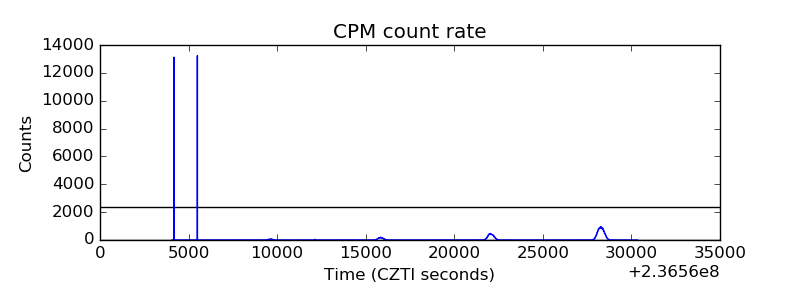 |
| CZT Counter | 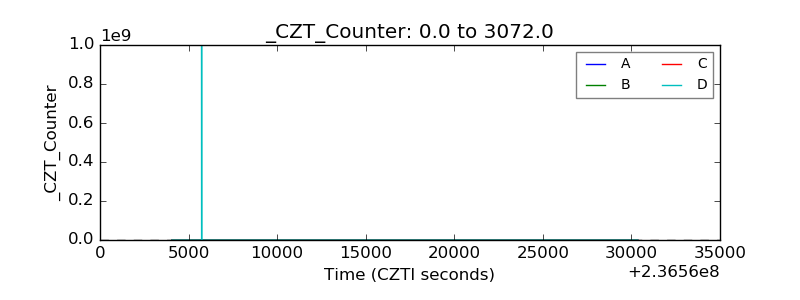 |
| +2.5 Volts monitor |  |
| +5 Volts monitor |  |
| _ROLL_ROT | 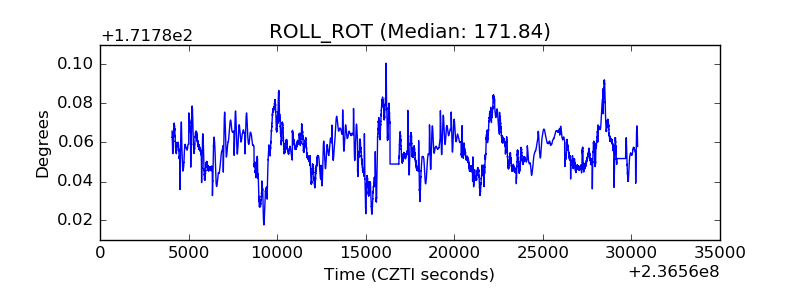 |
| _Roll_DEC | 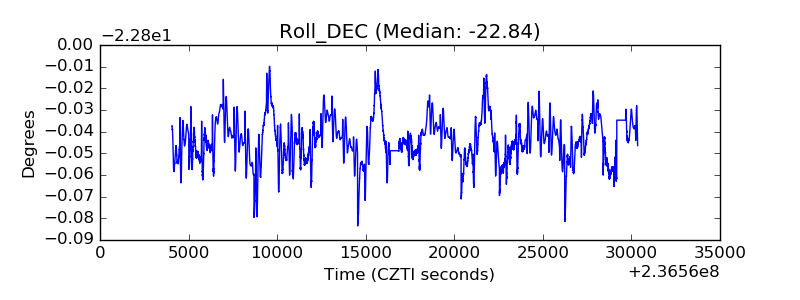 |
| _Roll_RA | 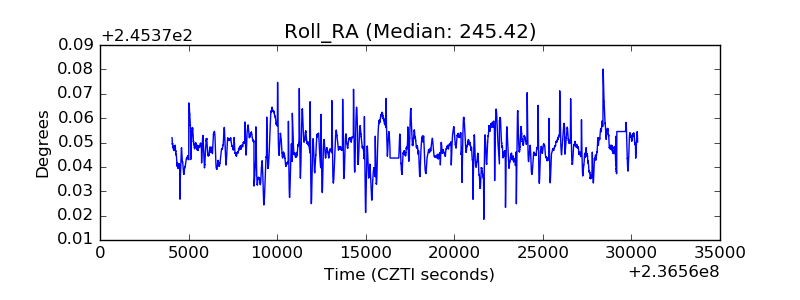 |
| Veto Counter | 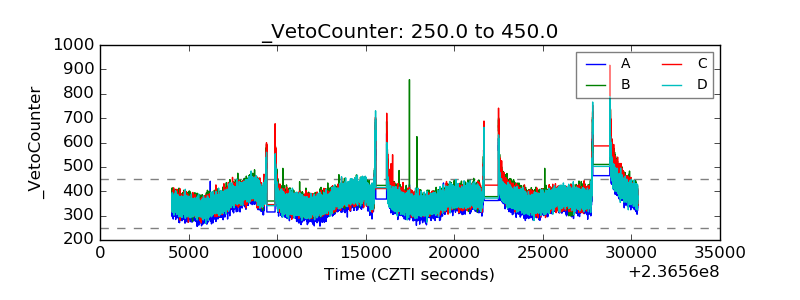 |