| Param | Original file | Final file |
|---|---|---|
| Filename | modeM0/AS1G05_230T06_9000001350_09507cztM0_level2.evt | modeM0/AS1G05_230T06_9000001350_09507cztM0_level2_quad_clean.evt |
| Size (bytes) | 250,804,800 | 46,912,320 |
| Size | 239.2 MB | 44.7 MB |
| Events in quadrant A | 2,043,511 | 281,778 |
| Events in quadrant B | 1,774,136 | 303,391 |
| Events in quadrant C | 1,682,818 | 304,044 |
| Events in quadrant D | 1,855,322 | 283,582 |
| Mode M0 | |||
|---|---|---|---|
| Quadrant | BADHDUFLAG | Total packets | Discarded packets |
| A | 0 | 17173 | 8869 |
| B | 0 | 14178 | 6772 |
| C | 0 | 13907 | 6570 |
| D | 0 | 15053 | 7460 |
| Mode SS | |||
|---|---|---|---|
| Quadrant | BADHDUFLAG | Total packets | Discarded packets |
| A | 0 | 137 | 64 |
| B | 0 | 141 | 57 |
| C | 0 | 140 | 62 |
| D | 0 | 137 | 57 |
| Mode M9 | |||
|---|---|---|---|
| Quadrant | BADHDUFLAG | Total packets | Discarded packets |
| A | 0 | 22 | 10 |
| B | 0 | 22 | 11 |
| C | 0 | 23 | 10 |
| D | 0 | 22 | 14 |
| Quadrant | Total seconds | Saturated seconds | Saturation percentage |
|---|---|---|---|
| A | 3283 | 45 | 1.370698% |
| B | 3519 | 45 | 1.278772% |
| C | 3538 | 21 | 0.593556% |
| D | 3477 | 47 | 1.351740% |
Noise dominated data is calculated using 1-second bins in cleaned event files. If a bin has >2000 counts, and if more than 50% of those come from <1% of pixels, then it is considered to be noise-dominated and hence unusable.
| Quadrant | # 1 sec bins | Bins with >0 counts | Bins with >2000 counts | High rate bins dominated by noise | Noise dominated (total time) | Noise dominated (detector-on time) | Marked lightcurve |
|---|---|---|---|---|---|---|---|
| A | 9015 | 4257 | 0 | 0 | 0.00% | 0.00% | 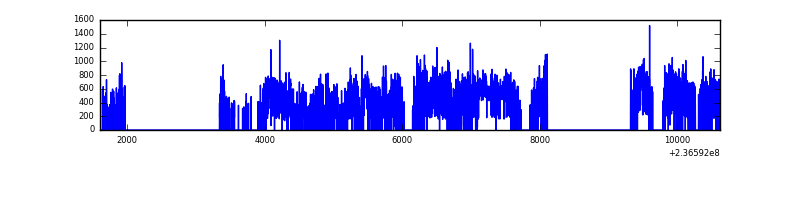 |
| B | 9007 | 4463 | 0 | 0 | 0.00% | 0.00% | 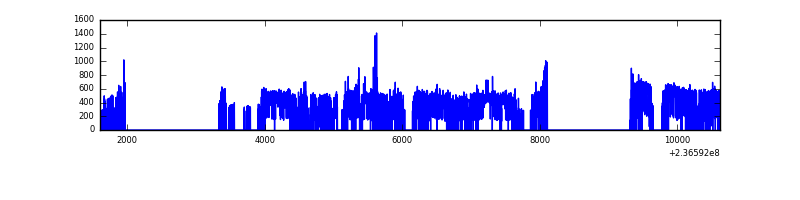 |
| C | 8962 | 4485 | 0 | 0 | 0.00% | 0.00% | 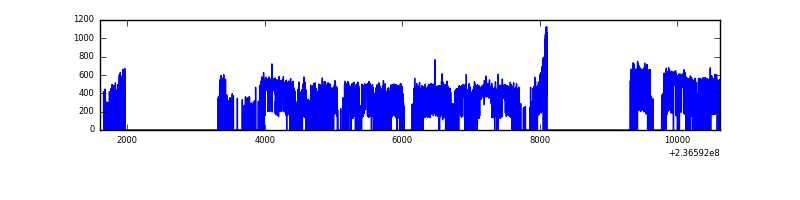 |
| D | 9010 | 4441 | 14 | 14 | 0.16% | 0.32% | 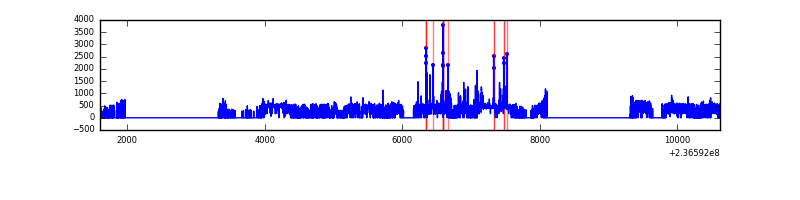 |
Top three noisy pixels from each quadrant. If the there are fewer than three noisy pixels in the level2.evt file, extra rows are filled as -1
| Pixel properties | Quadrant properties | ||||||
|---|---|---|---|---|---|---|---|
| Quadrant | DetID | PixID | Counts | Sigma | Mean | Median | Sigma |
| A | 8 | 5 | 248639 | 2925.63 | 414 | 408 | 84.8 |
| A | 1 | 162 | 94785 | 1112.32 | 414 | 408 | 84.8 |
| A | 1 | 178 | 39031 | 455.21 | 414 | 408 | 84.8 |
| B | 0 | 214 | 14400 | 166.16 | 445 | 436 | 84.0 |
| B | 0 | 187 | 10657 | 121.62 | 445 | 436 | 84.0 |
| B | 12 | 111 | 8918 | 100.93 | 445 | 436 | 84.0 |
| C | 13 | 61 | 3265 | 28.43 | 430 | 433 | 99.6 |
| C | 9 | 68 | 2009 | 15.82 | 430 | 433 | 99.6 |
| C | 1 | 0 | 1075 | 6.45 | 430 | 433 | 99.6 |
| D | 8 | 195 | 69675 | 669.7 | 422 | 415 | 103.4 |
| D | 12 | 233 | 60441 | 580.41 | 422 | 415 | 103.4 |
| D | 7 | 71 | 59665 | 572.91 | 422 | 415 | 103.4 |
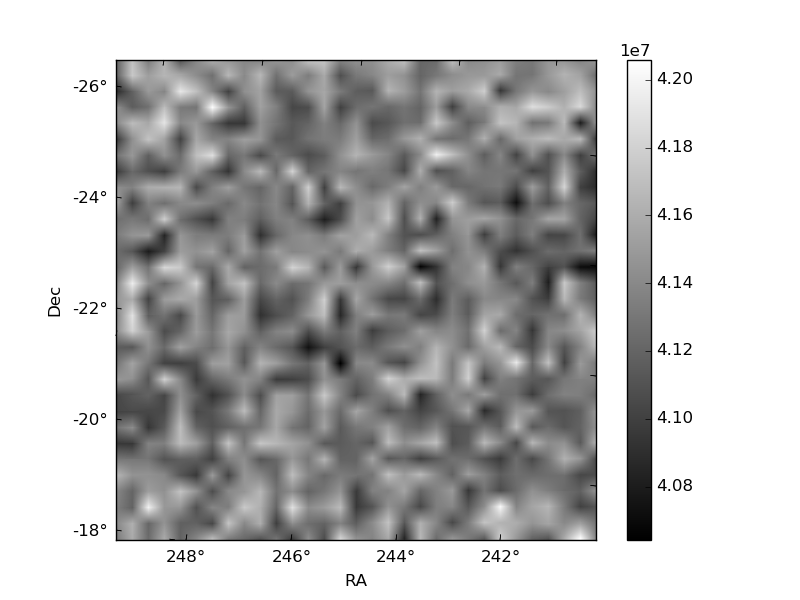
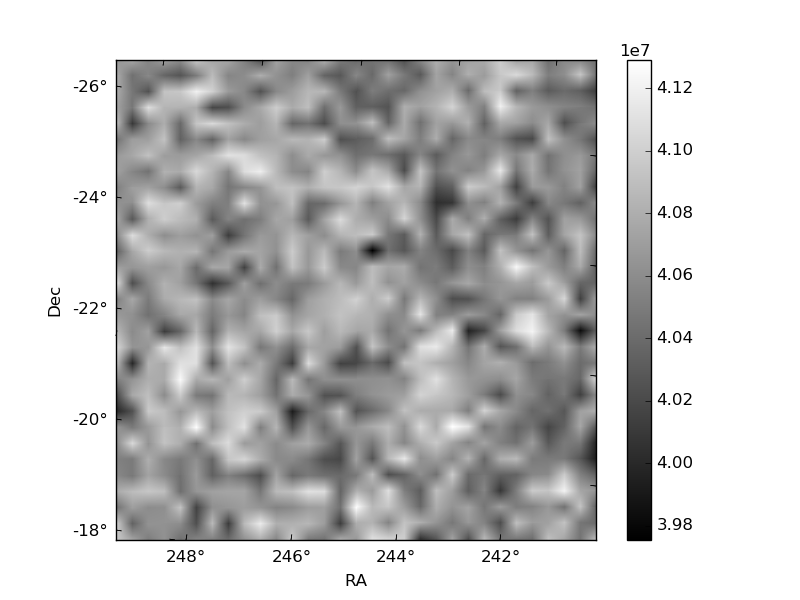
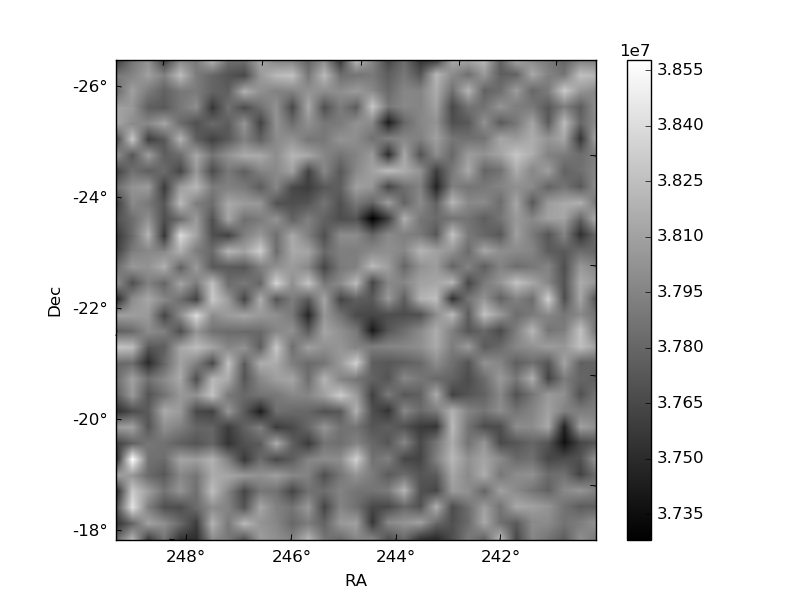
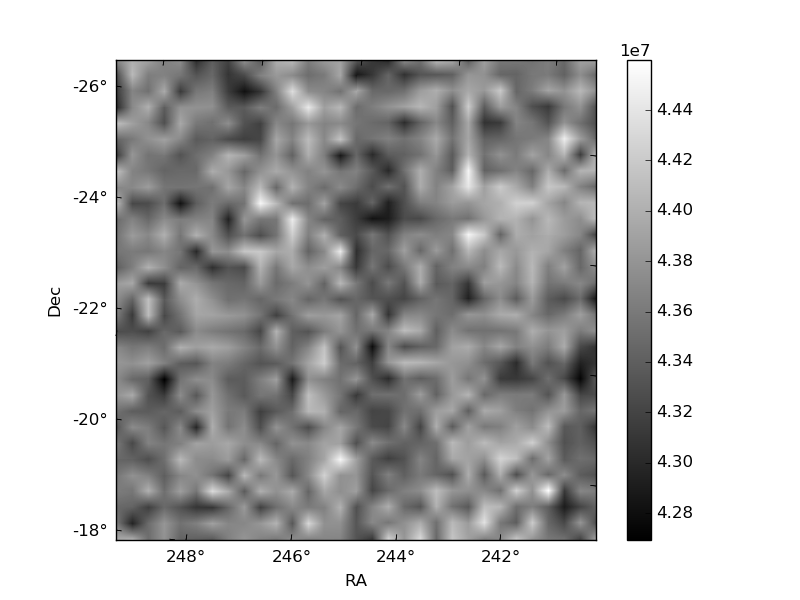
Histogram calculated using DETX and DETY for each event in the final _common_clean file
| Quadrant A | 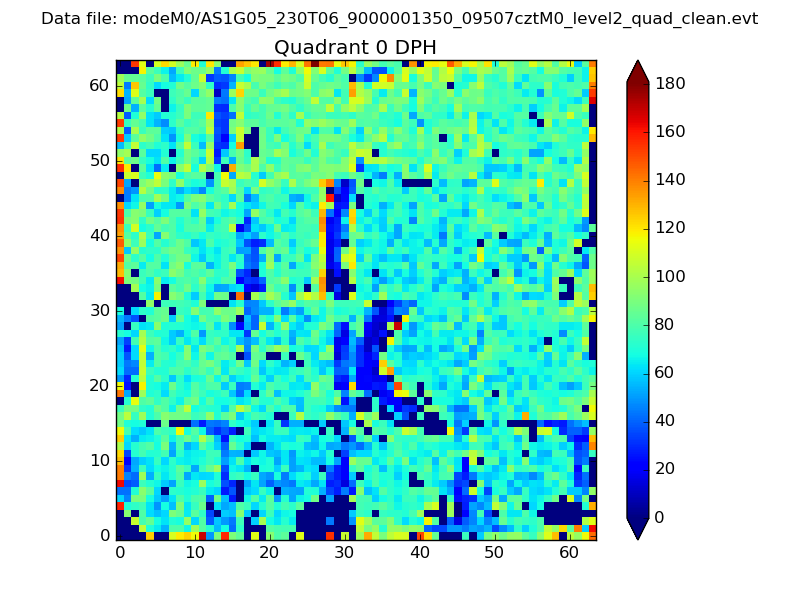 |
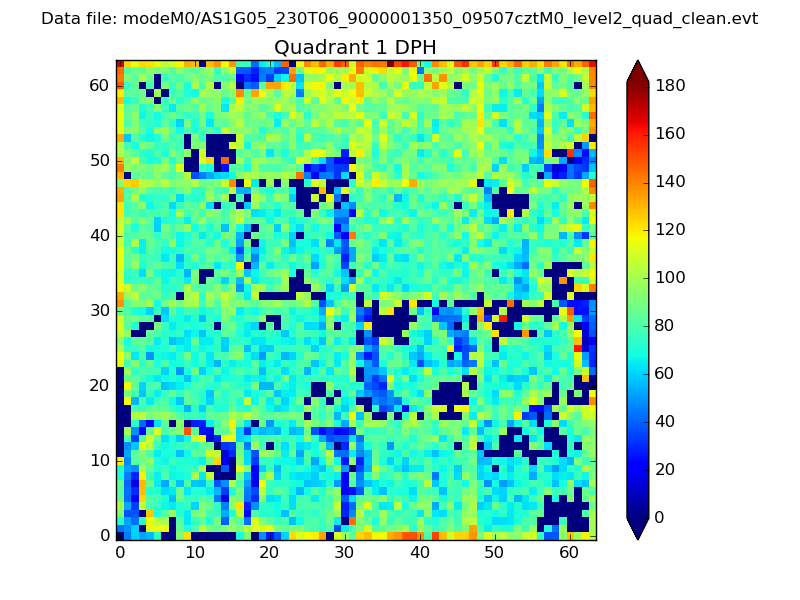 |
Quadrant B |
|---|---|---|---|
| Quadrant D | 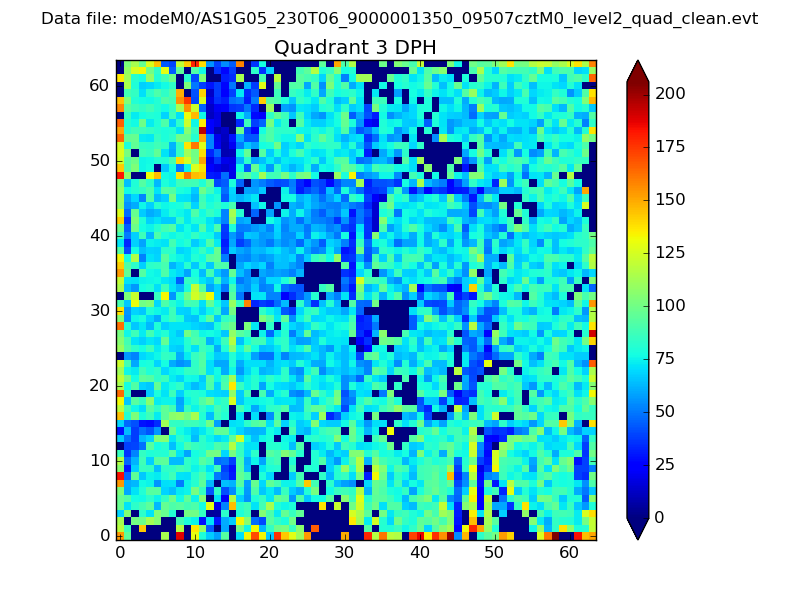 |
 |
Quadrant C |
| Plot type | Count rate plots | Images |
|---|---|---|
| Comparison with Poisson distribution Blue bars denote a histogram of data divided into 1 sec bins. Red curve is a Poisson curve with rate = median count rate of data. |
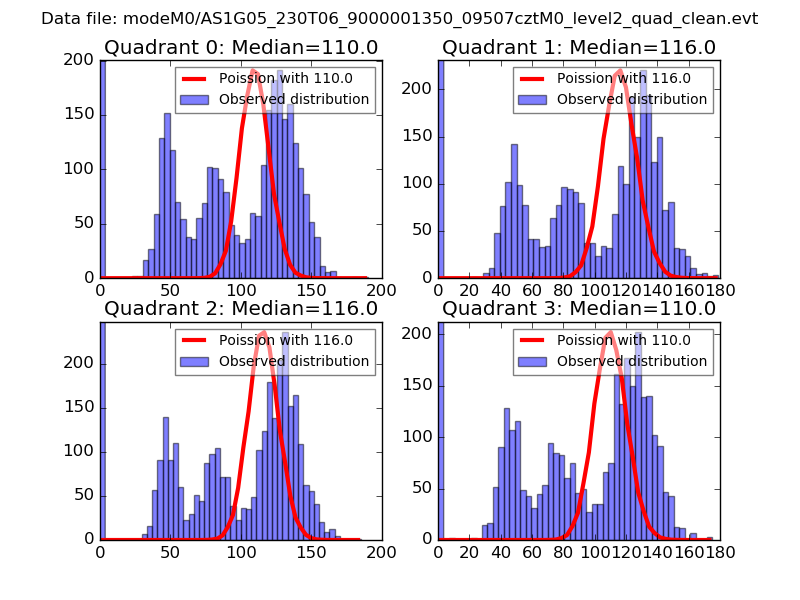 |
 |
| Quadrant-wise count rates Data is divided into 100 sec bins |
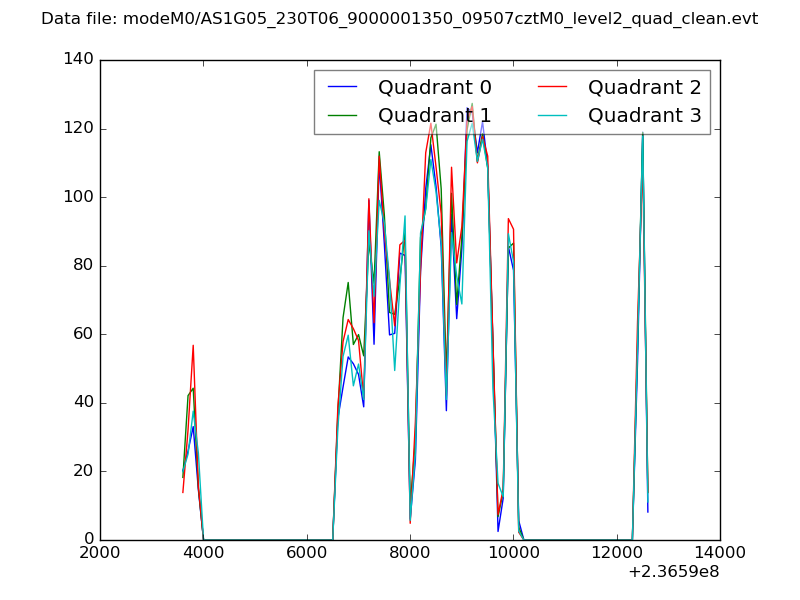 |
|
| Module-wise count rates for Quadrant A Data is divided into 100 sec bins |
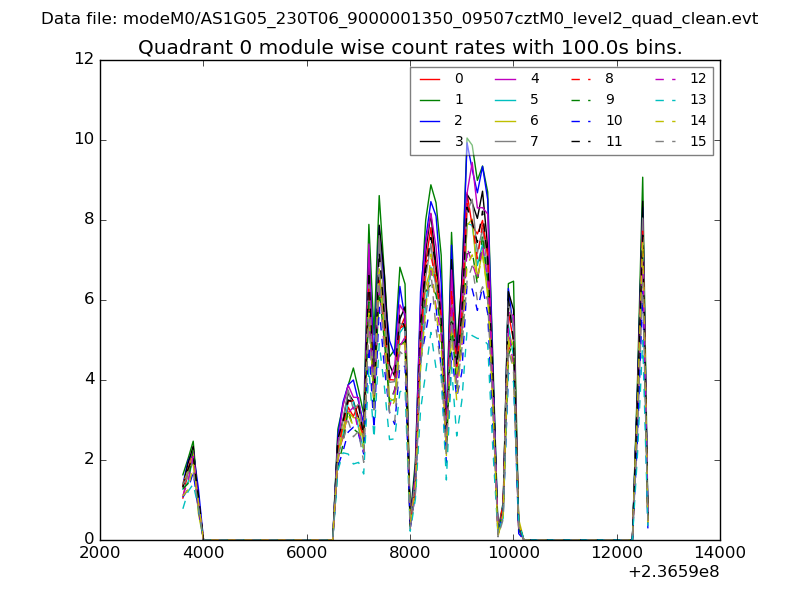 |
 |
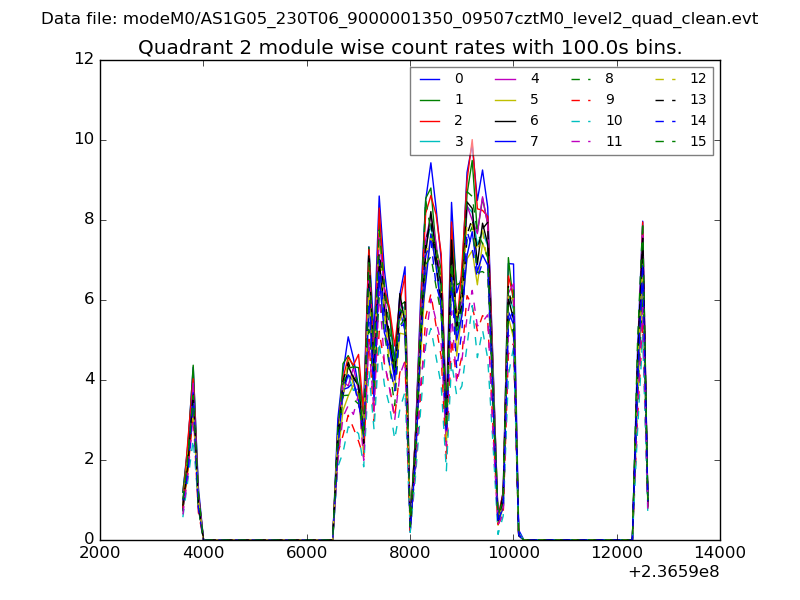
| Module-wise count rates for Quadrant B Data is divided into 100 sec bins |
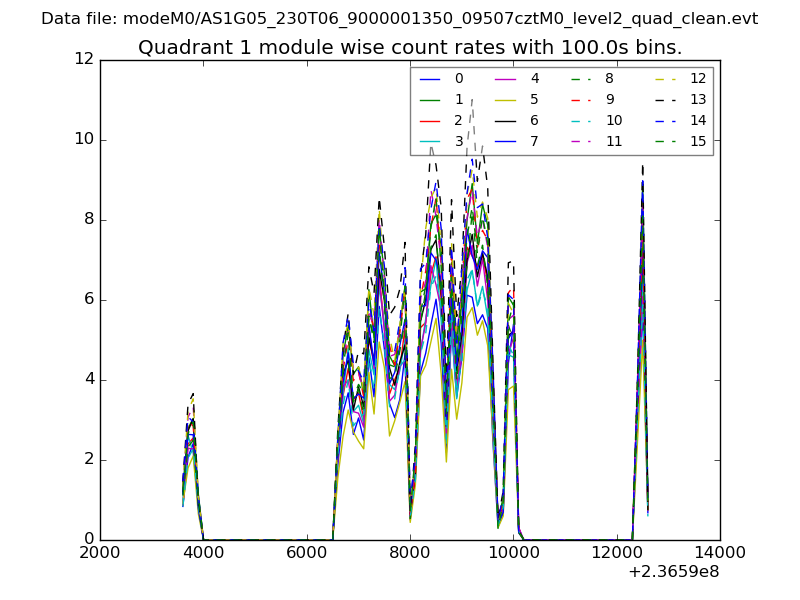 |
 |
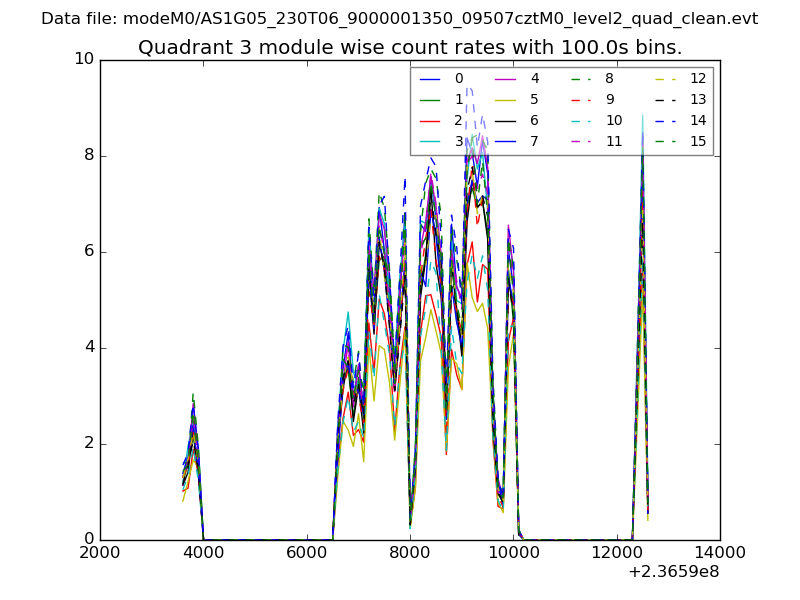
| Module-wise count rates for Quadrant C Data is divided into 100 sec bins |
 |
 |
| Module-wise count rates for Quadrant D Data is divided into 100 sec bins |
 |
 |
| Parameter | Plot |
|---|---|
| CZT HV Monitor | 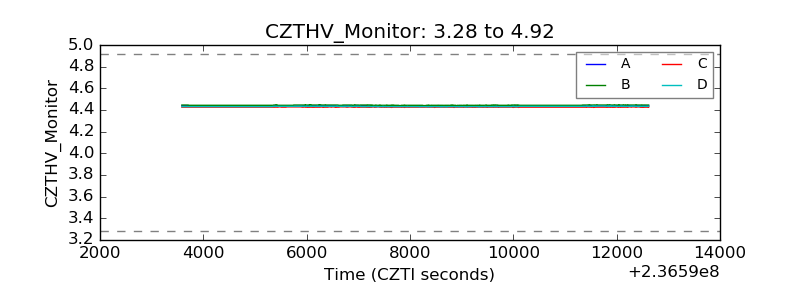 |
| D_VDD | 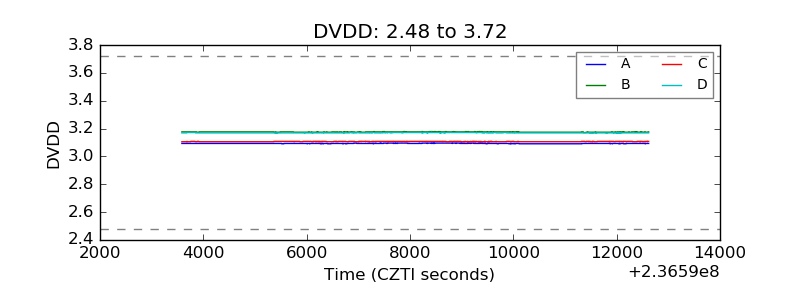 |
| Temperature 1 | 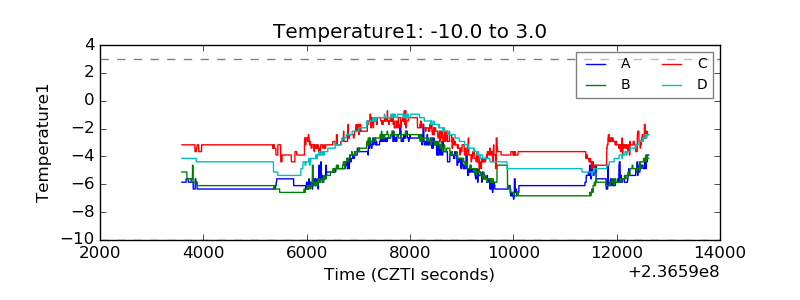 |
| Veto HV Monitor | 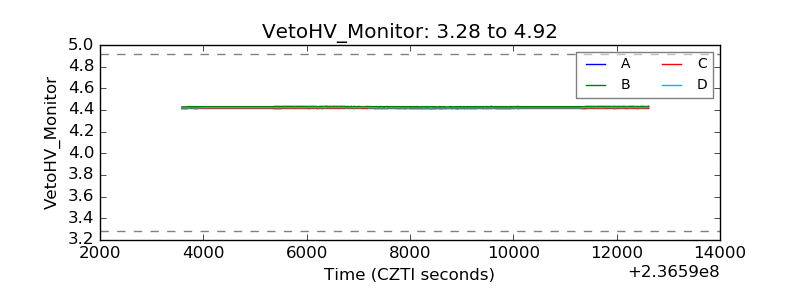 |
| Veto LLD | 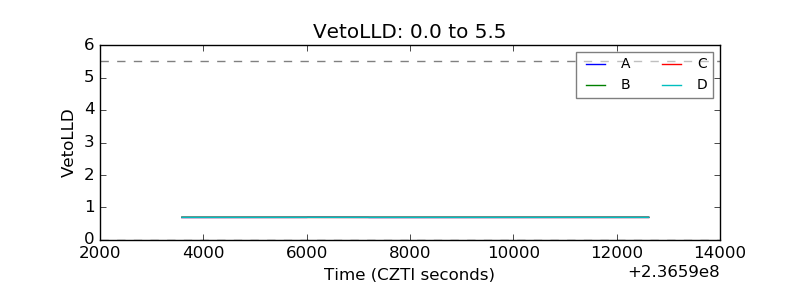 |
| Alpha Counter | 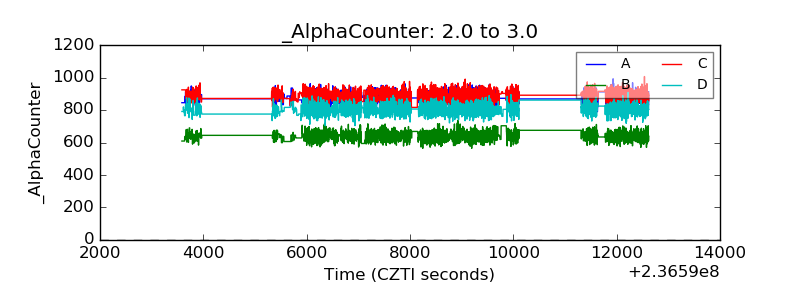 |
| _CPM_Rate | 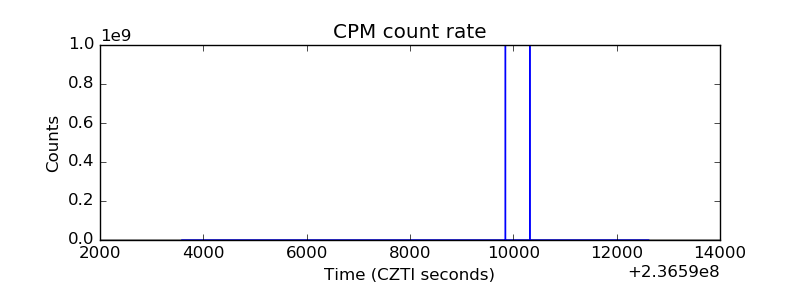 |
| CZT Counter |  |
| +2.5 Volts monitor |  |
| +5 Volts monitor |  |
| _ROLL_ROT | 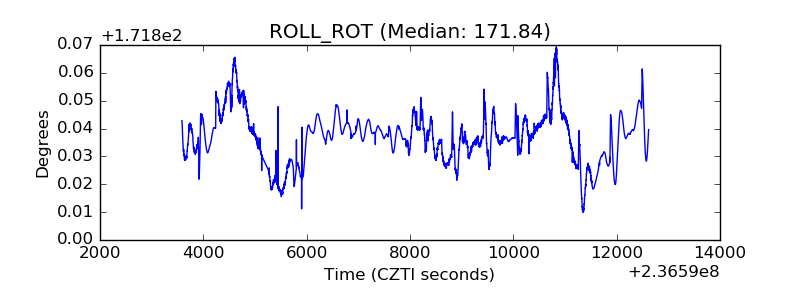 |
| _Roll_DEC | 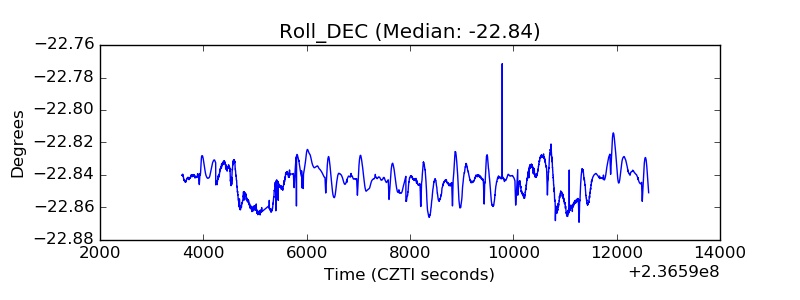 |
| _Roll_RA |  |
| Veto Counter | 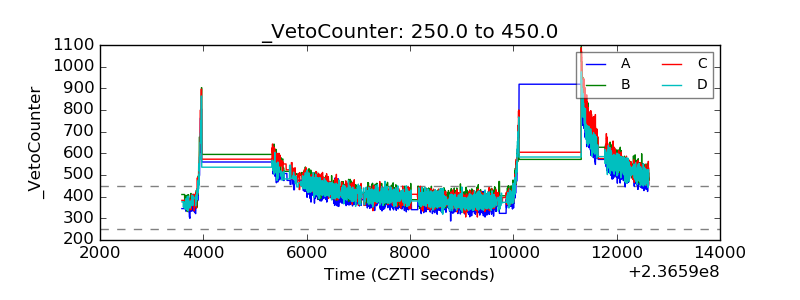 |