| Param | Original file | Final file |
|---|---|---|
| Filename | modeM0/AS1G05_230T06_9000001350_09508cztM0_level2.evt | modeM0/AS1G05_230T06_9000001350_09508cztM0_level2_quad_clean.evt |
| Size (bytes) | 251,447,040 | 48,841,920 |
| Size | 239.8 MB | 46.6 MB |
| Events in quadrant A | 2,005,292 | 305,838 |
| Events in quadrant B | 1,724,243 | 329,155 |
| Events in quadrant C | 1,637,875 | 322,448 |
| Events in quadrant D | 2,027,999 | 293,859 |
| Mode M0 | |||
|---|---|---|---|
| Quadrant | BADHDUFLAG | Total packets | Discarded packets |
| A | 0 | 16736 | 8618 |
| B | 0 | 13656 | 6519 |
| C | 0 | 13336 | 6315 |
| D | 0 | 15836 | 7798 |
| Mode SS | |||
|---|---|---|---|
| Quadrant | BADHDUFLAG | Total packets | Discarded packets |
| A | 0 | 129 | 63 |
| B | 0 | 129 | 59 |
| C | 0 | 129 | 69 |
| D | 0 | 129 | 71 |
| Mode M9 | |||
|---|---|---|---|
| Quadrant | BADHDUFLAG | Total packets | Discarded packets |
| A | 0 | 18 | 4 |
| B | 0 | 18 | 3 |
| C | 0 | 18 | 3 |
| D | 0 | 19 | 2 |
| Quadrant | Total seconds | Saturated seconds | Saturation percentage |
|---|---|---|---|
| A | 3073 | 105 | 3.416856% |
| B | 3260 | 78 | 2.392638% |
| C | 3277 | 56 | 1.708880% |
| D | 3156 | 80 | 2.534854% |
Noise dominated data is calculated using 1-second bins in cleaned event files. If a bin has >2000 counts, and if more than 50% of those come from <1% of pixels, then it is considered to be noise-dominated and hence unusable.
| Quadrant | # 1 sec bins | Bins with >0 counts | Bins with >2000 counts | High rate bins dominated by noise | Noise dominated (total time) | Noise dominated (detector-on time) | Marked lightcurve |
|---|---|---|---|---|---|---|---|
| A | 7584 | 3728 | 0 | 0 | 0.00% | 0.00% | 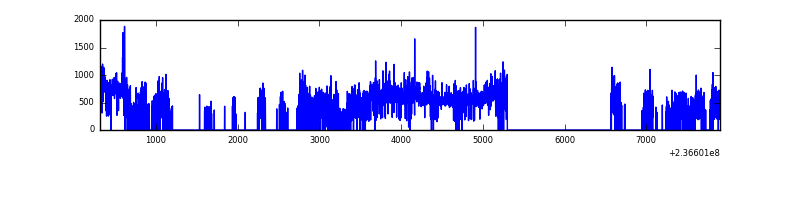 |
| B | 7587 | 3974 | 0 | 0 | 0.00% | 0.00% | 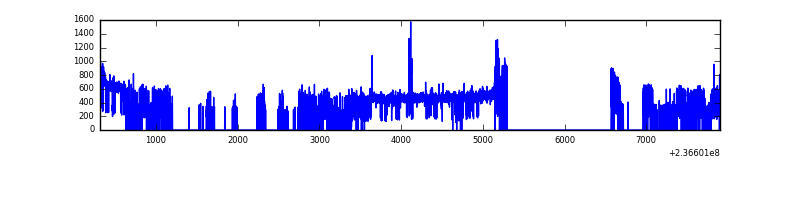 |
| C | 7588 | 3981 | 0 | 0 | 0.00% | 0.00% | 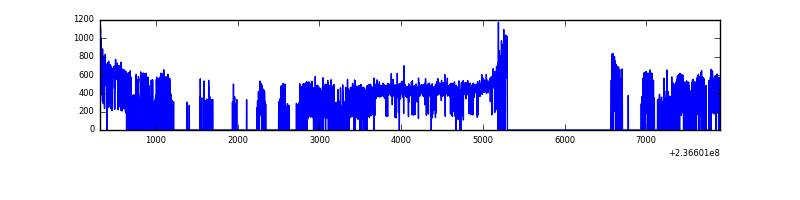 |
| D | 7588 | 3857 | 10 | 10 | 0.13% | 0.26% | 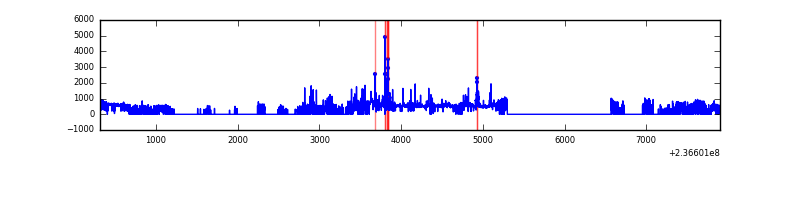 |
Top three noisy pixels from each quadrant. If the there are fewer than three noisy pixels in the level2.evt file, extra rows are filled as -1
| Pixel properties | Quadrant properties | ||||||
|---|---|---|---|---|---|---|---|
| Quadrant | DetID | PixID | Counts | Sigma | Mean | Median | Sigma |
| A | 8 | 5 | 238594 | 2859.34 | 409 | 401 | 83.3 |
| A | 1 | 162 | 91408 | 1092.48 | 409 | 401 | 83.3 |
| A | 1 | 178 | 37206 | 441.82 | 409 | 401 | 83.3 |
| B | 0 | 214 | 17060 | 200.43 | 431 | 421 | 83.0 |
| B | 5 | 175 | 15800 | 185.25 | 431 | 421 | 83.0 |
| B | 0 | 213 | 9498 | 109.34 | 431 | 421 | 83.0 |
| C | 13 | 61 | 3253 | 29.03 | 419 | 422 | 97.5 |
| C | 8 | 222 | 2409 | 20.38 | 419 | 422 | 97.5 |
| C | 1 | 0 | 1114 | 7.1 | 419 | 422 | 97.5 |
| D | 12 | 233 | 167410 | 1627.44 | 401 | 391 | 102.6 |
| D | 1 | 52 | 158810 | 1543.64 | 401 | 391 | 102.6 |
| D | 8 | 195 | 131059 | 1273.23 | 401 | 391 | 102.6 |
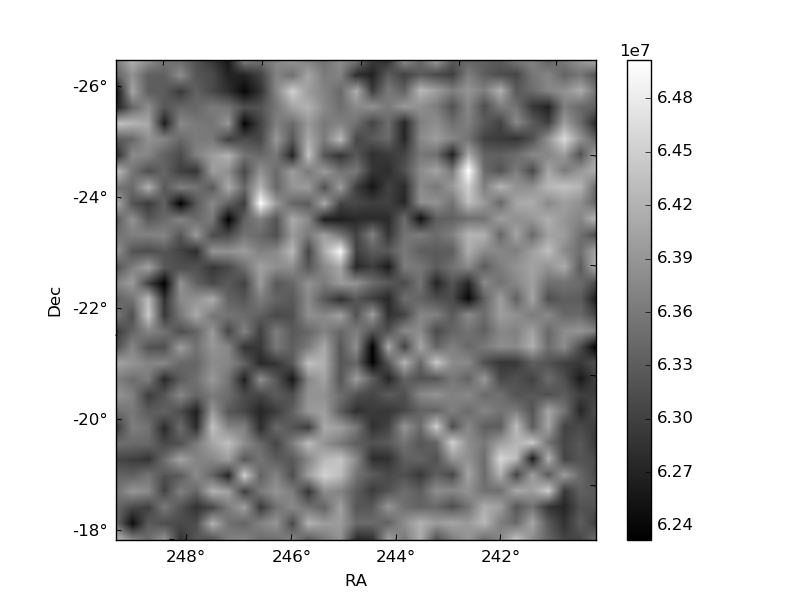
Histogram calculated using DETX and DETY for each event in the final _common_clean file
| Quadrant A |  |
 |
Quadrant B |
|---|---|---|---|
| Quadrant D |  |
 |
Quadrant C |
| Plot type | Count rate plots | Images |
|---|---|---|
| Comparison with Poisson distribution Blue bars denote a histogram of data divided into 1 sec bins. Red curve is a Poisson curve with rate = median count rate of data. |
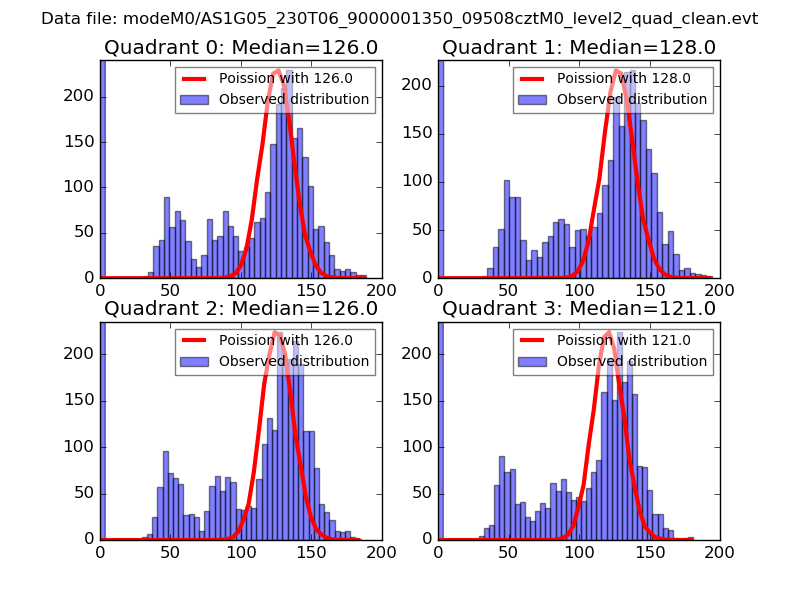 |
 |
| Quadrant-wise count rates Data is divided into 100 sec bins |
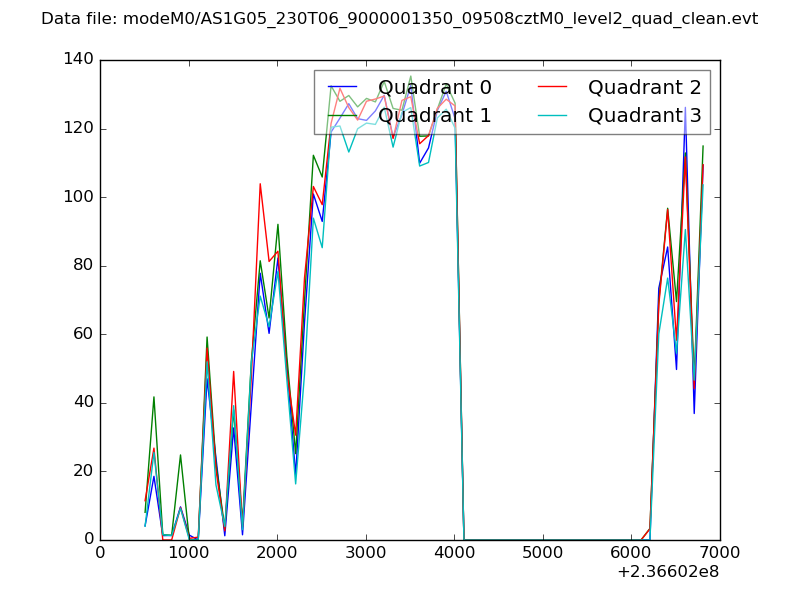 |
|
| Module-wise count rates for Quadrant A Data is divided into 100 sec bins |
 |
 |
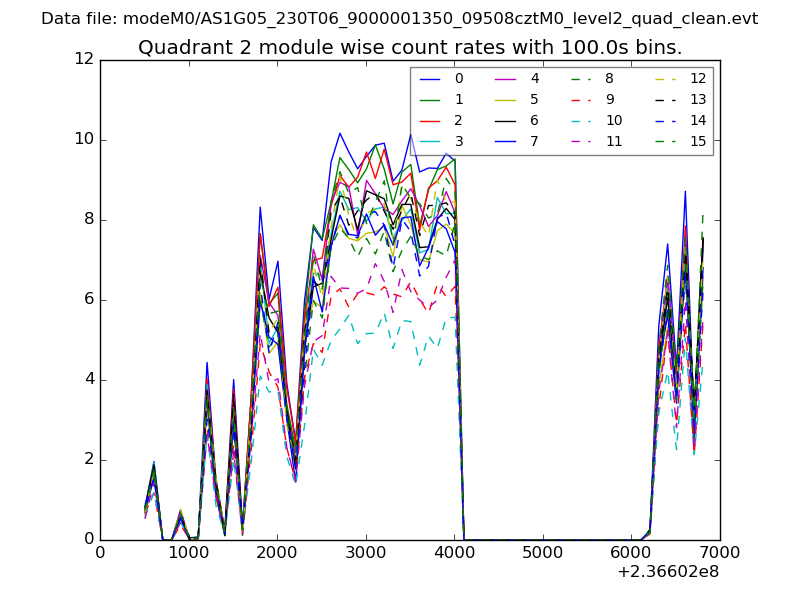
| Module-wise count rates for Quadrant B Data is divided into 100 sec bins |
 |
 |
| Module-wise count rates for Quadrant C Data is divided into 100 sec bins |
 |
 |
| Module-wise count rates for Quadrant D Data is divided into 100 sec bins |
 |
 |
| Parameter | Plot |
|---|---|
| CZT HV Monitor | 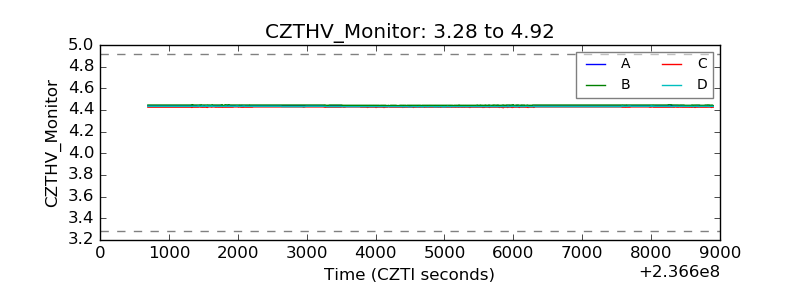 |
| D_VDD |  |
| Temperature 1 |  |
| Veto HV Monitor |  |
| Veto LLD |  |
| Alpha Counter | 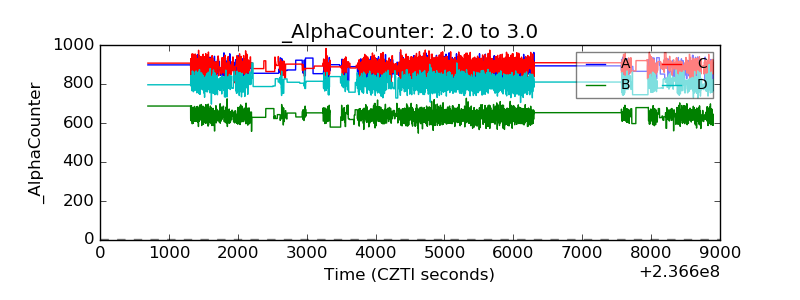 |
| _CPM_Rate | 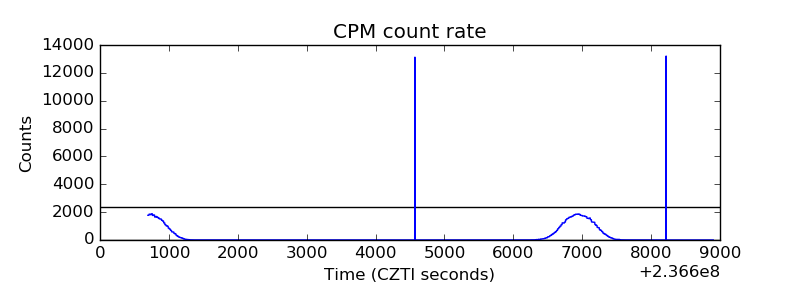 |
| CZT Counter |  |
| +2.5 Volts monitor |  |
| +5 Volts monitor |  |
| _ROLL_ROT |  |
| _Roll_DEC |  |
| _Roll_RA |  |
| Veto Counter |  |