| Param | Original file | Final file |
|---|---|---|
| Filename | modeM0/AS1G05_230T06_9000001350_09509cztM0_level2.evt | modeM0/AS1G05_230T06_9000001350_09509cztM0_level2_quad_clean.evt |
| Size (bytes) | 242,553,600 | 48,850,560 |
| Size | 231.3 MB | 46.6 MB |
| Events in quadrant A | 1,971,168 | 305,003 |
| Events in quadrant B | 1,680,159 | 328,714 |
| Events in quadrant C | 1,634,263 | 330,277 |
| Events in quadrant D | 1,848,402 | 295,698 |
| Mode M0 | |||
|---|---|---|---|
| Quadrant | BADHDUFLAG | Total packets | Discarded packets |
| A | 0 | 16393 | 8508 |
| B | 0 | 13459 | 6620 |
| C | 0 | 13024 | 6150 |
| D | 0 | 15649 | 8372 |
| Mode SS | |||
|---|---|---|---|
| Quadrant | BADHDUFLAG | Total packets | Discarded packets |
| A | 0 | 127 | 65 |
| B | 0 | 128 | 62 |
| C | 0 | 130 | 62 |
| D | 0 | 129 | 65 |
| Mode M9 | |||
|---|---|---|---|
| Quadrant | BADHDUFLAG | Total packets | Discarded packets |
| A | 0 | 25 | 5 |
| B | 0 | 25 | 9 |
| C | 0 | 25 | 9 |
| D | 0 | 25 | 6 |
| Quadrant | Total seconds | Saturated seconds | Saturation percentage |
|---|---|---|---|
| A | 2921 | 78 | 2.670318% |
| B | 3119 | 46 | 1.474832% |
| C | 3216 | 40 | 1.243781% |
| D | 2971 | 48 | 1.615618% |
Noise dominated data is calculated using 1-second bins in cleaned event files. If a bin has >2000 counts, and if more than 50% of those come from <1% of pixels, then it is considered to be noise-dominated and hence unusable.
| Quadrant | # 1 sec bins | Bins with >0 counts | Bins with >2000 counts | High rate bins dominated by noise | Noise dominated (total time) | Noise dominated (detector-on time) | Marked lightcurve |
|---|---|---|---|---|---|---|---|
| A | 7452 | 3801 | 0 | 0 | 0.00% | 0.00% | 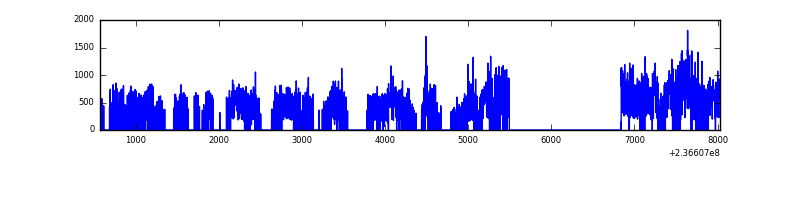 |
| B | 7458 | 4000 | 0 | 0 | 0.00% | 0.00% | 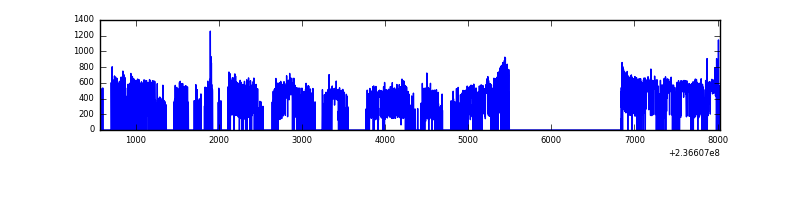 |
| C | 7460 | 4089 | 0 | 0 | 0.00% | 0.00% | 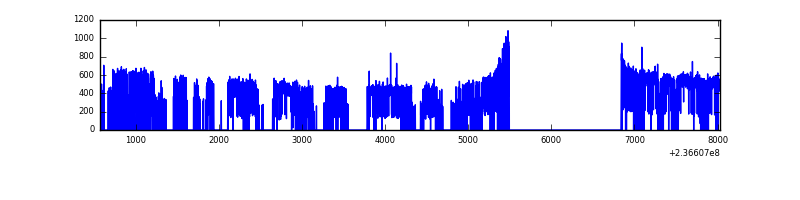 |
| D | 7454 | 3861 | 5 | 5 | 0.07% | 0.13% | 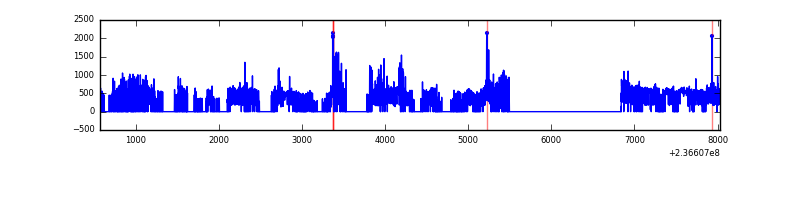 |
Top three noisy pixels from each quadrant. If the there are fewer than three noisy pixels in the level2.evt file, extra rows are filled as -1
| Pixel properties | Quadrant properties | ||||||
|---|---|---|---|---|---|---|---|
| Quadrant | DetID | PixID | Counts | Sigma | Mean | Median | Sigma |
| A | 8 | 5 | 254091 | 3123.83 | 398 | 391 | 81.2 |
| A | 1 | 162 | 87951 | 1078.13 | 398 | 391 | 81.2 |
| A | 1 | 178 | 35742 | 435.28 | 398 | 391 | 81.2 |
| B | 0 | 214 | 22865 | 277.32 | 418 | 409 | 81.0 |
| B | 0 | 219 | 14726 | 176.81 | 418 | 409 | 81.0 |
| B | 0 | 229 | 9376 | 110.74 | 418 | 409 | 81.0 |
| C | 13 | 61 | 3169 | 28.41 | 417 | 420 | 96.8 |
| C | 12 | 4 | 3167 | 28.39 | 417 | 420 | 96.8 |
| C | 8 | 222 | 2414 | 20.6 | 417 | 420 | 96.8 |
| D | 1 | 52 | 184467 | 1894.78 | 388 | 377 | 97.2 |
| D | 8 | 195 | 112203 | 1150.99 | 388 | 377 | 97.2 |
| D | 12 | 233 | 39915 | 406.95 | 388 | 377 | 97.2 |
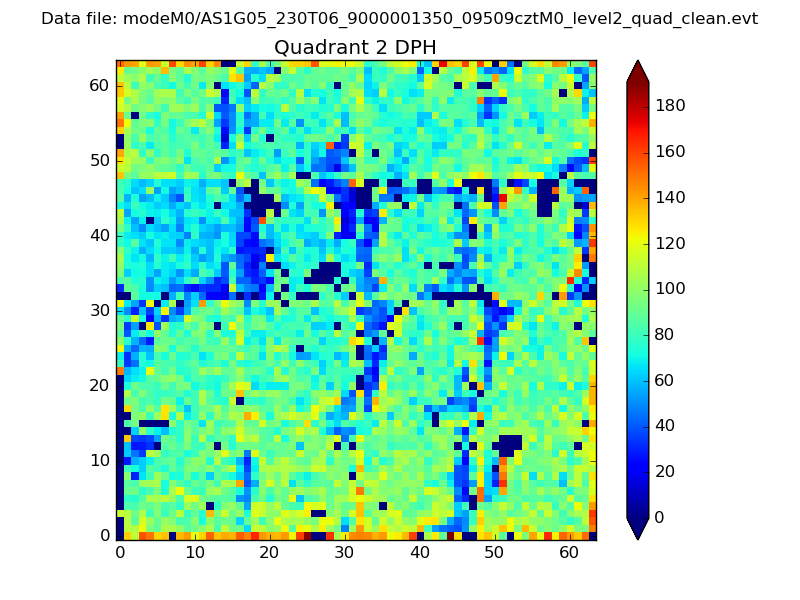
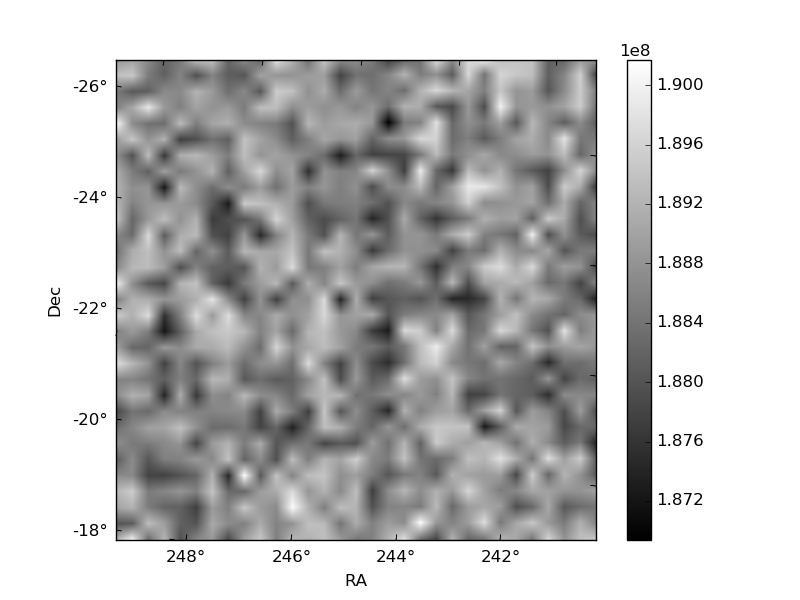
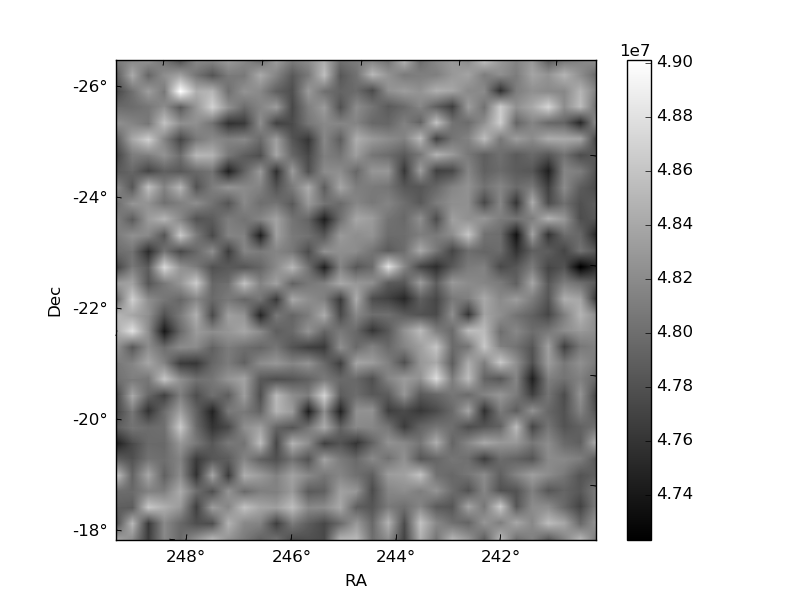
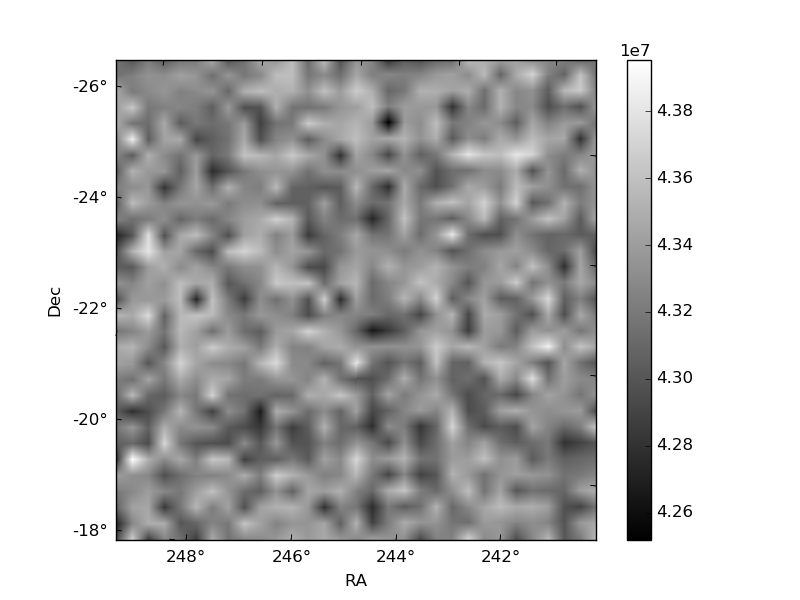
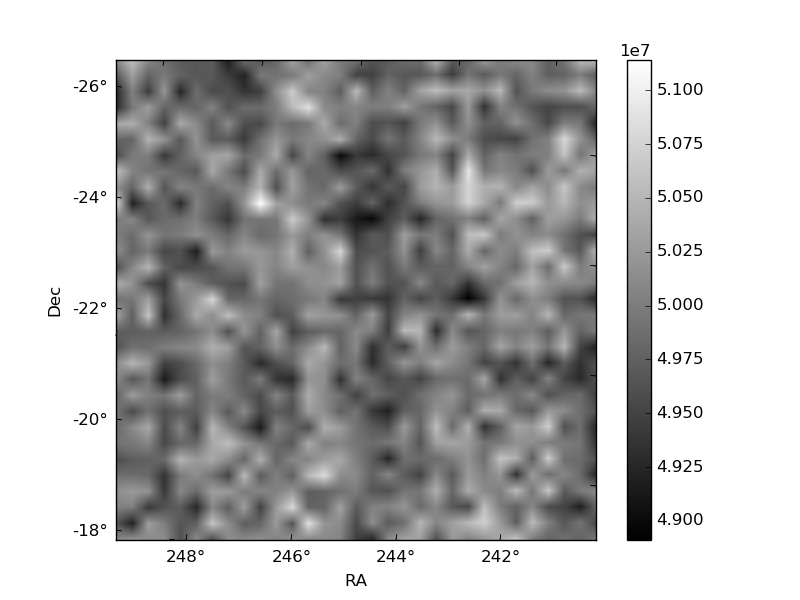
Histogram calculated using DETX and DETY for each event in the final _common_clean file
| Quadrant A | 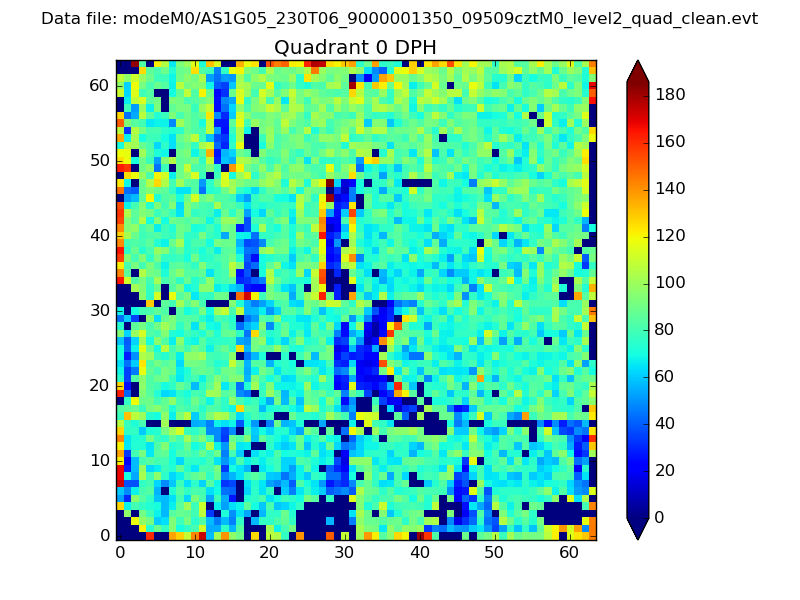 |
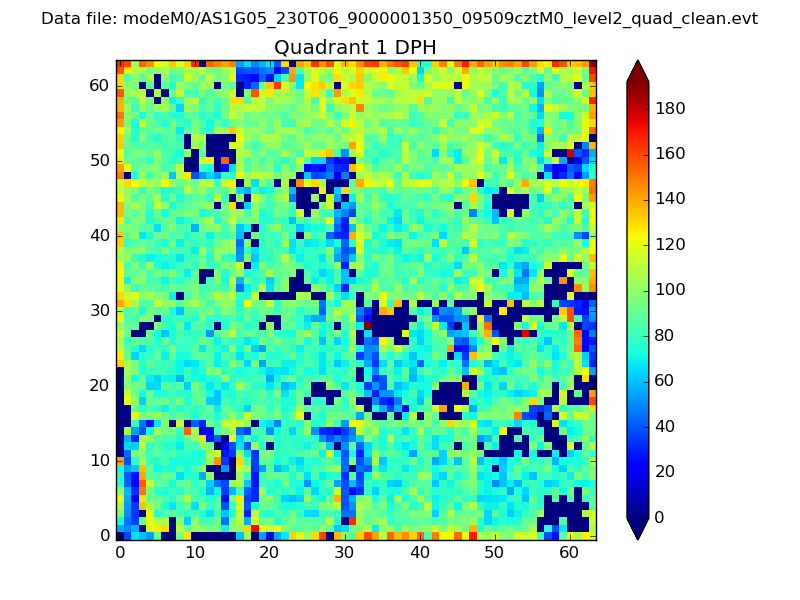 |
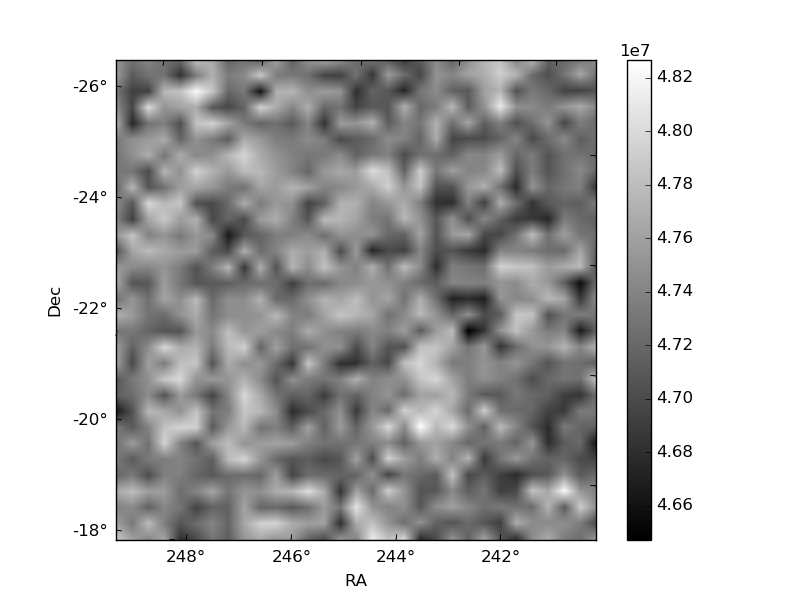
Quadrant B |
|---|---|---|---|
| Quadrant D | 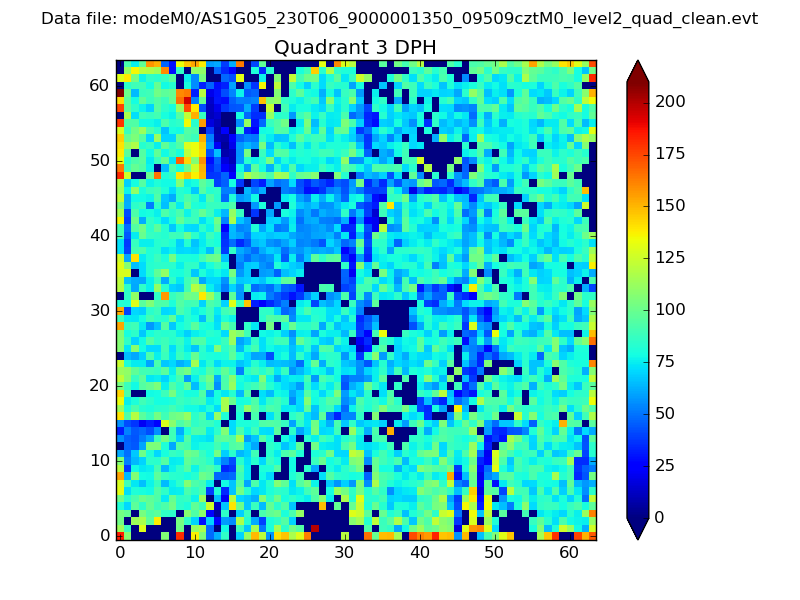 |
 |
Quadrant C |
| Plot type | Count rate plots | Images |
|---|---|---|
| Comparison with Poisson distribution Blue bars denote a histogram of data divided into 1 sec bins. Red curve is a Poisson curve with rate = median count rate of data. |
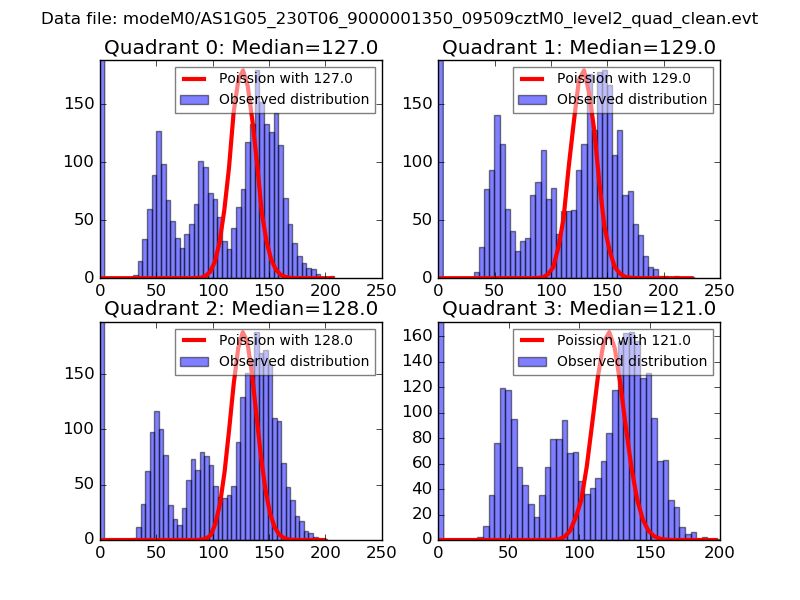 |
 |
| Quadrant-wise count rates Data is divided into 100 sec bins |
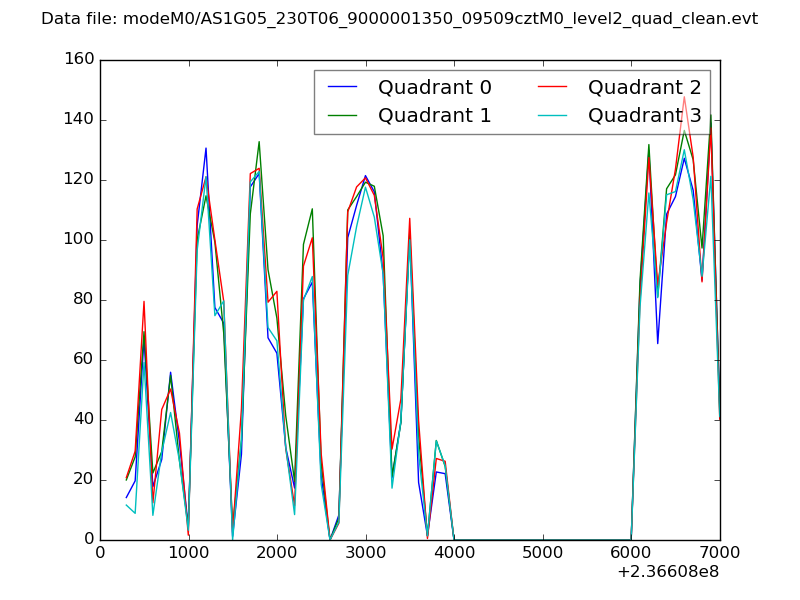 |
|
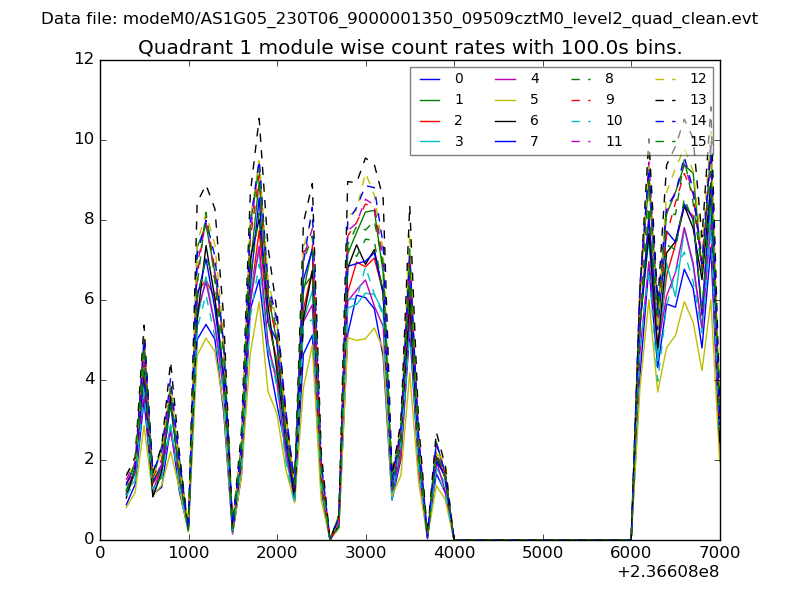
| Module-wise count rates for Quadrant A Data is divided into 100 sec bins |
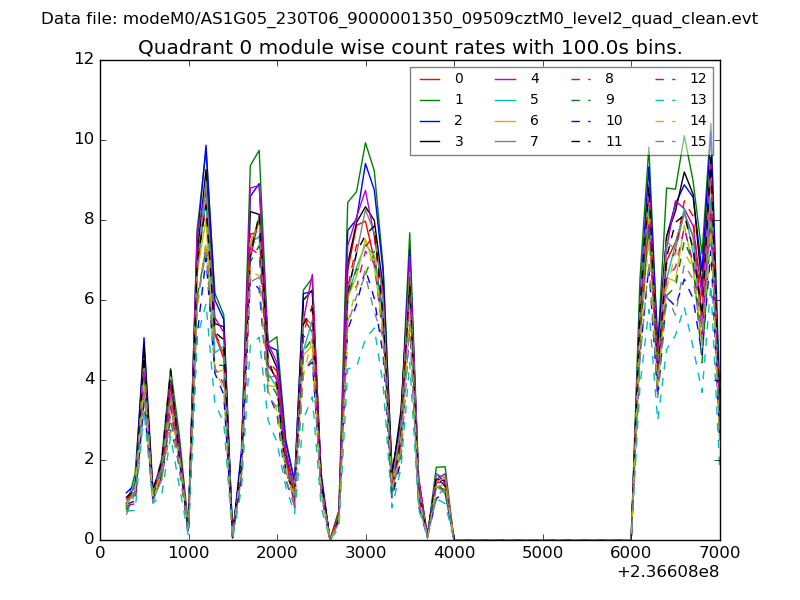 |
 |
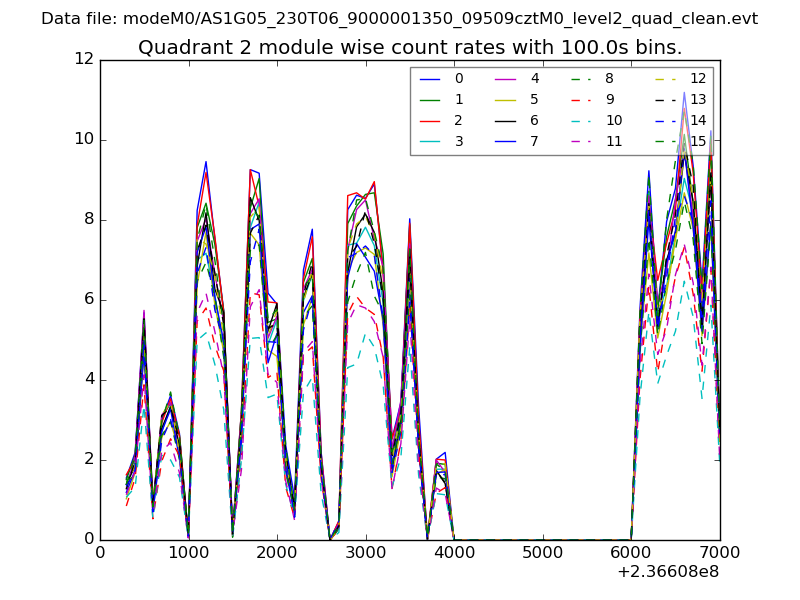
| Module-wise count rates for Quadrant B Data is divided into 100 sec bins |
 |
 |
| Module-wise count rates for Quadrant C Data is divided into 100 sec bins |
 |
 |
| Module-wise count rates for Quadrant D Data is divided into 100 sec bins |
 |
 |
| Parameter | Plot |
|---|---|
| CZT HV Monitor | 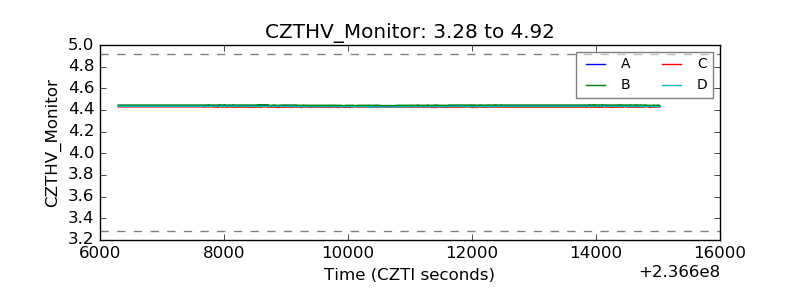 |
| D_VDD | 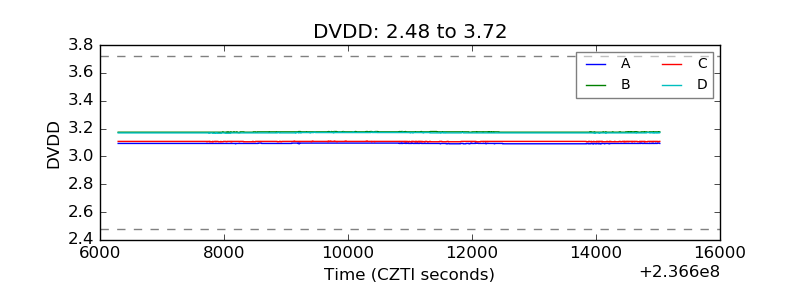 |
| Temperature 1 | 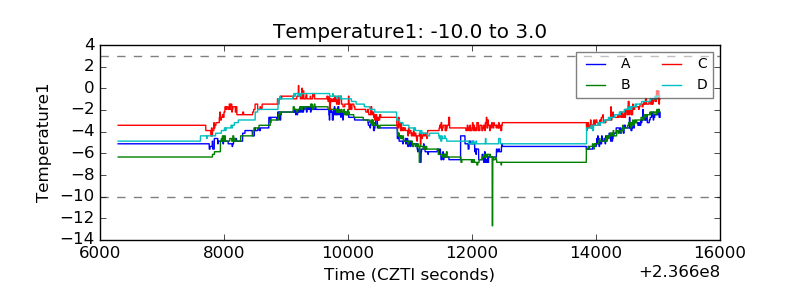 |
| Veto HV Monitor | 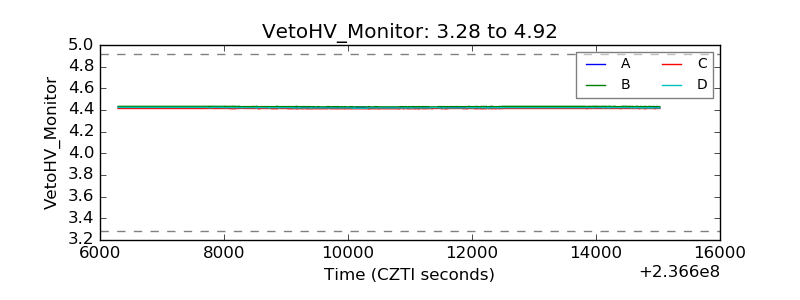 |
| Veto LLD | 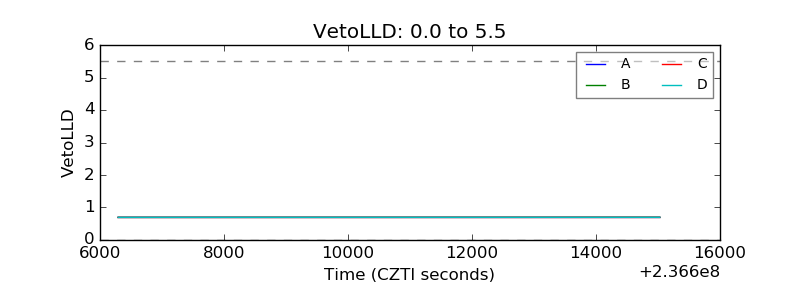 |
| Alpha Counter | 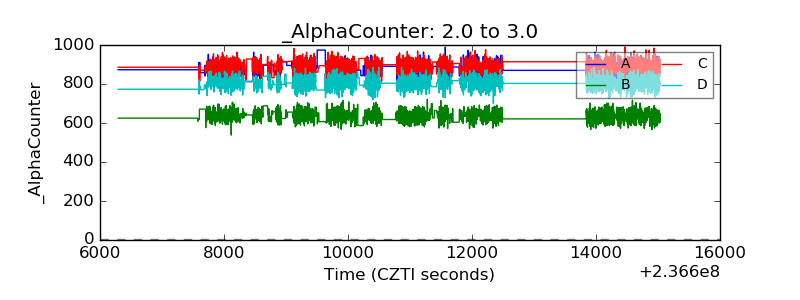 |
| _CPM_Rate | 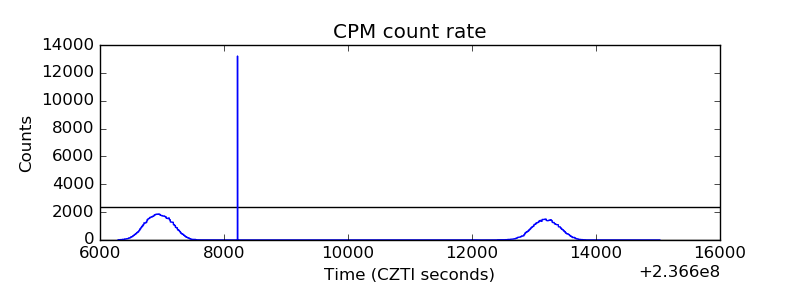 |
| CZT Counter | 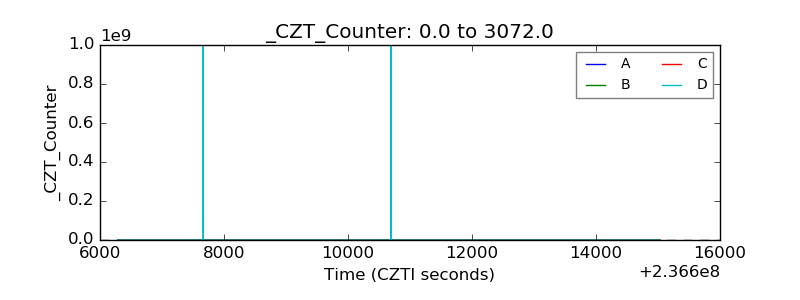 |
| +2.5 Volts monitor |  |
| +5 Volts monitor |  |
| _ROLL_ROT | 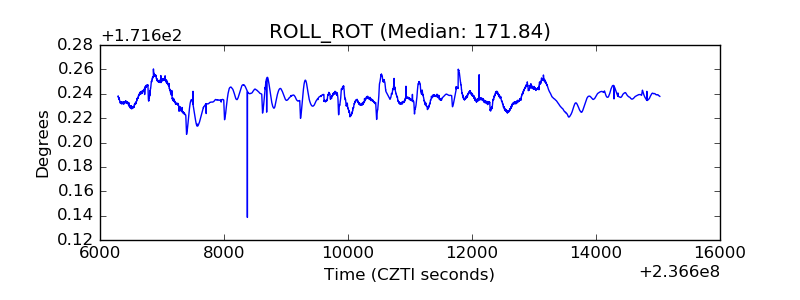 |
| _Roll_DEC |  |
| _Roll_RA | 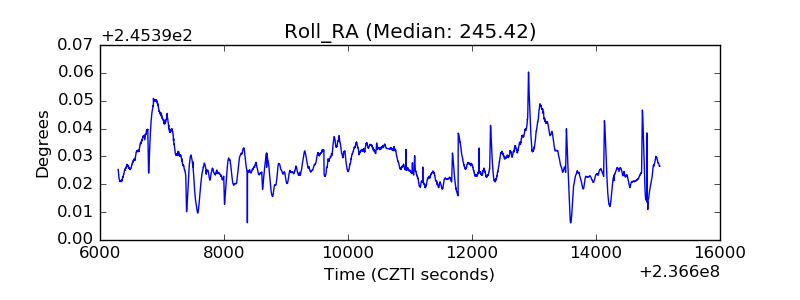 |
| Veto Counter | 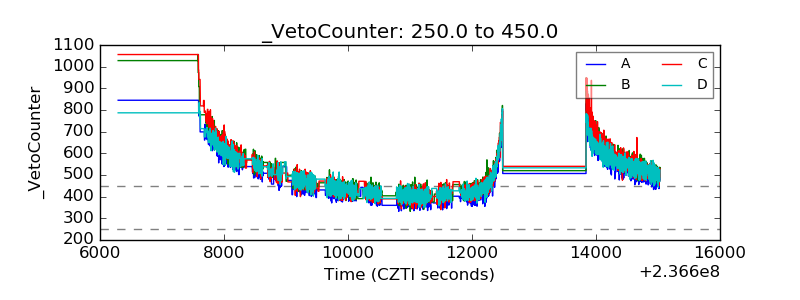 |