| Param | Original file | Final file |
|---|---|---|
| Filename | modeM0/AS1G05_230T06_9000001350_09510cztM0_level2.evt | modeM0/AS1G05_230T06_9000001350_09510cztM0_level2_quad_clean.evt |
| Size (bytes) | 1,509,402,240 | 299,485,440 |
| Size | 1.4 GB | 285.6 MB |
| Events in quadrant A | 12,540,440 | 1,924,076 |
| Events in quadrant B | 10,208,216 | 1,986,321 |
| Events in quadrant C | 9,576,806 | 1,946,053 |
| Events in quadrant D | 12,066,031 | 1,867,203 |
| Mode M0 | |||
|---|---|---|---|
| Quadrant | BADHDUFLAG | Total packets | Discarded packets |
| A | 0 | 56541 | 5551 |
| B | 0 | 45748 | 3382 |
| C | 0 | 44412 | 3143 |
| D | 0 | 52213 | 4073 |
| Mode SS | |||
|---|---|---|---|
| Quadrant | BADHDUFLAG | Total packets | Discarded packets |
| A | 0 | 434 | 34 |
| B | 0 | 434 | 32 |
| C | 0 | 434 | 36 |
| D | 0 | 434 | 28 |
| Mode M9 | |||
|---|---|---|---|
| Quadrant | BADHDUFLAG | Total packets | Discarded packets |
| A | 0 | 50 | 0 |
| B | 0 | 50 | 0 |
| C | 0 | 50 | 0 |
| D | 0 | 50 | 3 |
| Quadrant | Total seconds | Saturated seconds | Saturation percentage |
|---|---|---|---|
| A | 19324 | 396 | 2.049265% |
| B | 19609 | 341 | 1.738997% |
| C | 19671 | 235 | 1.194652% |
| D | 19559 | 408 | 2.085996% |
Noise dominated data is calculated using 1-second bins in cleaned event files. If a bin has >2000 counts, and if more than 50% of those come from <1% of pixels, then it is considered to be noise-dominated and hence unusable.
| Quadrant | # 1 sec bins | Bins with >0 counts | Bins with >2000 counts | High rate bins dominated by noise | Noise dominated (total time) | Noise dominated (detector-on time) | Marked lightcurve |
|---|---|---|---|---|---|---|---|
| A | 26326 | 20109 | 3 | 3 | 0.01% | 0.01% | 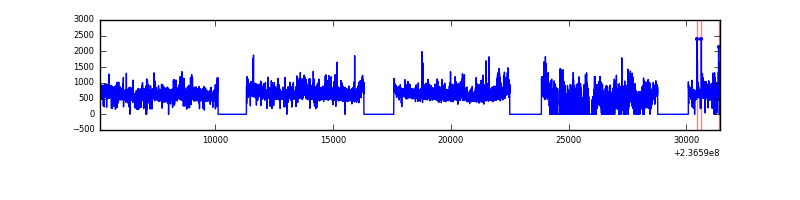 |
| B | 26326 | 20414 | 3 | 3 | 0.01% | 0.01% | 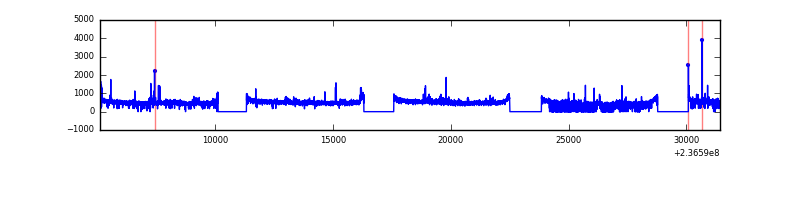 |
| C | 26326 | 20431 | 0 | 0 | 0.00% | 0.00% | 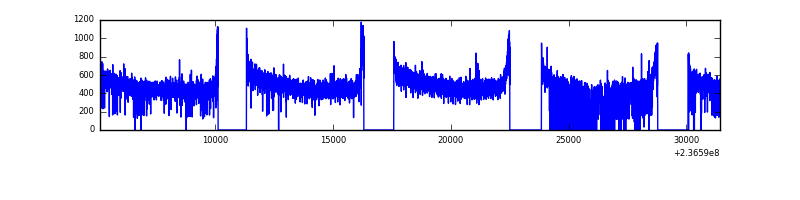 |
| D | 26326 | 20389 | 128 | 128 | 0.49% | 0.63% | 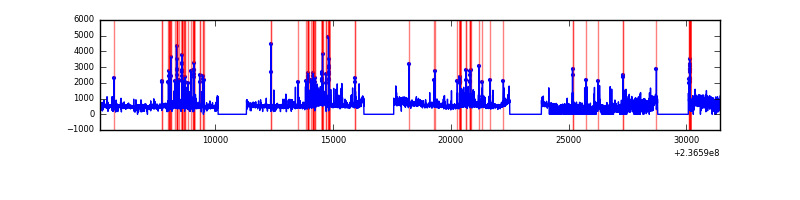 |
Top three noisy pixels from each quadrant. If the there are fewer than three noisy pixels in the level2.evt file, extra rows are filled as -1
| Pixel properties | Quadrant properties | ||||||
|---|---|---|---|---|---|---|---|
| Quadrant | DetID | PixID | Counts | Sigma | Mean | Median | Sigma |
| A | 8 | 5 | 1607408 | 3197.91 | 2511 | 2463 | 501.9 |
| A | 1 | 162 | 598710 | 1188.04 | 2511 | 2463 | 501.9 |
| A | 1 | 178 | 249830 | 492.89 | 2511 | 2463 | 501.9 |
| B | 0 | 214 | 137179 | 285.74 | 2534 | 2480 | 471.4 |
| B | 0 | 219 | 55978 | 113.49 | 2534 | 2480 | 471.4 |
| B | 0 | 187 | 51254 | 103.47 | 2534 | 2480 | 471.4 |
| C | 13 | 61 | 18653 | 29.11 | 2450 | 2470 | 556.0 |
| C | 8 | 222 | 10222 | 13.94 | 2450 | 2470 | 556.0 |
| C | 12 | 4 | 7328 | 8.74 | 2450 | 2470 | 556.0 |
| D | 1 | 52 | 1165283 | 1920.41 | 2432 | 2372 | 605.6 |
| D | 8 | 195 | 601289 | 989.04 | 2432 | 2372 | 605.6 |
| D | 12 | 233 | 532173 | 874.9 | 2432 | 2372 | 605.6 |
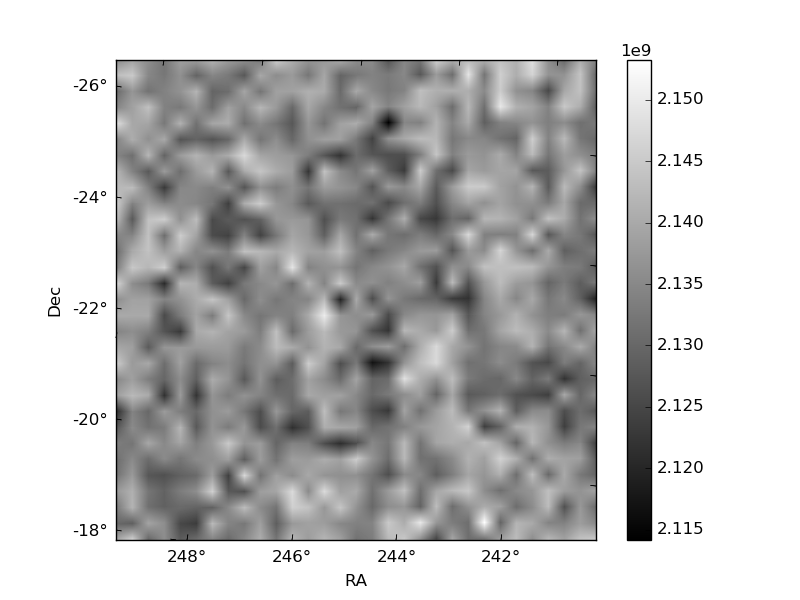
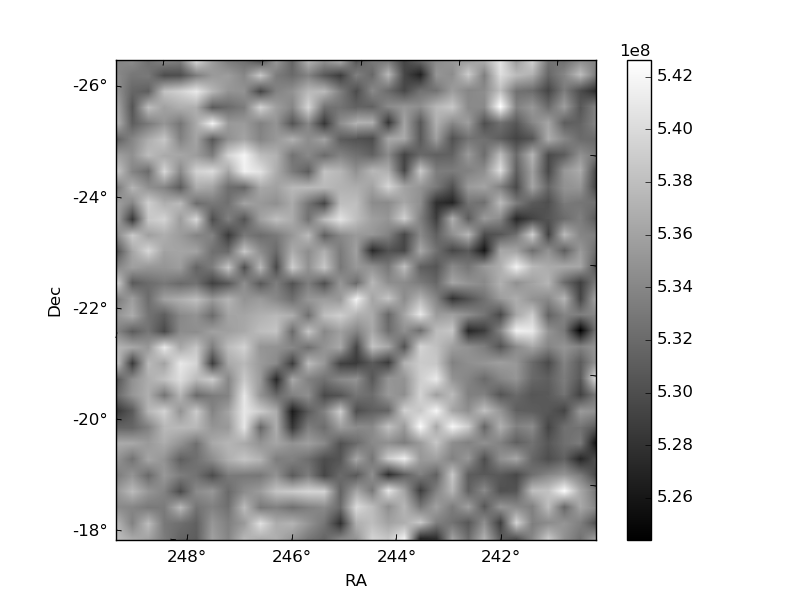
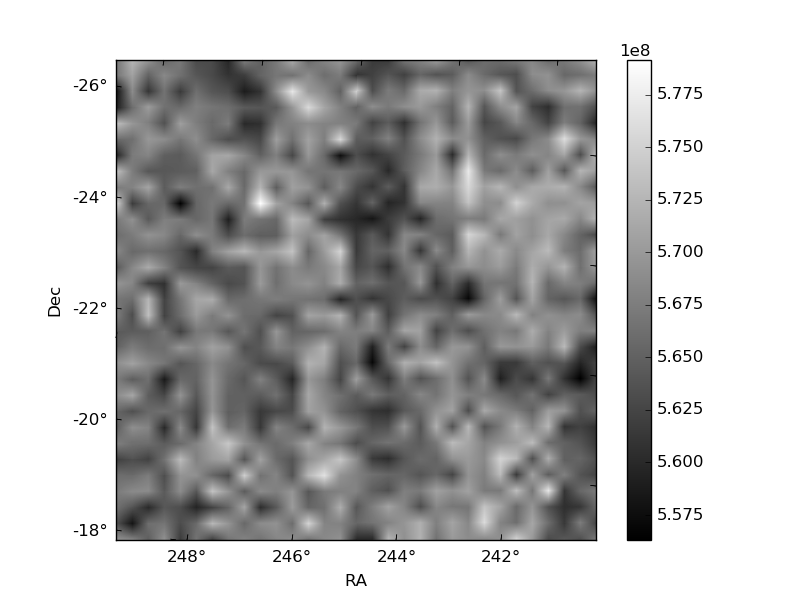
Histogram calculated using DETX and DETY for each event in the final _common_clean file
| Quadrant A | 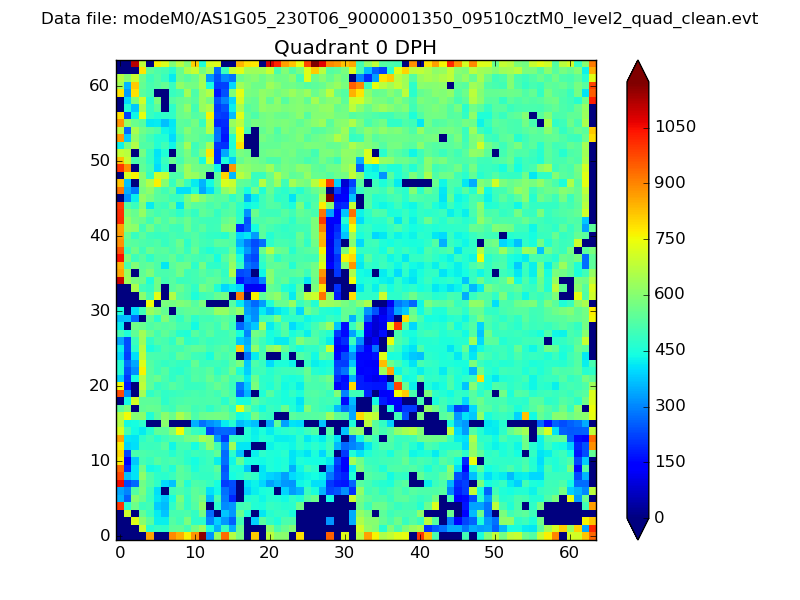 |
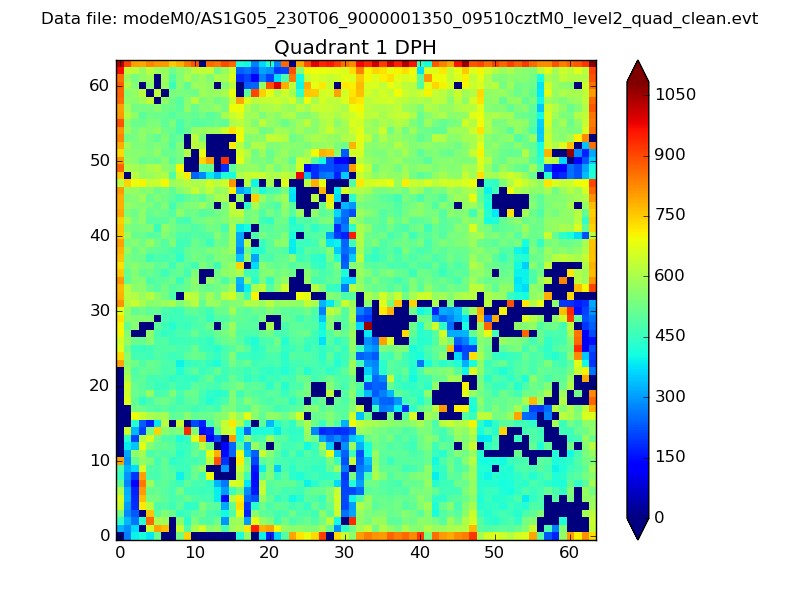 |
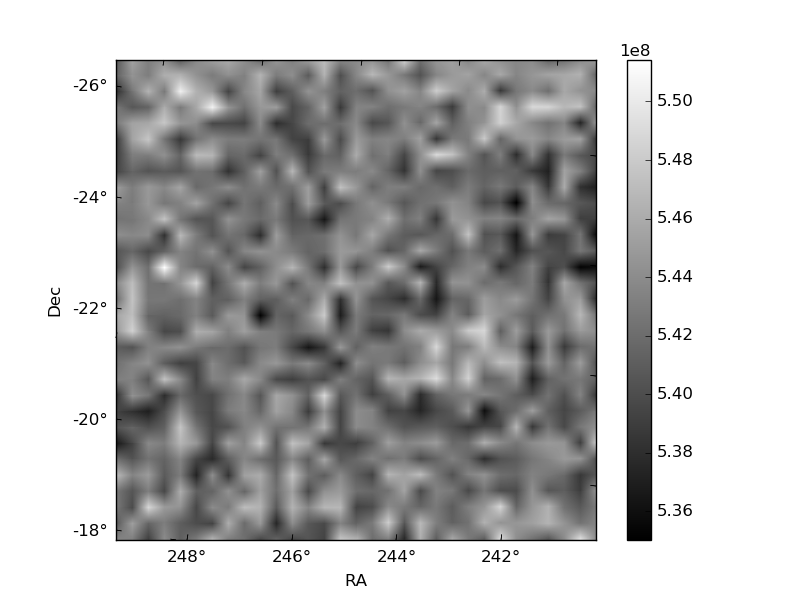
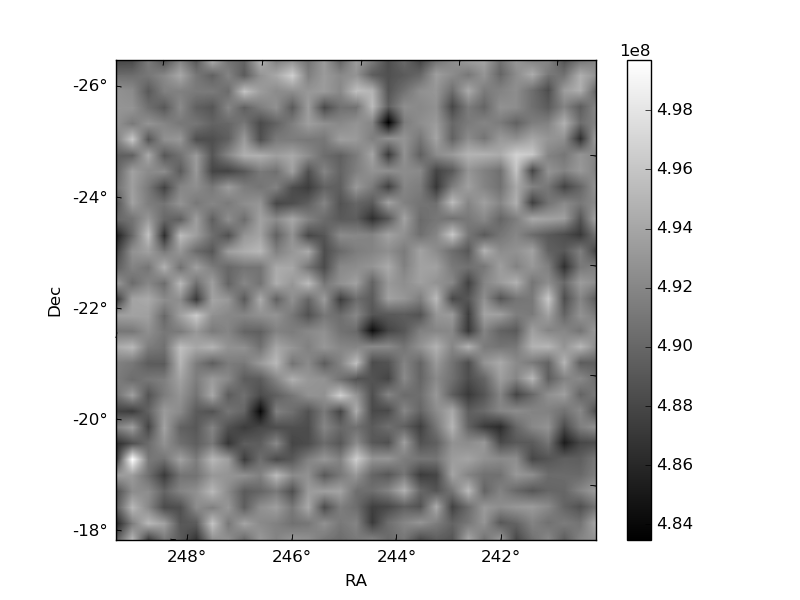
Quadrant B |
|---|---|---|---|
| Quadrant D | 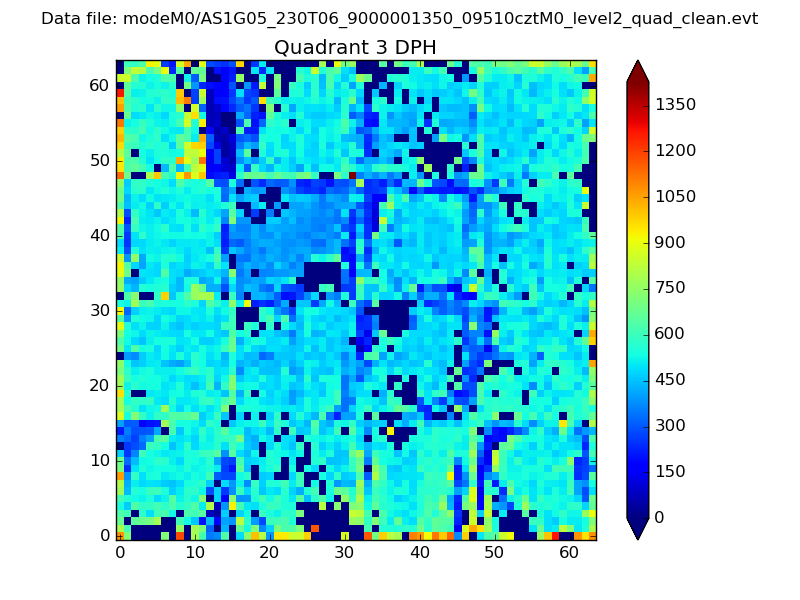 |
 |
Quadrant C |
| Plot type | Count rate plots | Images |
|---|---|---|
| Comparison with Poisson distribution Blue bars denote a histogram of data divided into 1 sec bins. Red curve is a Poisson curve with rate = median count rate of data. |
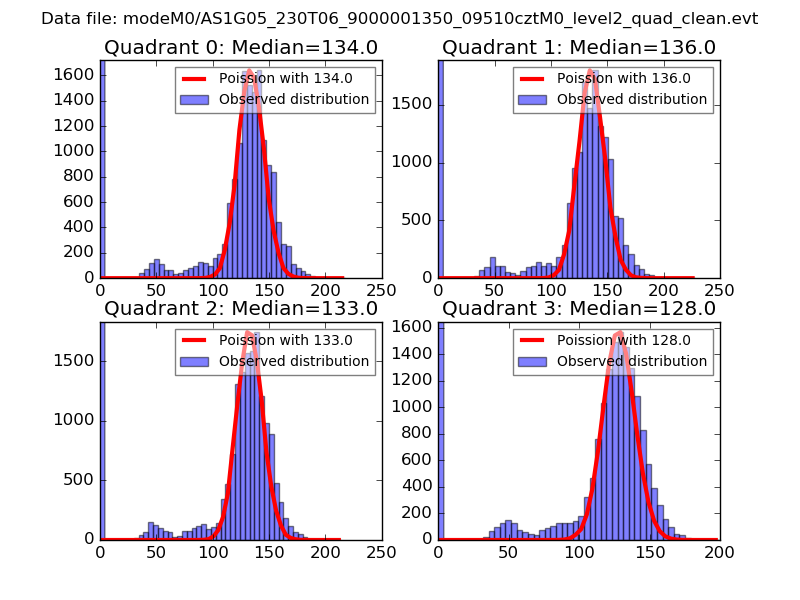 |
 |
| Quadrant-wise count rates Data is divided into 100 sec bins |
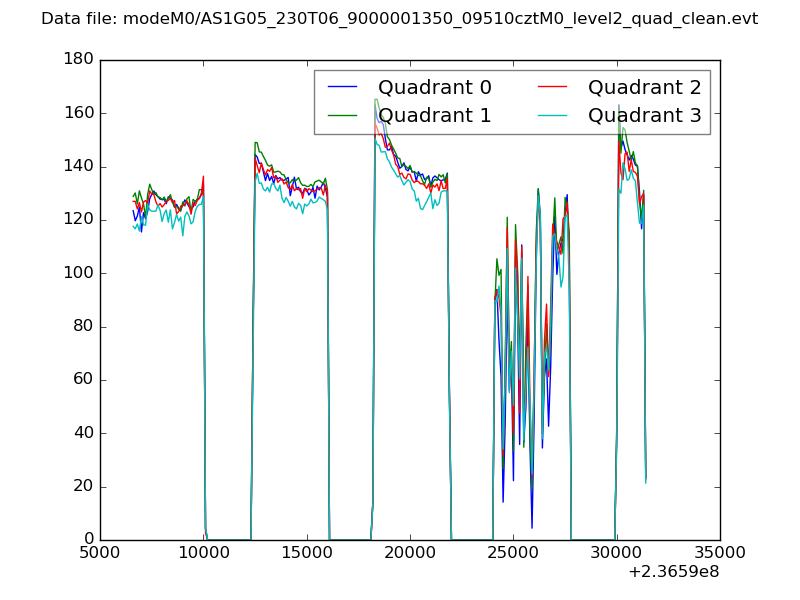 |
|
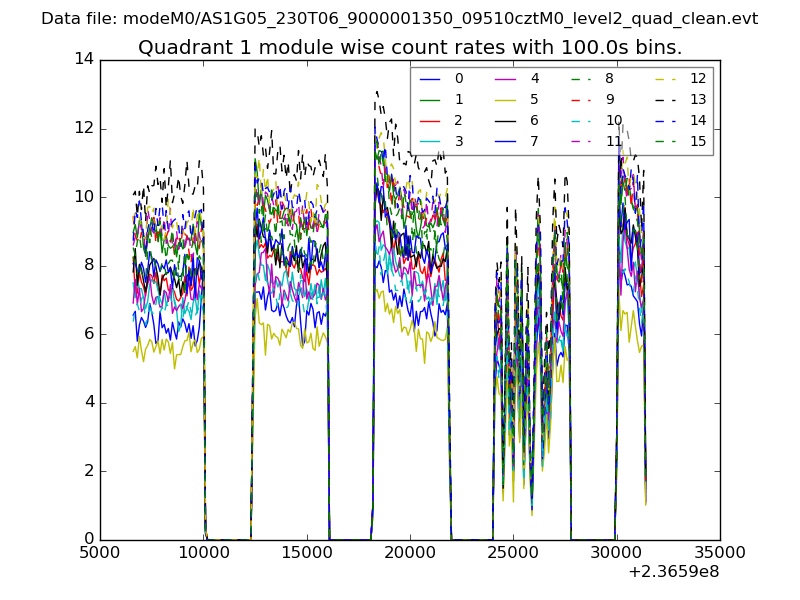
| Module-wise count rates for Quadrant A Data is divided into 100 sec bins |
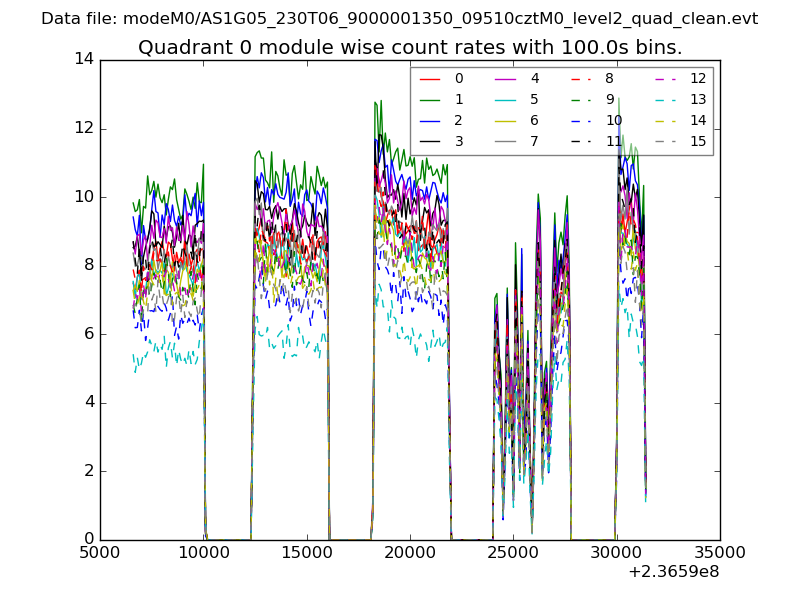 |
 |
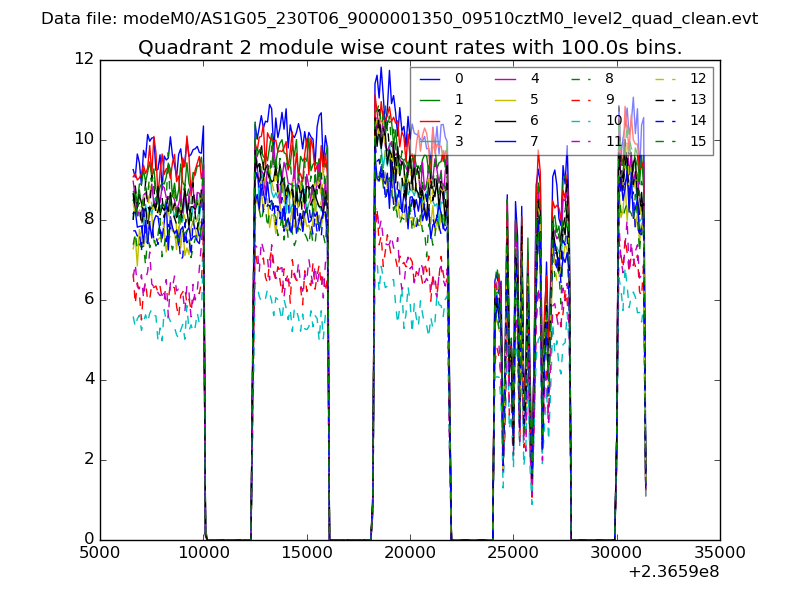
| Module-wise count rates for Quadrant B Data is divided into 100 sec bins |
 |
 |
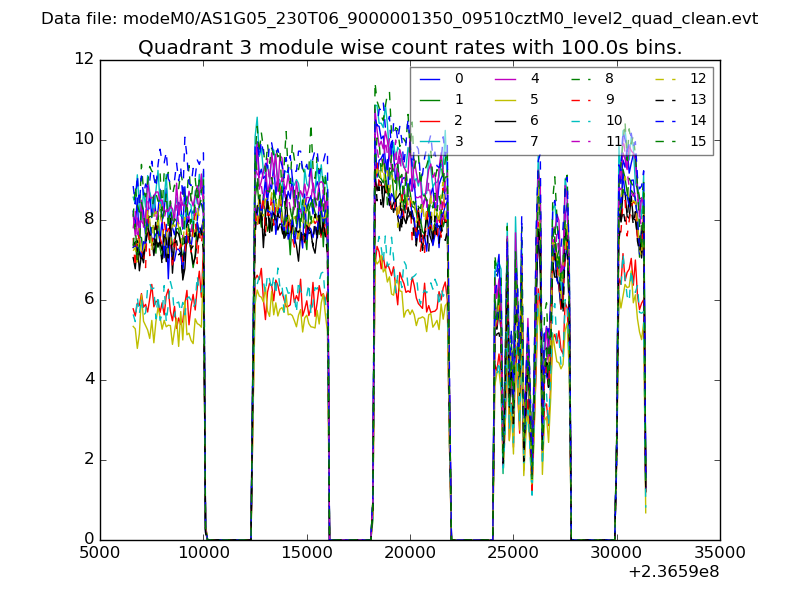
| Module-wise count rates for Quadrant C Data is divided into 100 sec bins |
 |
 |
| Module-wise count rates for Quadrant D Data is divided into 100 sec bins |
 |
 |
| Parameter | Plot |
|---|---|
| CZT HV Monitor | 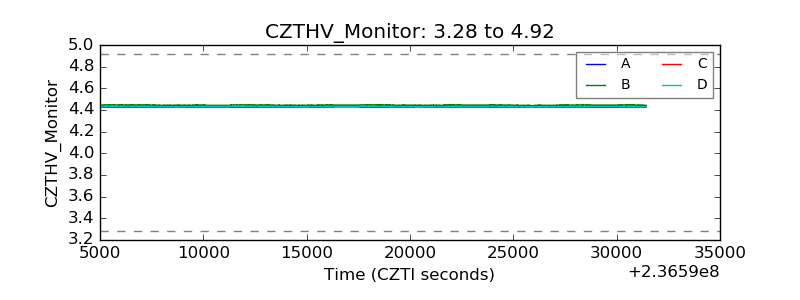 |
| D_VDD | 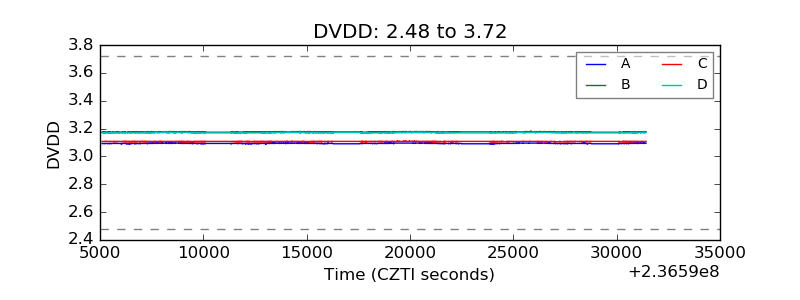 |
| Temperature 1 |  |
| Veto HV Monitor | 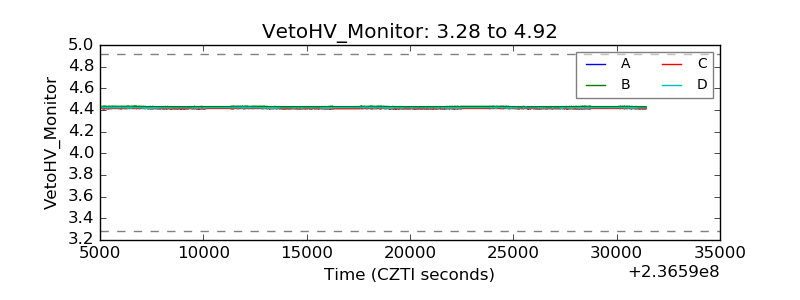 |
| Veto LLD | 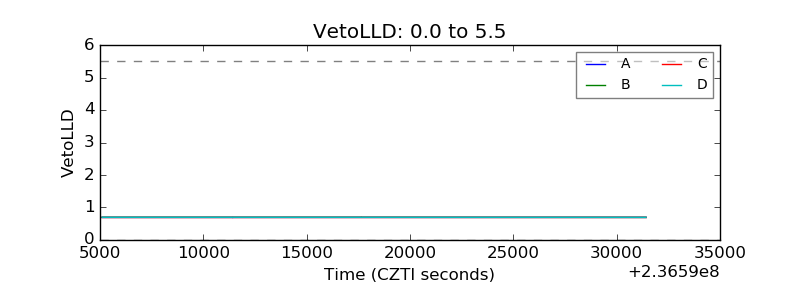 |
| Alpha Counter | 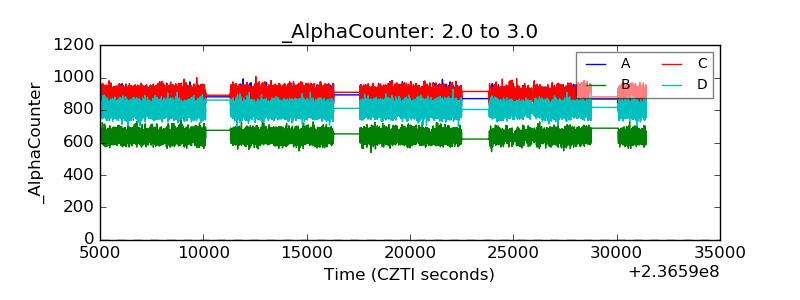 |
| _CPM_Rate | 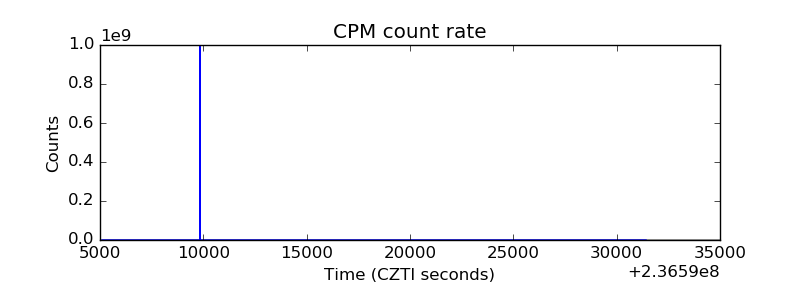 |
| CZT Counter |  |
| +2.5 Volts monitor | 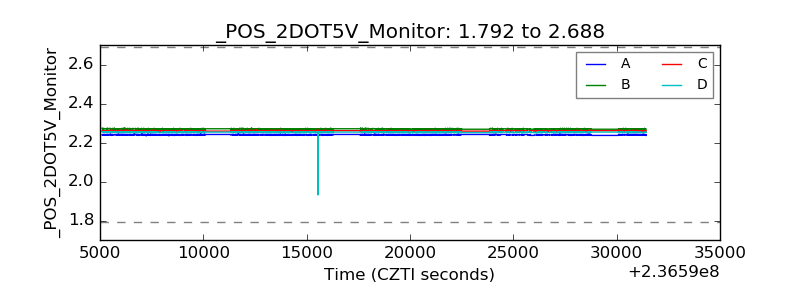 |
| +5 Volts monitor |  |
| _ROLL_ROT | 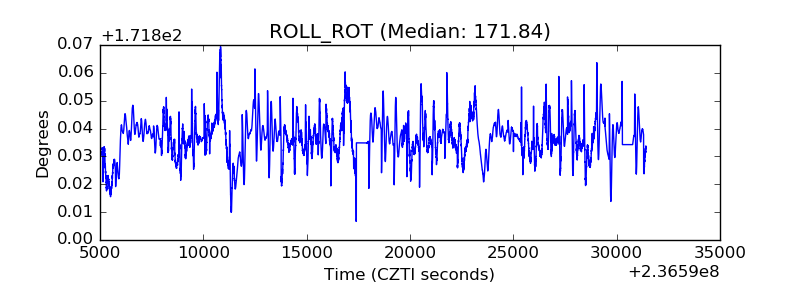 |
| _Roll_DEC | 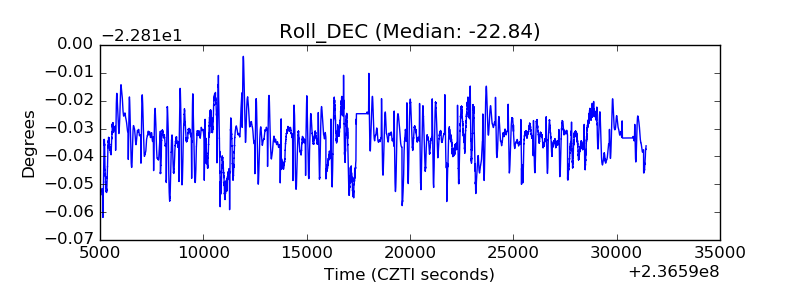 |
| _Roll_RA | 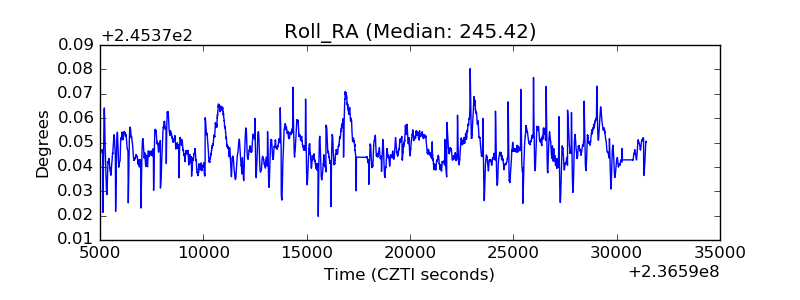 |
| Veto Counter | 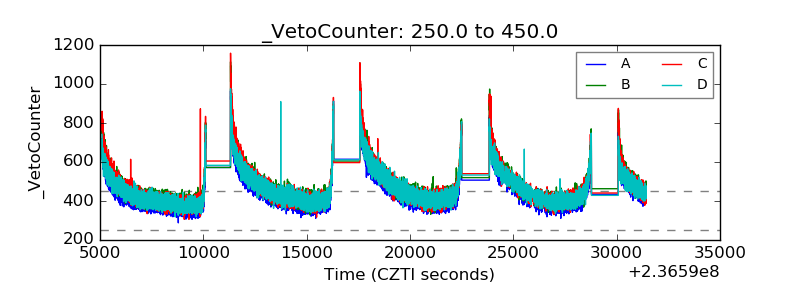 |