| Param | Original file | Final file |
|---|---|---|
| Filename | modeM0/AS1G05_230T06_9000001350_09511cztM0_level2.evt | modeM0/AS1G05_230T06_9000001350_09511cztM0_level2_quad_clean.evt |
| Size (bytes) | 518,351,040 | 103,772,160 |
| Size | 494.3 MB | 99.0 MB |
| Events in quadrant A | 4,438,041 | 680,731 |
| Events in quadrant B | 3,408,525 | 685,689 |
| Events in quadrant C | 3,123,905 | 670,222 |
| Events in quadrant D | 4,277,675 | 643,521 |
| Mode M0 | |||
|---|---|---|---|
| Quadrant | BADHDUFLAG | Total packets | Discarded packets |
| A | 0 | 17785 | 3 |
| B | 0 | 14296 | 2 |
| C | 0 | 13748 | 2 |
| D | 0 | 17190 | 2 |
| Mode SS | |||
|---|---|---|---|
| Quadrant | BADHDUFLAG | Total packets | Discarded packets |
| A | 0 | 136 | 0 |
| B | 0 | 136 | 0 |
| C | 0 | 136 | 0 |
| D | 0 | 136 | 0 |
| Mode M9 | |||
|---|---|---|---|
| Quadrant | BADHDUFLAG | Total packets | Discarded packets |
| A | 0 | 11 | 0 |
| B | 0 | 11 | 0 |
| C | 0 | 11 | 0 |
| D | 0 | 11 | 0 |
| Quadrant | Total seconds | Saturated seconds | Saturation percentage |
|---|---|---|---|
| A | 6631 | 231 | 3.483637% |
| B | 6631 | 94 | 1.417584% |
| C | 6631 | 46 | 0.693711% |
| D | 6632 | 182 | 2.744270% |
Noise dominated data is calculated using 1-second bins in cleaned event files. If a bin has >2000 counts, and if more than 50% of those come from <1% of pixels, then it is considered to be noise-dominated and hence unusable.
| Quadrant | # 1 sec bins | Bins with >0 counts | Bins with >2000 counts | High rate bins dominated by noise | Noise dominated (total time) | Noise dominated (detector-on time) | Marked lightcurve |
|---|---|---|---|---|---|---|---|
| A | 7716 | 6632 | 13 | 13 | 0.17% | 0.20% | 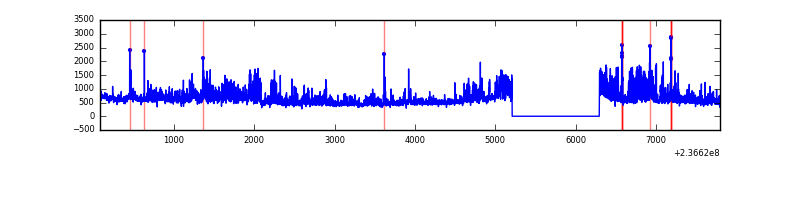 |
| B | 7716 | 6632 | 3 | 3 | 0.04% | 0.05% | 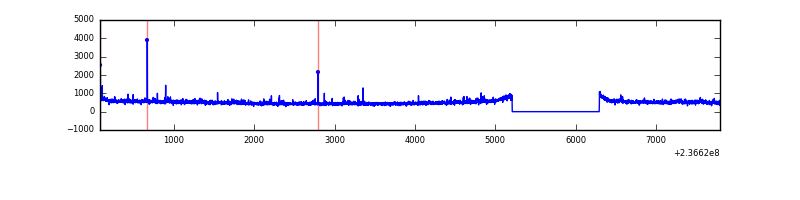 |
| C | 7716 | 6632 | 2 | 2 | 0.03% | 0.03% | 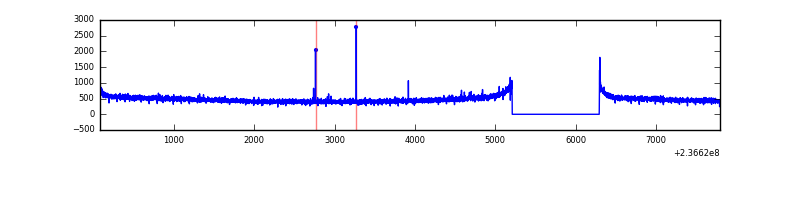 |
| D | 7717 | 6633 | 100 | 100 | 1.30% | 1.51% |  |
Top three noisy pixels from each quadrant. If the there are fewer than three noisy pixels in the level2.evt file, extra rows are filled as -1
| Pixel properties | Quadrant properties | ||||||
|---|---|---|---|---|---|---|---|
| Quadrant | DetID | PixID | Counts | Sigma | Mean | Median | Sigma |
| A | 8 | 5 | 902430 | 5330.37 | 832 | 816 | 169.1 |
| A | 1 | 162 | 157603 | 926.93 | 832 | 816 | 169.1 |
| A | 1 | 178 | 63479 | 370.47 | 832 | 816 | 169.1 |
| B | 0 | 214 | 83742 | 522.49 | 829 | 809 | 158.7 |
| B | 0 | 219 | 50450 | 312.74 | 829 | 809 | 158.7 |
| B | 10 | 247 | 16449 | 98.53 | 829 | 809 | 158.7 |
| C | 13 | 61 | 5922 | 27.68 | 797 | 802 | 185.0 |
| C | 1 | 0 | 4898 | 22.14 | 797 | 802 | 185.0 |
| C | 12 | 4 | 4808 | 21.65 | 797 | 802 | 185.0 |
| D | 1 | 52 | 565083 | 2722.57 | 796 | 778 | 207.3 |
| D | 7 | 71 | 224067 | 1077.29 | 796 | 778 | 207.3 |
| D | 12 | 233 | 133143 | 638.61 | 796 | 778 | 207.3 |
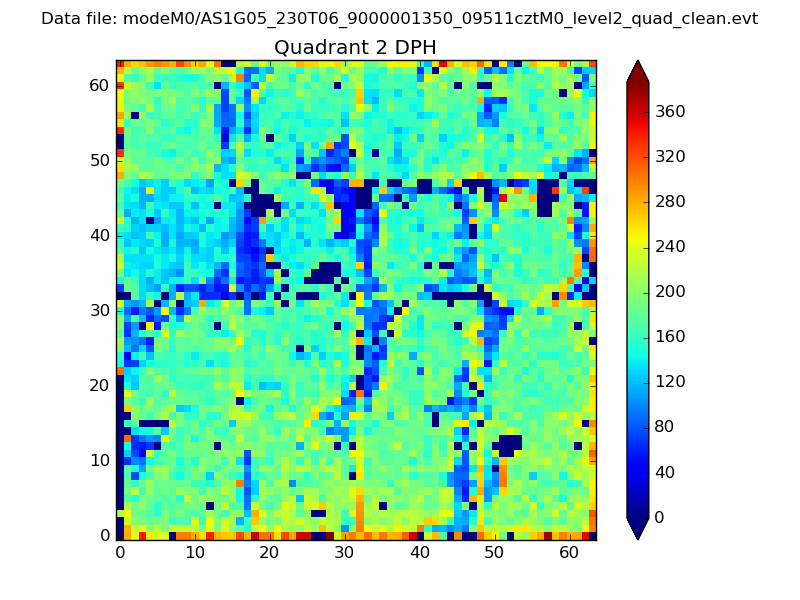
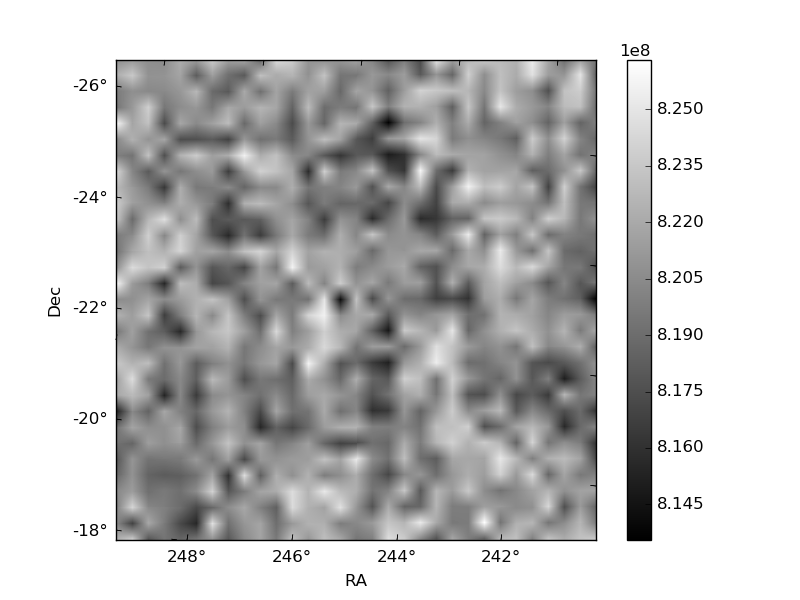
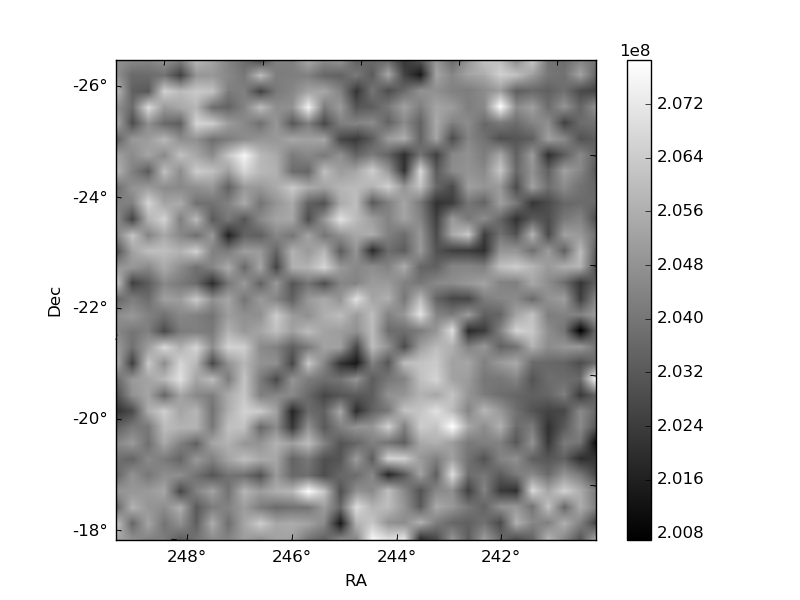
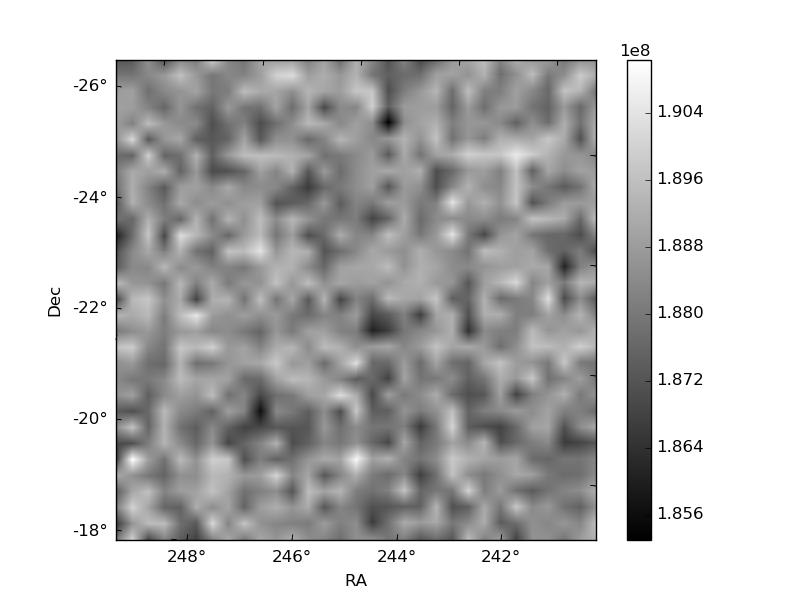
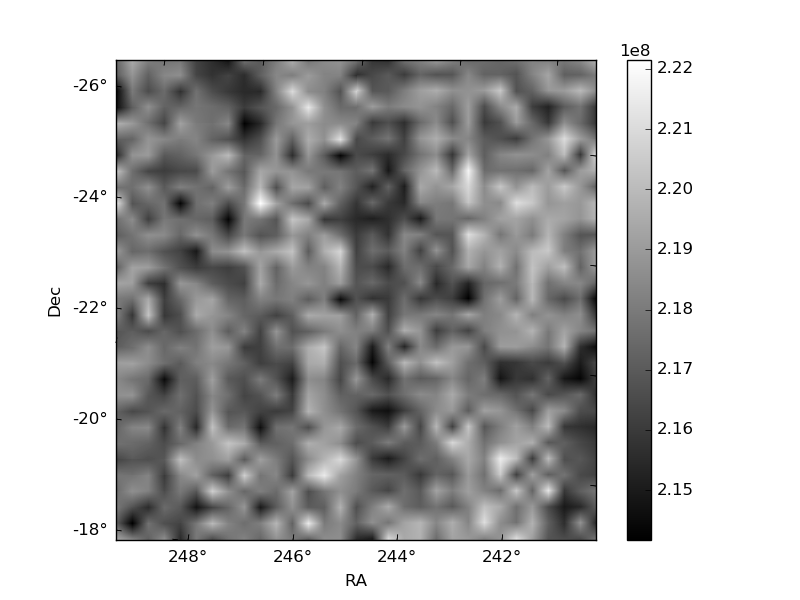
Histogram calculated using DETX and DETY for each event in the final _common_clean file
| Quadrant A | 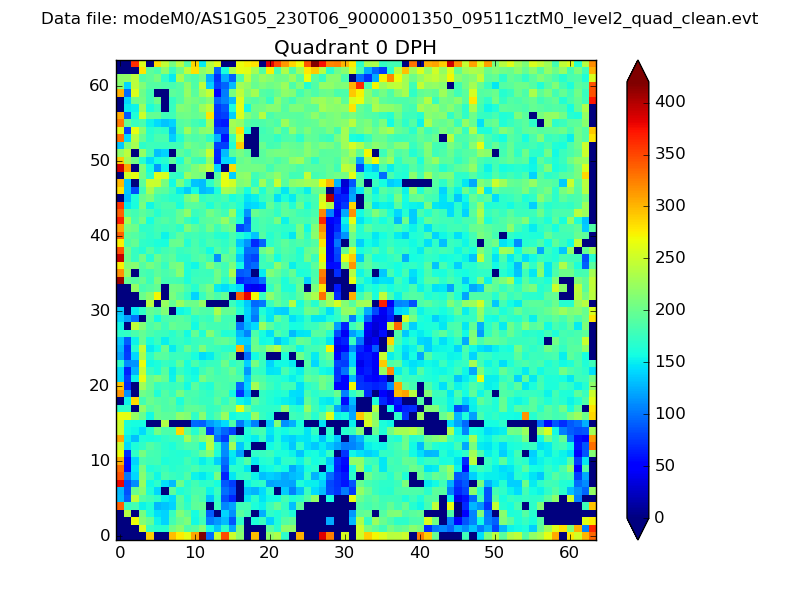 |
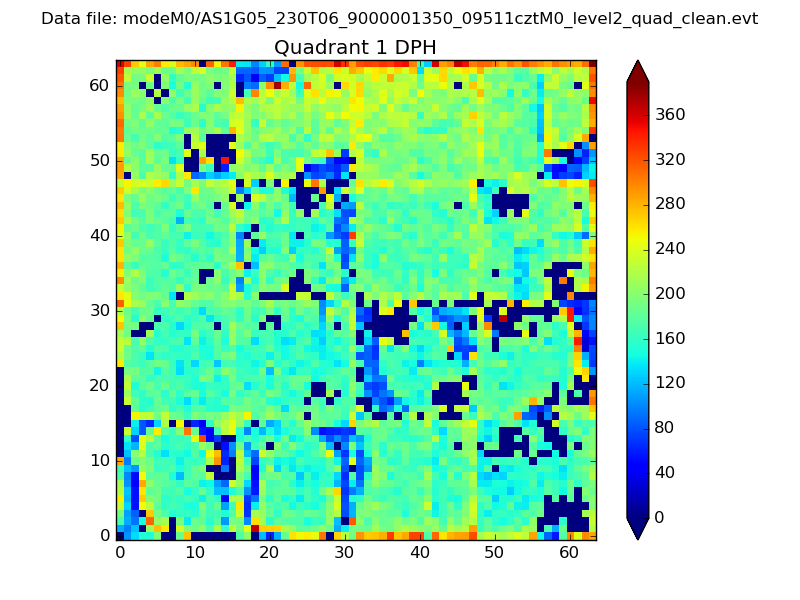 |
Quadrant B |
|---|---|---|---|
| Quadrant D | 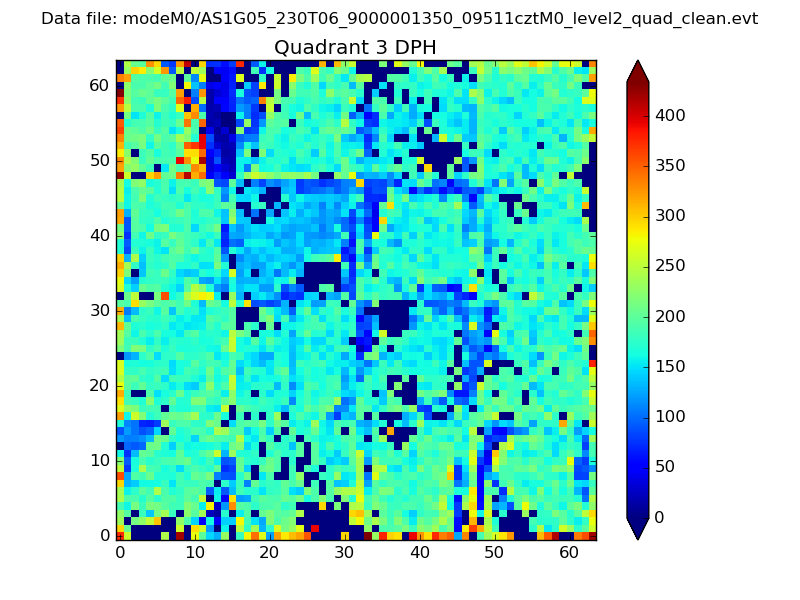 |
 |
Quadrant C |
| Plot type | Count rate plots | Images |
|---|---|---|
| Comparison with Poisson distribution Blue bars denote a histogram of data divided into 1 sec bins. Red curve is a Poisson curve with rate = median count rate of data. |
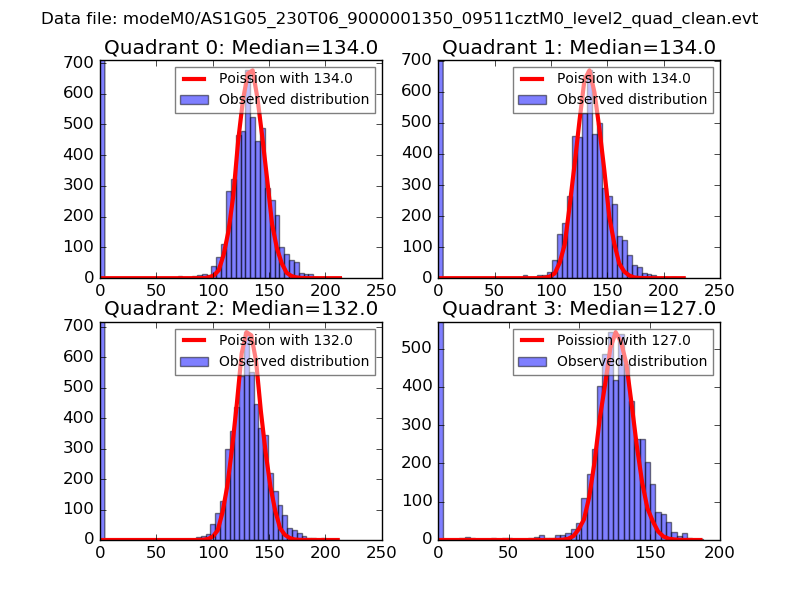 |
 |
| Quadrant-wise count rates Data is divided into 100 sec bins |
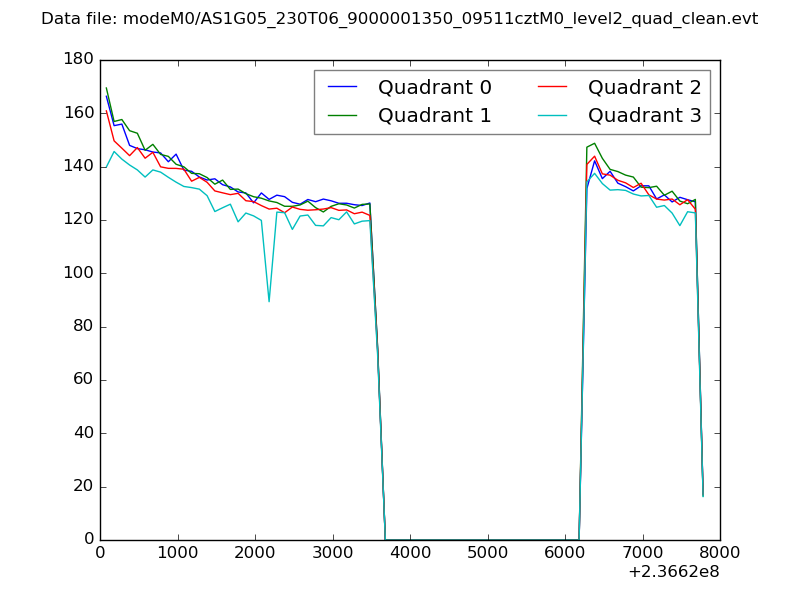 |
|
| Module-wise count rates for Quadrant A Data is divided into 100 sec bins |
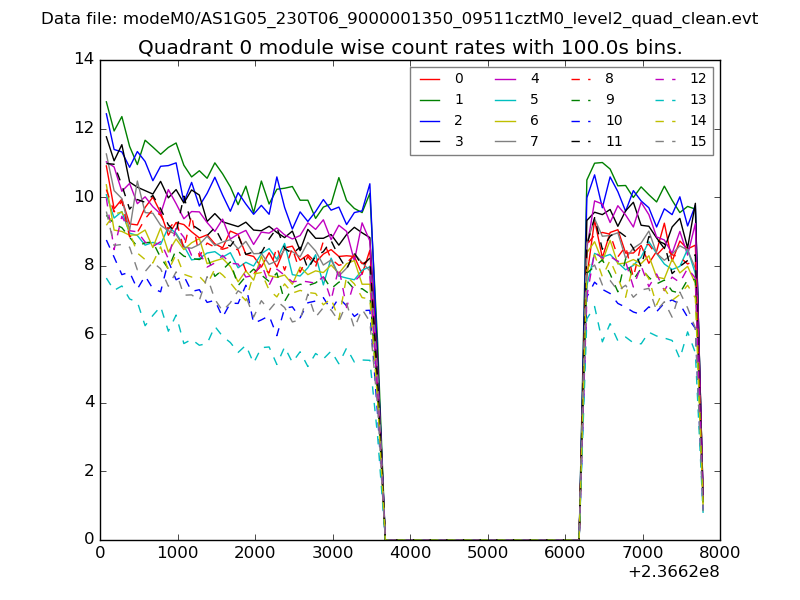 |
 |
| Module-wise count rates for Quadrant B Data is divided into 100 sec bins |
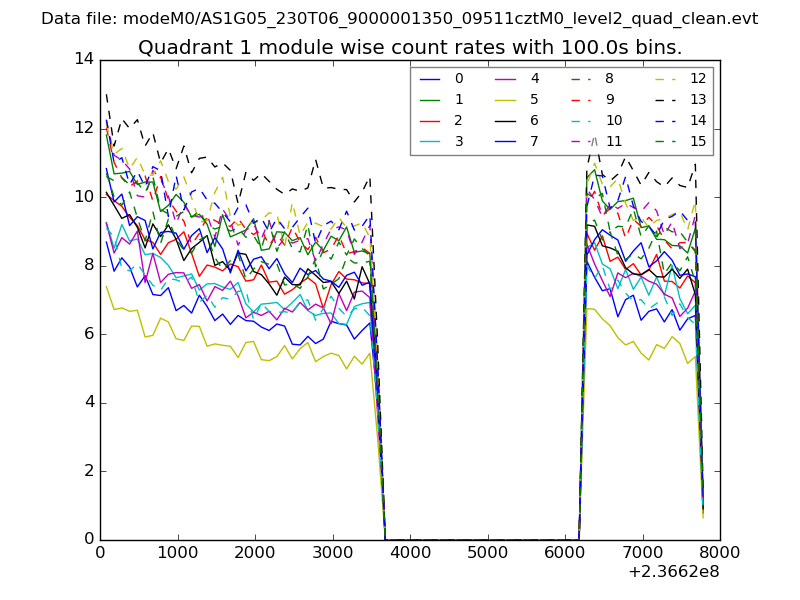 |
 |
| Module-wise count rates for Quadrant C Data is divided into 100 sec bins |
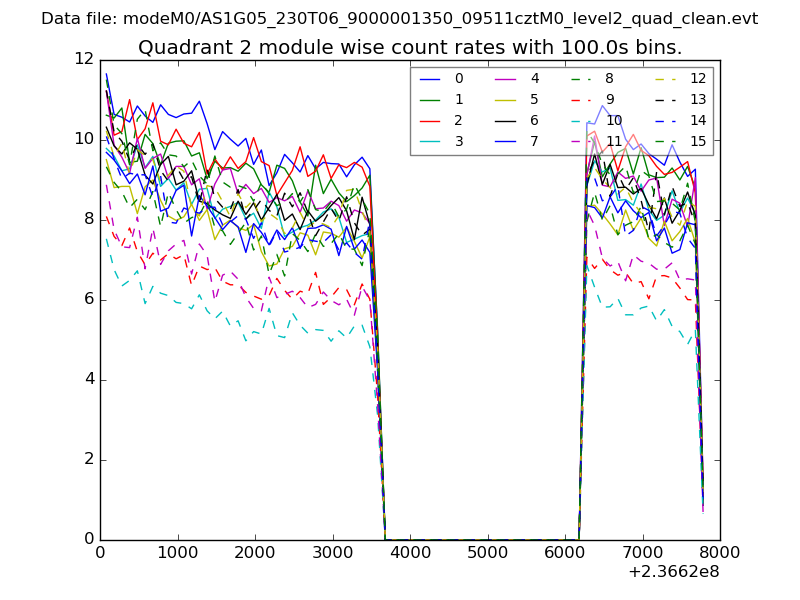 |
 |
| Module-wise count rates for Quadrant D Data is divided into 100 sec bins |
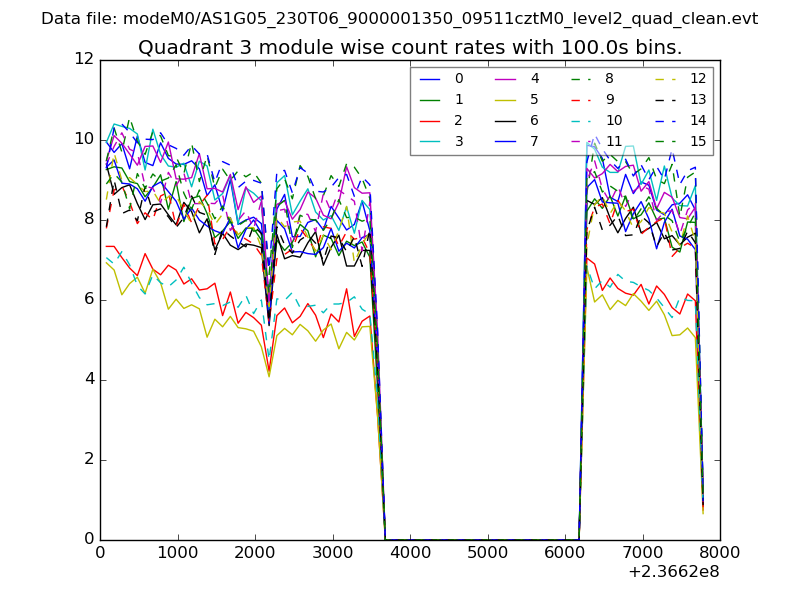 |
 |
| Parameter | Plot |
|---|---|
| CZT HV Monitor | 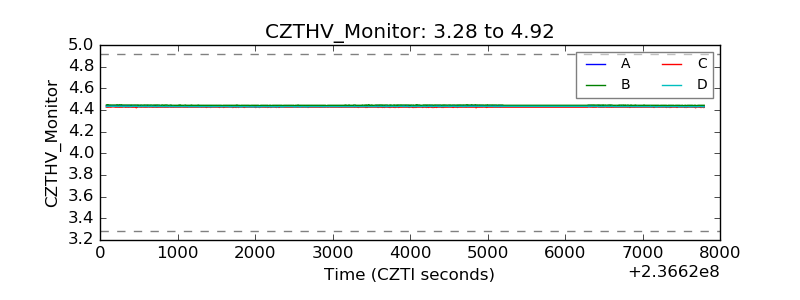 |
| D_VDD | 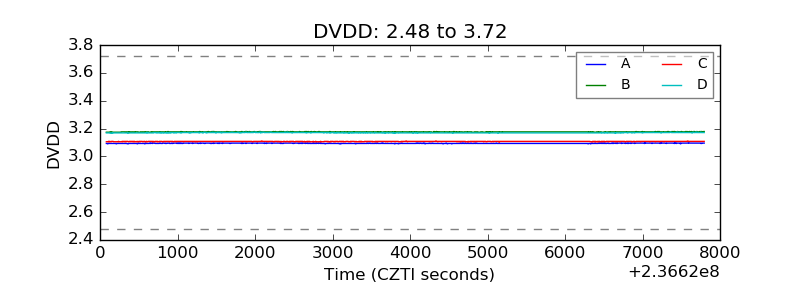 |
| Temperature 1 | 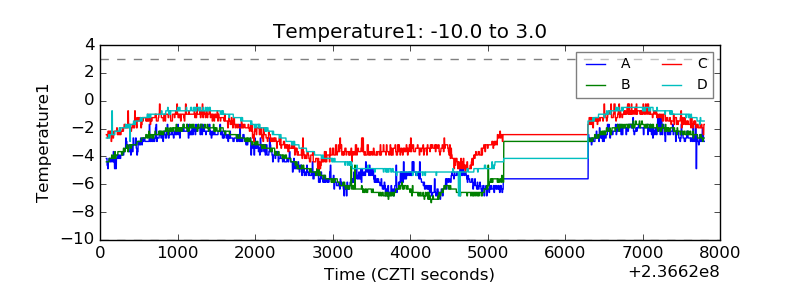 |
| Veto HV Monitor |  |
| Veto LLD | 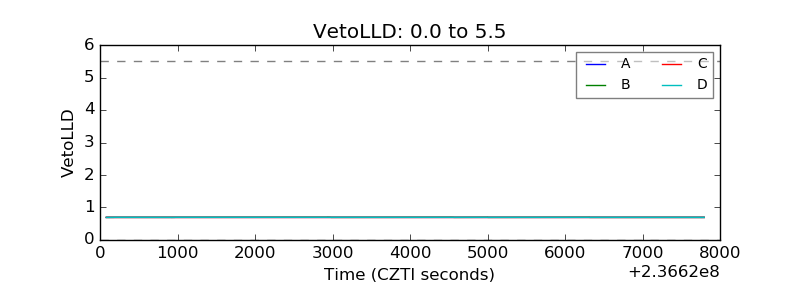 |
| Alpha Counter | 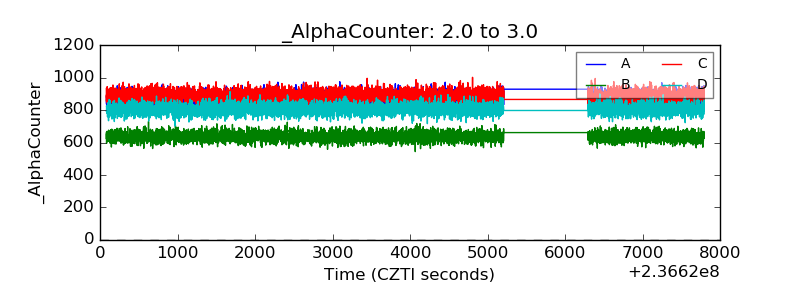 |
| _CPM_Rate | 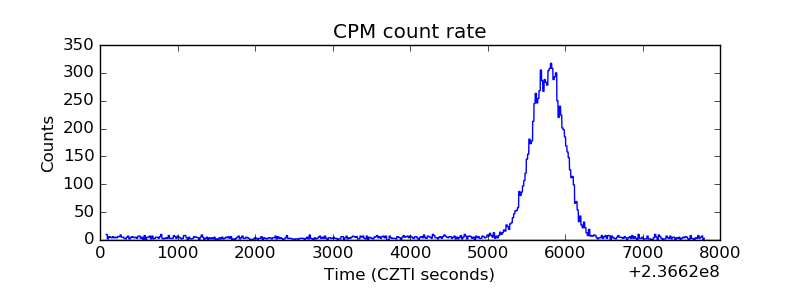 |
| CZT Counter | 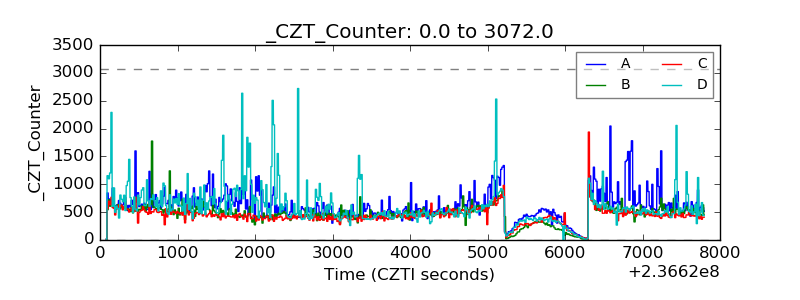 |
| +2.5 Volts monitor |  |
| +5 Volts monitor |  |
| _ROLL_ROT | 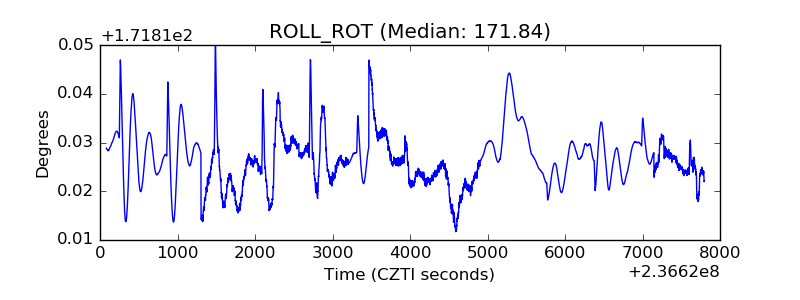 |
| _Roll_DEC | 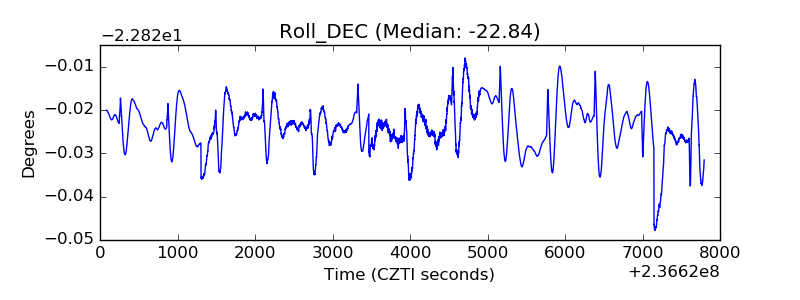 |
| _Roll_RA | 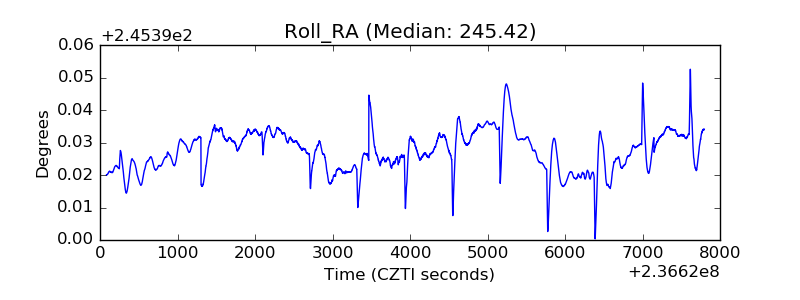 |
| Veto Counter | 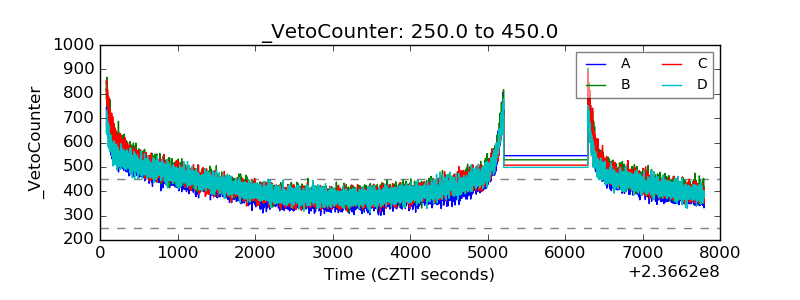 |