| Param | Original file | Final file |
|---|---|---|
| Filename | modeM0/AS1G05_230T06_9000001350_09512cztM0_level2.evt | modeM0/AS1G05_230T06_9000001350_09512cztM0_level2_quad_clean.evt |
| Size (bytes) | 529,392,960 | 98,706,240 |
| Size | 504.9 MB | 94.1 MB |
| Events in quadrant A | 4,467,754 | 627,617 |
| Events in quadrant B | 3,551,984 | 637,205 |
| Events in quadrant C | 3,321,186 | 623,619 |
| Events in quadrant D | 4,208,106 | 604,146 |
| Mode M0 | |||
|---|---|---|---|
| Quadrant | BADHDUFLAG | Total packets | Discarded packets |
| A | 0 | 17993 | 3 |
| B | 0 | 15130 | 7 |
| C | 0 | 14876 | 2 |
| D | 0 | 17360 | 4 |
| Mode SS | |||
|---|---|---|---|
| Quadrant | BADHDUFLAG | Total packets | Discarded packets |
| A | 0 | 144 | 0 |
| B | 0 | 144 | 0 |
| C | 0 | 144 | 0 |
| D | 0 | 144 | 0 |
| Mode M9 | |||
|---|---|---|---|
| Quadrant | BADHDUFLAG | Total packets | Discarded packets |
| A | 0 | 19 | 0 |
| B | 0 | 19 | 0 |
| C | 0 | 19 | 0 |
| D | 0 | 19 | 0 |
| Quadrant | Total seconds | Saturated seconds | Saturation percentage |
|---|---|---|---|
| A | 7142 | 184 | 2.576309% |
| B | 7140 | 99 | 1.386555% |
| C | 7142 | 57 | 0.798096% |
| D | 7141 | 102 | 1.428371% |
Noise dominated data is calculated using 1-second bins in cleaned event files. If a bin has >2000 counts, and if more than 50% of those come from <1% of pixels, then it is considered to be noise-dominated and hence unusable.
| Quadrant | # 1 sec bins | Bins with >0 counts | Bins with >2000 counts | High rate bins dominated by noise | Noise dominated (total time) | Noise dominated (detector-on time) | Marked lightcurve |
|---|---|---|---|---|---|---|---|
| A | 8947 | 7144 | 12 | 12 | 0.13% | 0.17% | 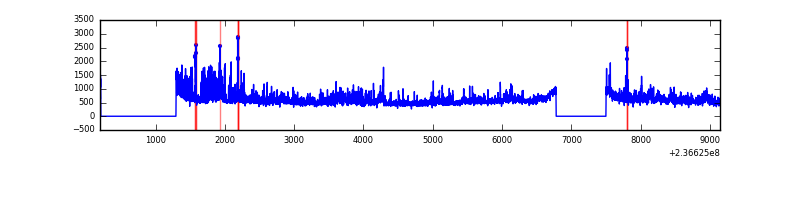 |
| B | 8947 | 7144 | 2 | 2 | 0.02% | 0.03% | 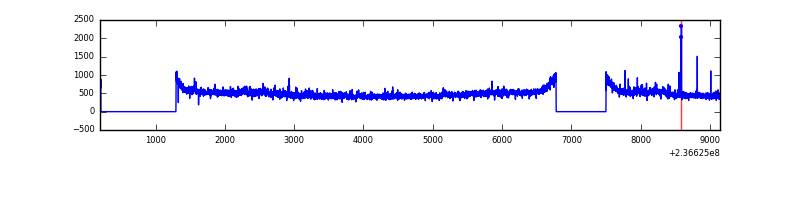 |
| C | 8947 | 7144 | 0 | 0 | 0.00% | 0.00% | 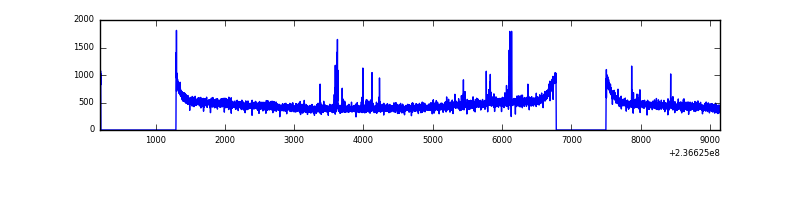 |
| D | 8947 | 7144 | 45 | 45 | 0.50% | 0.63% | 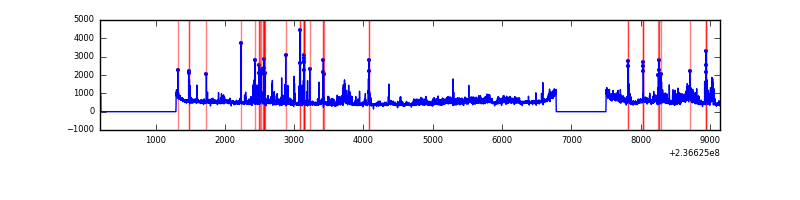 |
Top three noisy pixels from each quadrant. If the there are fewer than three noisy pixels in the level2.evt file, extra rows are filled as -1
| Pixel properties | Quadrant properties | ||||||
|---|---|---|---|---|---|---|---|
| Quadrant | DetID | PixID | Counts | Sigma | Mean | Median | Sigma |
| A | 8 | 5 | 899184 | 5062.19 | 873 | 854 | 177.5 |
| A | 1 | 162 | 104953 | 586.61 | 873 | 854 | 177.5 |
| A | 1 | 178 | 37455 | 206.25 | 873 | 854 | 177.5 |
| B | 0 | 219 | 69899 | 409.87 | 872 | 851 | 168.5 |
| B | 0 | 214 | 51635 | 301.45 | 872 | 851 | 168.5 |
| B | 12 | 111 | 17588 | 99.35 | 872 | 851 | 168.5 |
| C | 4 | 254 | 43385 | 218.5 | 837 | 842 | 194.7 |
| C | 13 | 61 | 6333 | 28.2 | 837 | 842 | 194.7 |
| C | 14 | 234 | 5548 | 24.17 | 837 | 842 | 194.7 |
| D | 1 | 52 | 314950 | 1447.15 | 837 | 817 | 217.1 |
| D | 7 | 71 | 186482 | 855.32 | 837 | 817 | 217.1 |
| D | 2 | 16 | 176229 | 808.09 | 837 | 817 | 217.1 |
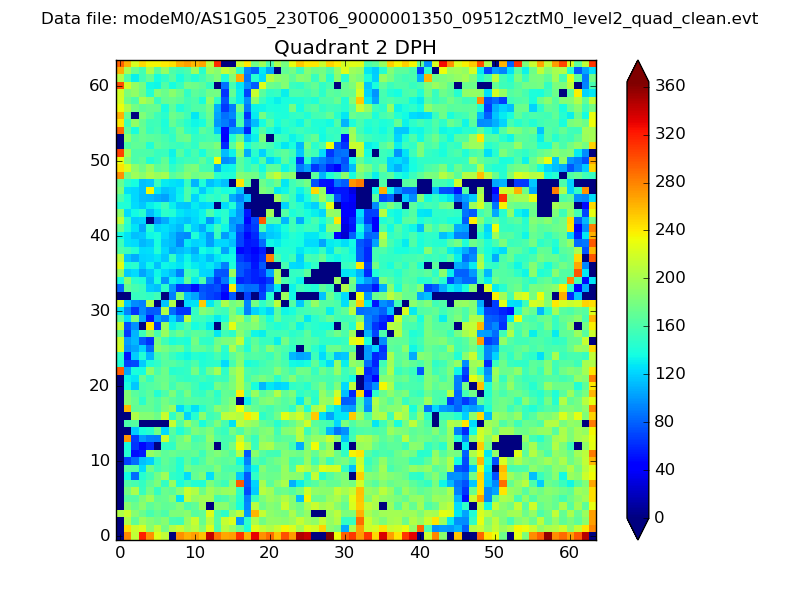
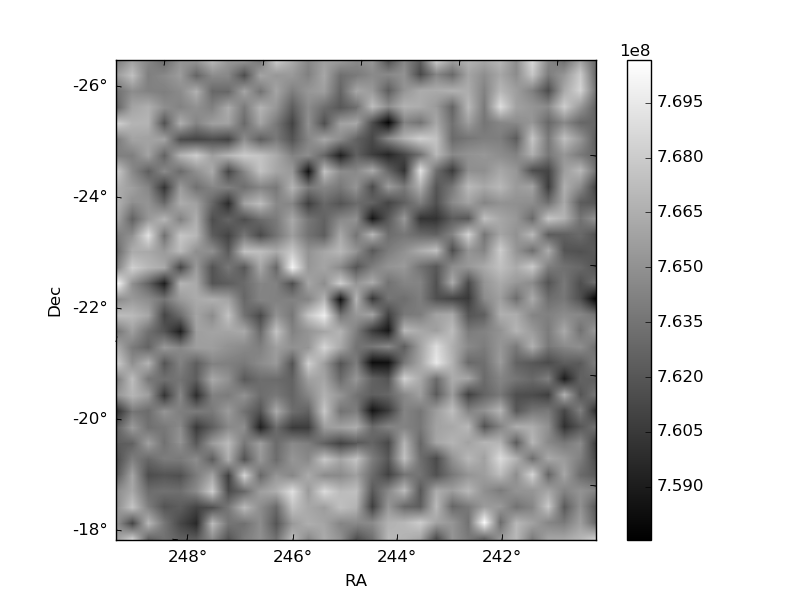
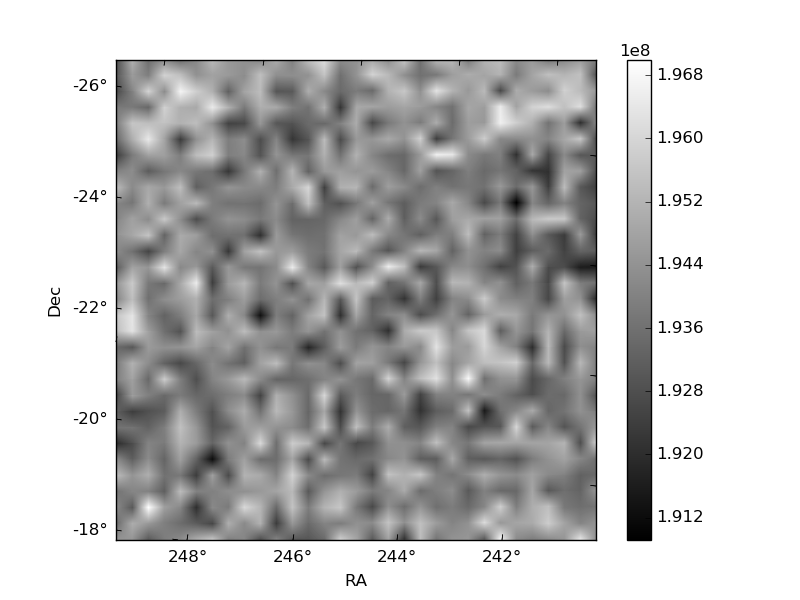
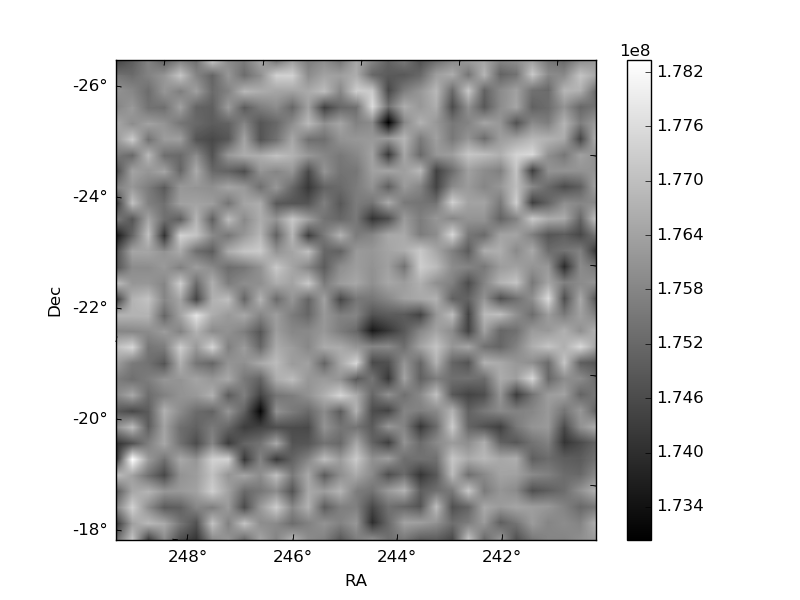
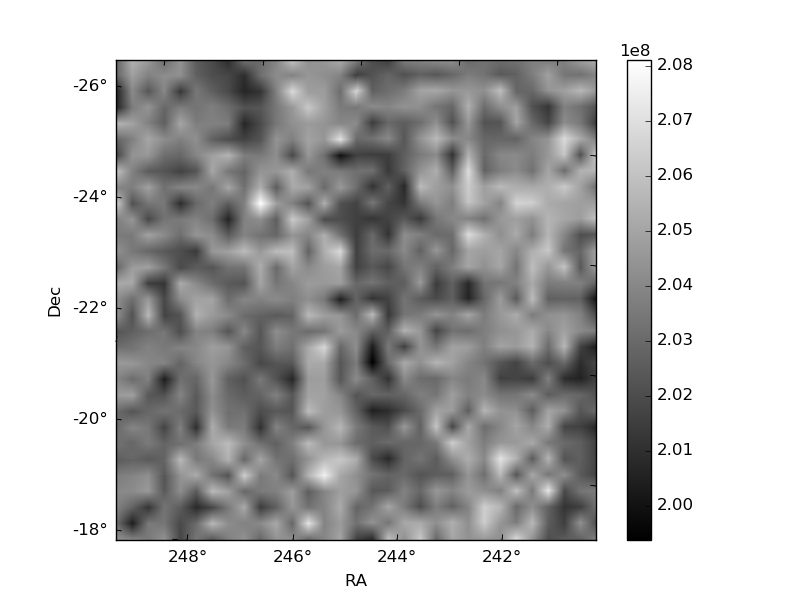
Histogram calculated using DETX and DETY for each event in the final _common_clean file
| Quadrant A | 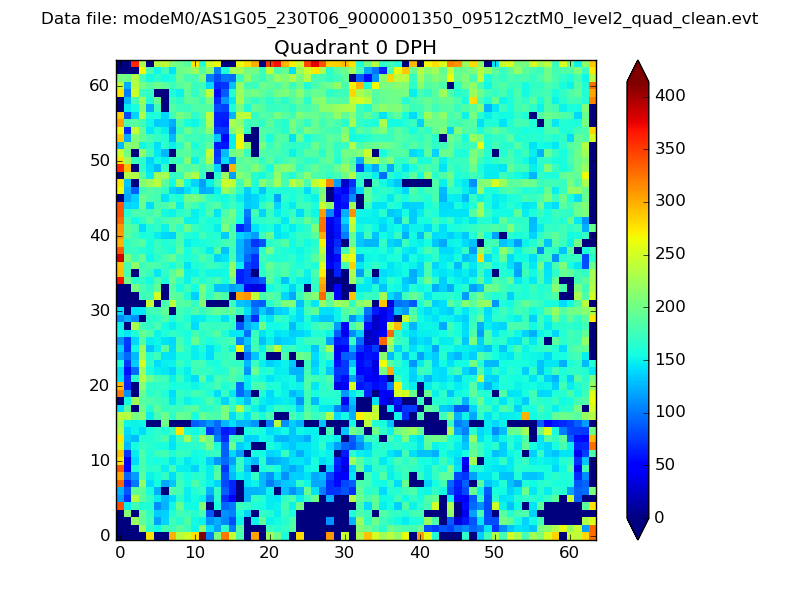 |
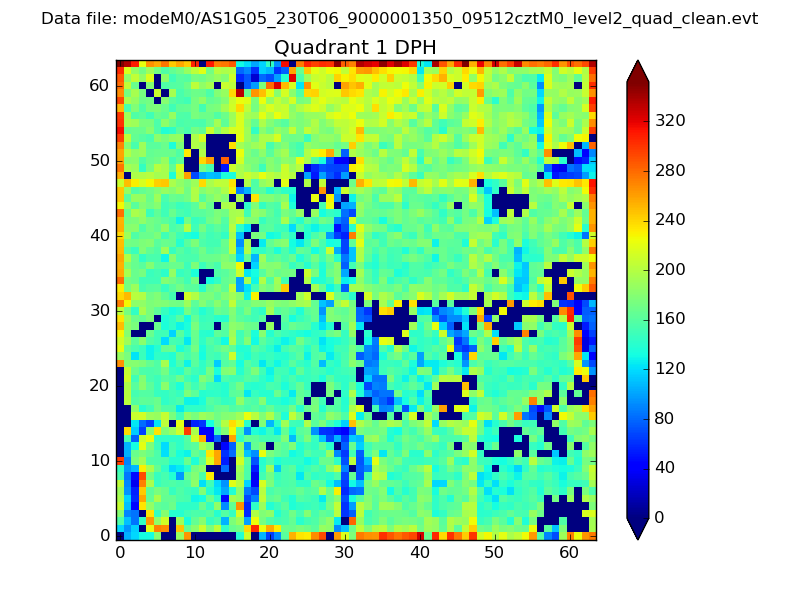 |
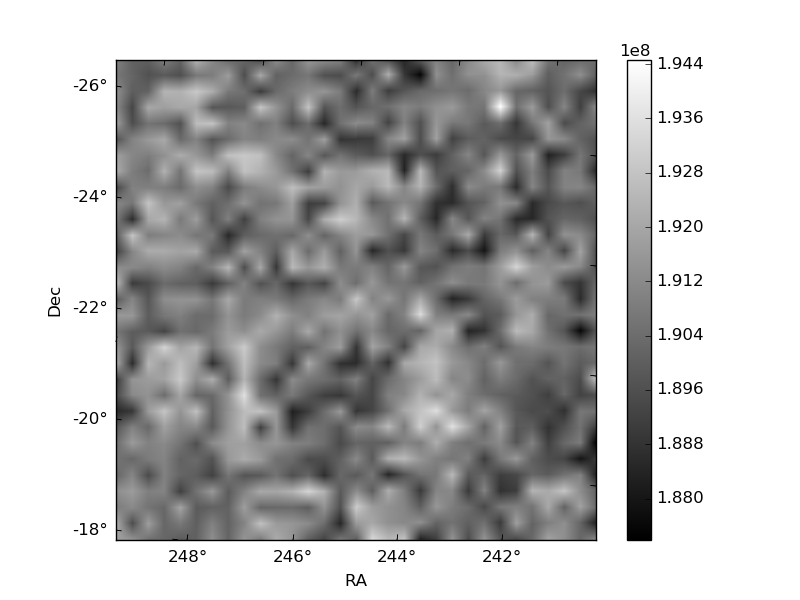
Quadrant B |
|---|---|---|---|
| Quadrant D | 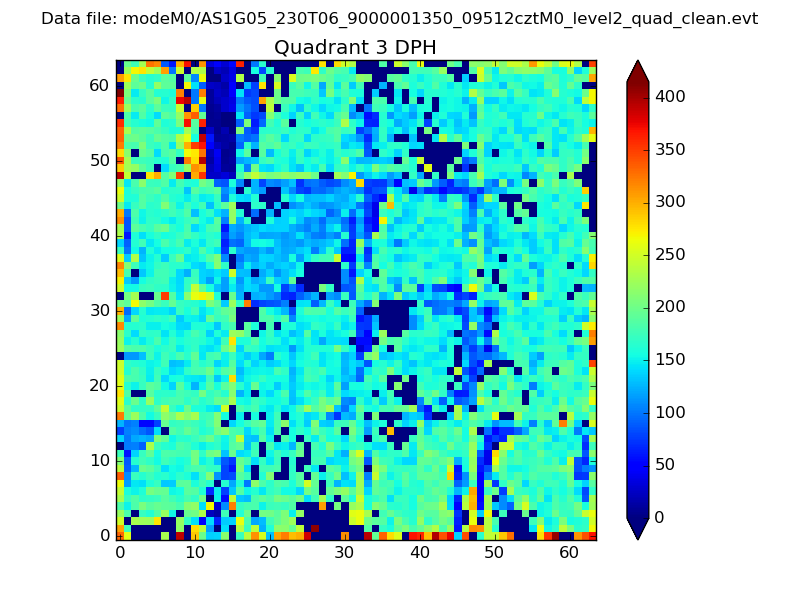 |
 |
Quadrant C |
| Plot type | Count rate plots | Images |
|---|---|---|
| Comparison with Poisson distribution Blue bars denote a histogram of data divided into 1 sec bins. Red curve is a Poisson curve with rate = median count rate of data. |
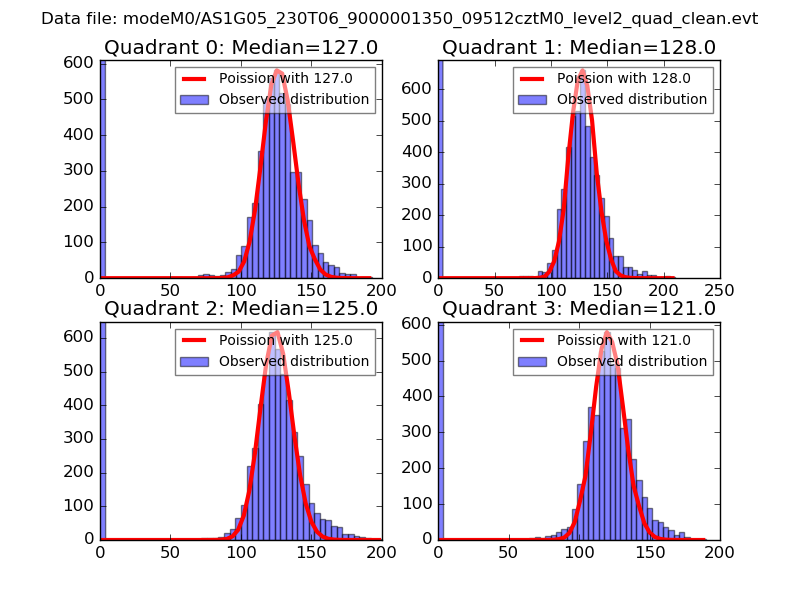 |
 |
| Quadrant-wise count rates Data is divided into 100 sec bins |
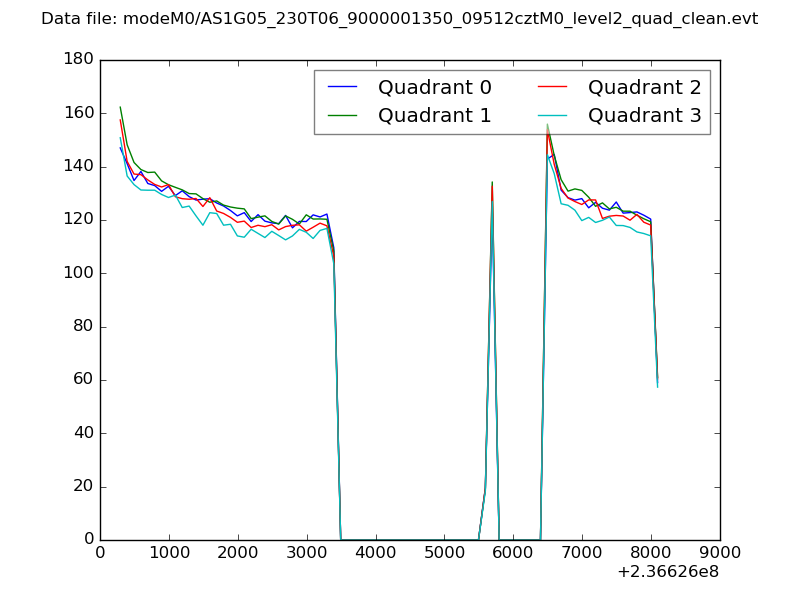 |
|
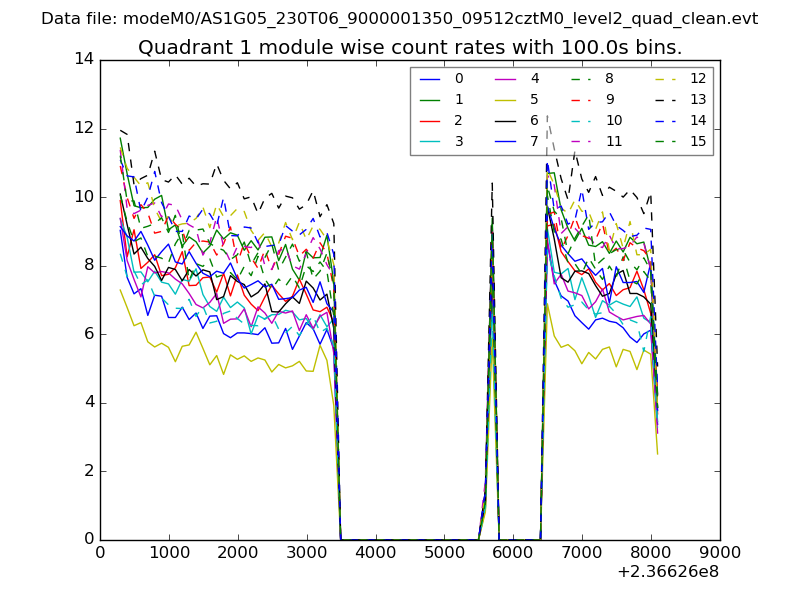
| Module-wise count rates for Quadrant A Data is divided into 100 sec bins |
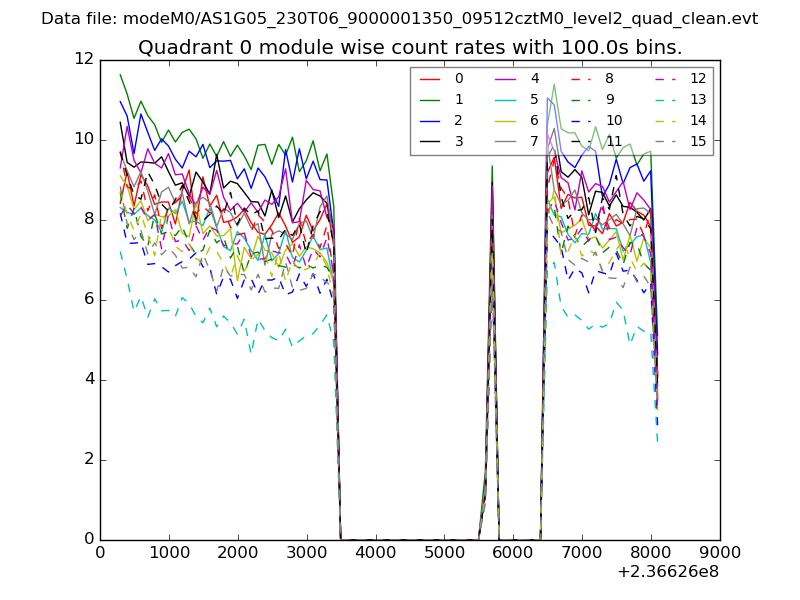 |
 |
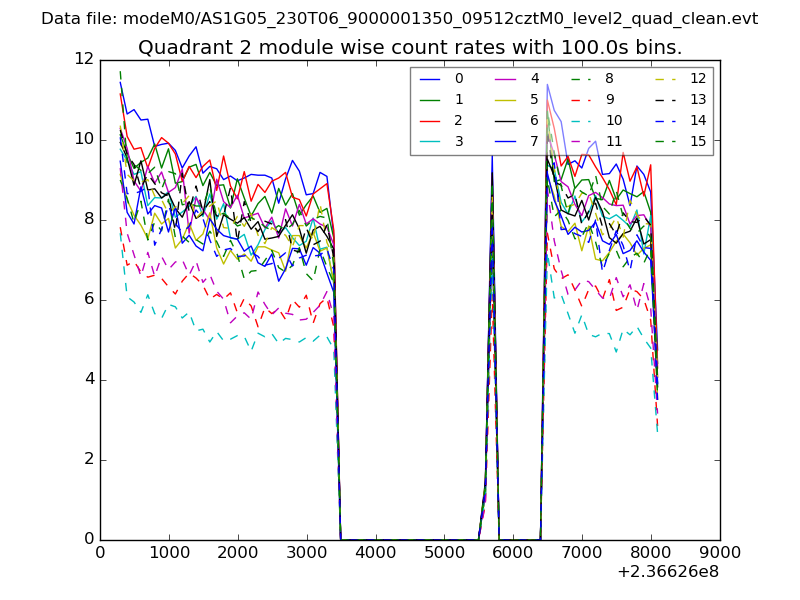
| Module-wise count rates for Quadrant B Data is divided into 100 sec bins |
 |
 |
| Module-wise count rates for Quadrant C Data is divided into 100 sec bins |
 |
 |
| Module-wise count rates for Quadrant D Data is divided into 100 sec bins |
 |
 |
| Parameter | Plot |
|---|---|
| CZT HV Monitor |  |
| D_VDD | 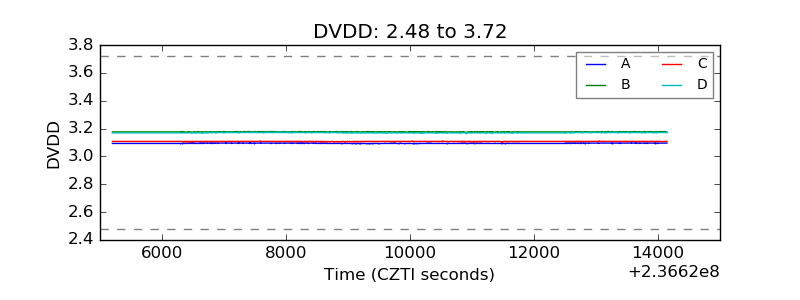 |
| Temperature 1 | 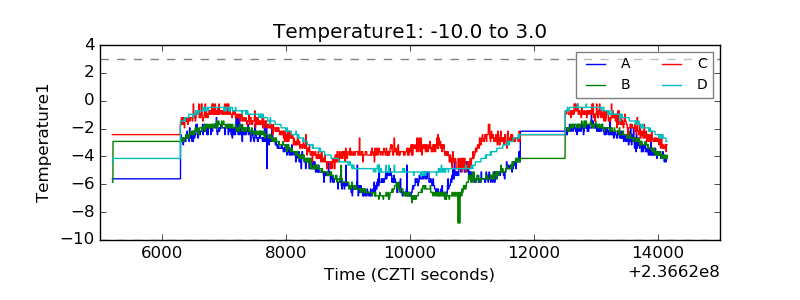 |
| Veto HV Monitor | 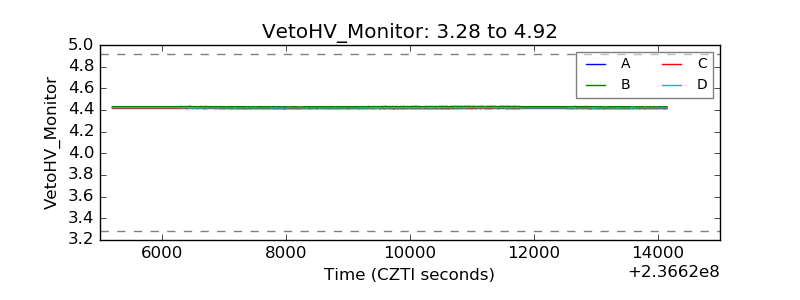 |
| Veto LLD | 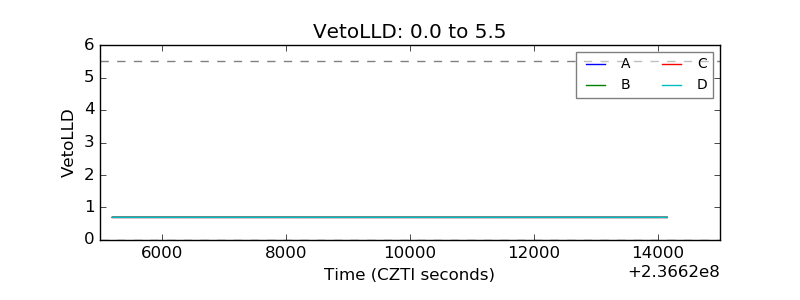 |
| Alpha Counter | 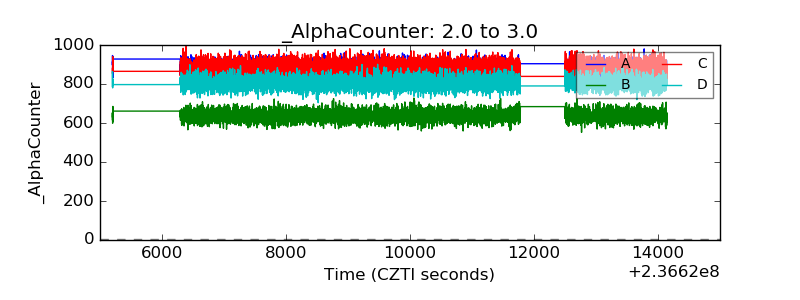 |
| _CPM_Rate | 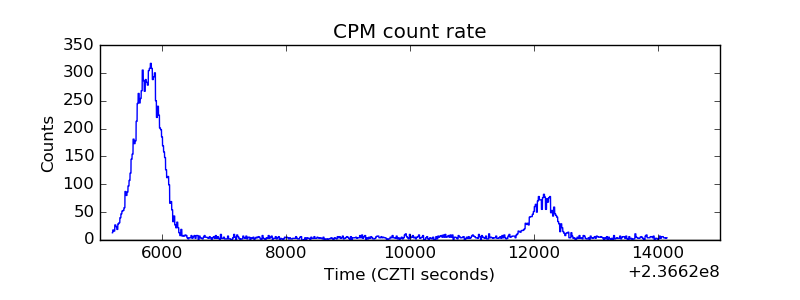 |
| CZT Counter | 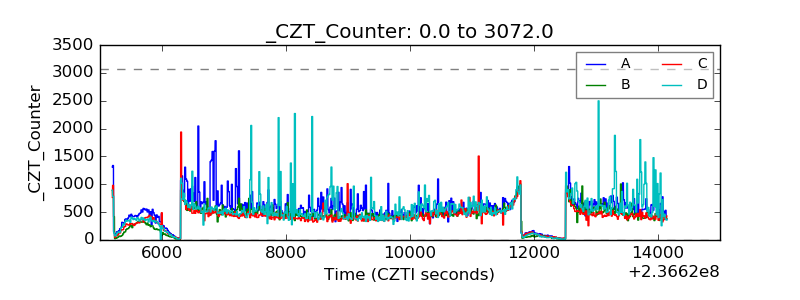 |
| +2.5 Volts monitor |  |
| +5 Volts monitor |  |
| _ROLL_ROT | 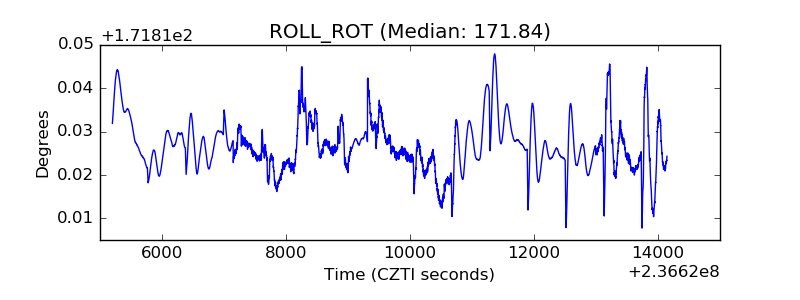 |
| _Roll_DEC | 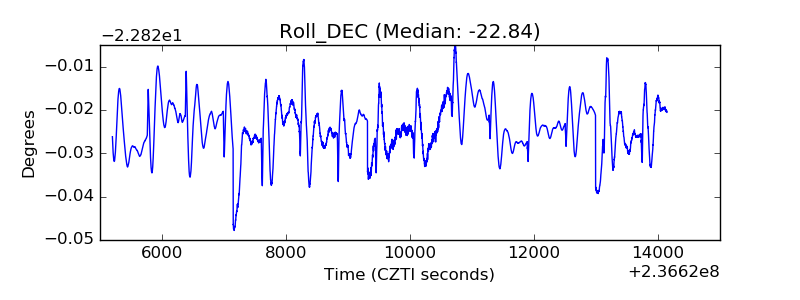 |
| _Roll_RA | 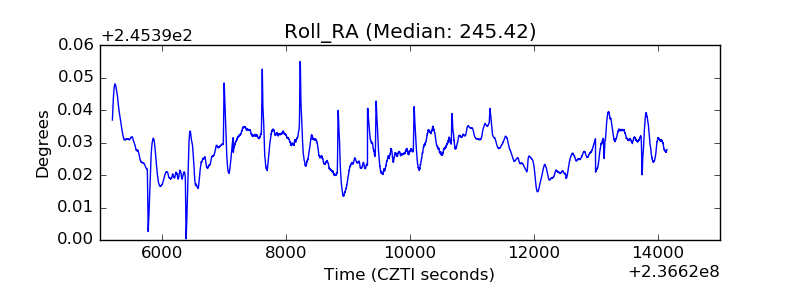 |
| Veto Counter | 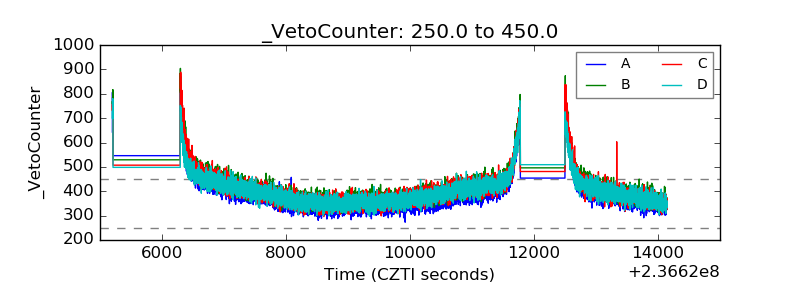 |