| Param | Original file | Final file |
|---|---|---|
| Filename | modeM0/AS1G05_230T06_9000001350_09513cztM0_level2.evt | modeM0/AS1G05_230T06_9000001350_09513cztM0_level2_quad_clean.evt |
| Size (bytes) | 289,667,520 | 52,171,200 |
| Size | 276.2 MB | 49.8 MB |
| Events in quadrant A | 2,399,372 | 328,106 |
| Events in quadrant B | 1,790,116 | 293,224 |
| Events in quadrant C | 2,079,038 | 346,840 |
| Events in quadrant D | 2,235,204 | 334,330 |
| Mode M0 | |||
|---|---|---|---|
| Quadrant | BADHDUFLAG | Total packets | Discarded packets |
| A | 0 | 18950 | 9260 |
| B | 0 | 15438 | 8004 |
| C | 0 | 16094 | 7145 |
| D | 0 | 16951 | 7621 |
| Mode SS | |||
|---|---|---|---|
| Quadrant | BADHDUFLAG | Total packets | Discarded packets |
| A | 0 | 147 | 59 |
| B | 0 | 146 | 64 |
| C | 0 | 148 | 48 |
| D | 0 | 148 | 64 |
| Mode M9 | |||
|---|---|---|---|
| Quadrant | BADHDUFLAG | Total packets | Discarded packets |
| A | 0 | 4 | 1 |
| B | 0 | 4 | 1 |
| C | 0 | 4 | 1 |
| D | 0 | 5 | 0 |
| Quadrant | Total seconds | Saturated seconds | Saturation percentage |
|---|---|---|---|
| A | 3867 | 58 | 1.499871% |
| B | 3467 | 32 | 0.922988% |
| C | 4095 | 54 | 1.318681% |
| D | 4103 | 17 | 0.414331% |
Noise dominated data is calculated using 1-second bins in cleaned event files. If a bin has >2000 counts, and if more than 50% of those come from <1% of pixels, then it is considered to be noise-dominated and hence unusable.
| Quadrant | # 1 sec bins | Bins with >0 counts | Bins with >2000 counts | High rate bins dominated by noise | Noise dominated (total time) | Noise dominated (detector-on time) | Marked lightcurve |
|---|---|---|---|---|---|---|---|
| A | 7689 | 4826 | 8 | 8 | 0.10% | 0.17% |  |
| B | 7646 | 4152 | 1 | 1 | 0.01% | 0.02% | 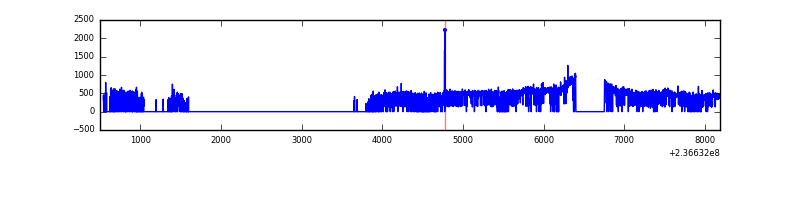 |
| C | 7689 | 5093 | 23 | 23 | 0.30% | 0.45% | 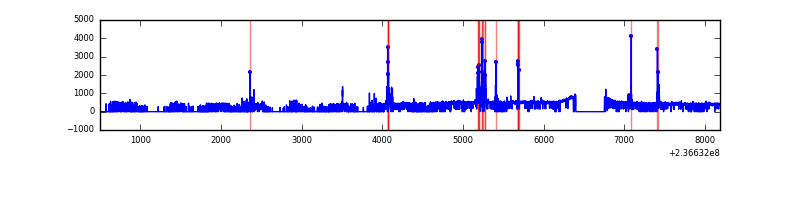 |
| D | 7633 | 5100 | 5 | 5 | 0.07% | 0.10% | 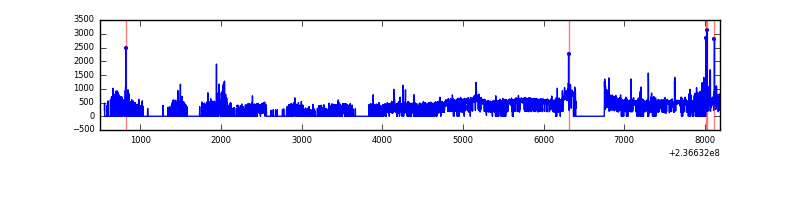 |
Top three noisy pixels from each quadrant. If the there are fewer than three noisy pixels in the level2.evt file, extra rows are filled as -1
| Pixel properties | Quadrant properties | ||||||
|---|---|---|---|---|---|---|---|
| Quadrant | DetID | PixID | Counts | Sigma | Mean | Median | Sigma |
| A | 8 | 5 | 414286 | 4172.48 | 475 | 464 | 99.2 |
| A | 1 | 162 | 72651 | 727.85 | 475 | 464 | 99.2 |
| A | 1 | 178 | 28008 | 277.72 | 475 | 464 | 99.2 |
| B | 0 | 219 | 38073 | 436.61 | 438 | 427 | 86.2 |
| B | 0 | 214 | 23632 | 269.13 | 438 | 427 | 86.2 |
| B | 0 | 187 | 12557 | 140.68 | 438 | 427 | 86.2 |
| C | 4 | 254 | 172915 | 1523.59 | 483 | 486 | 113.2 |
| C | 14 | 234 | 17298 | 148.55 | 483 | 486 | 113.2 |
| C | 13 | 61 | 3821 | 29.47 | 483 | 486 | 113.2 |
| D | 8 | 195 | 159395 | 1305.65 | 485 | 472 | 121.7 |
| D | 1 | 52 | 74519 | 608.34 | 485 | 472 | 121.7 |
| D | 7 | 71 | 55294 | 450.4 | 485 | 472 | 121.7 |
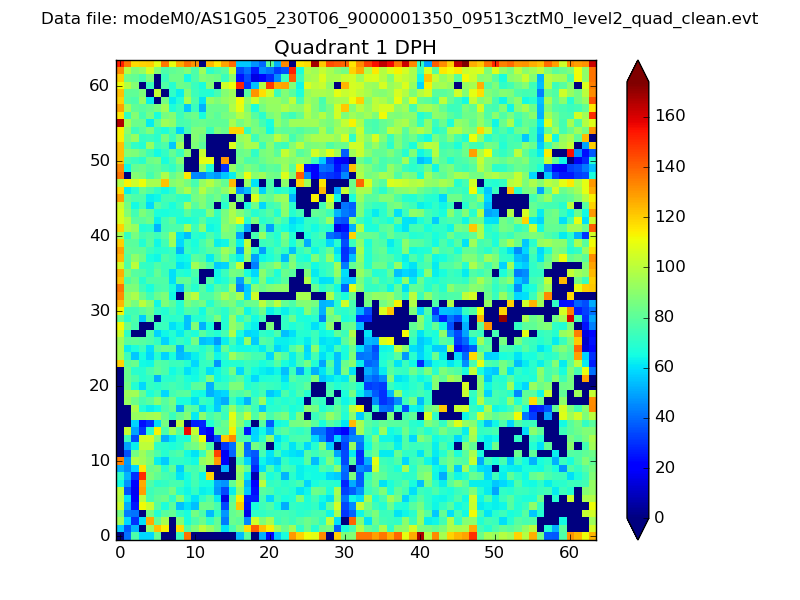
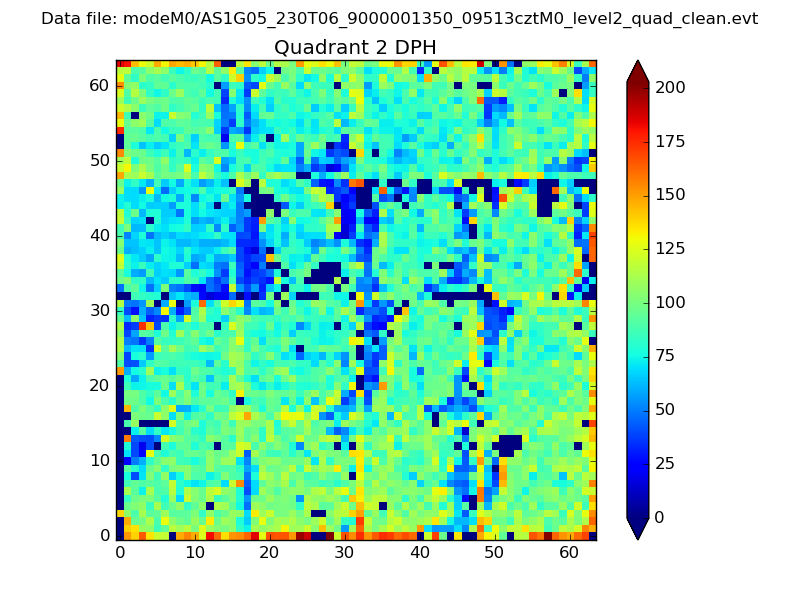
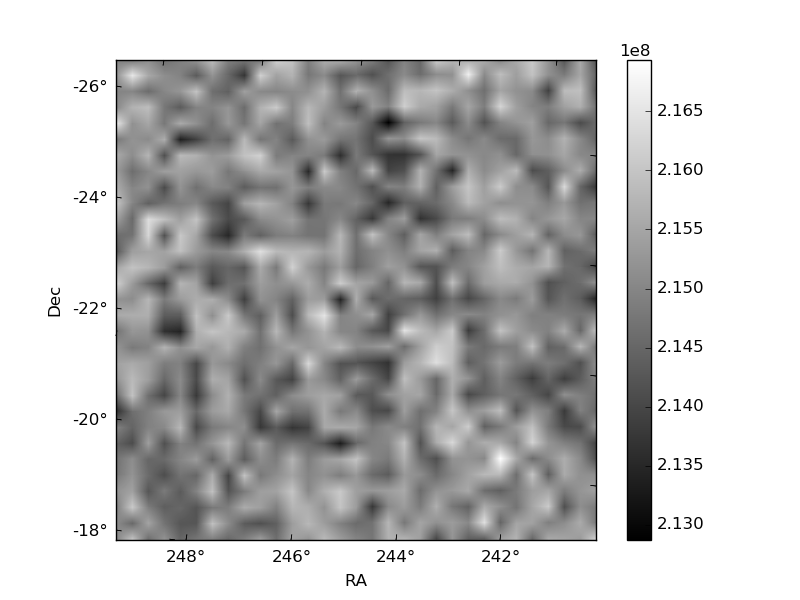
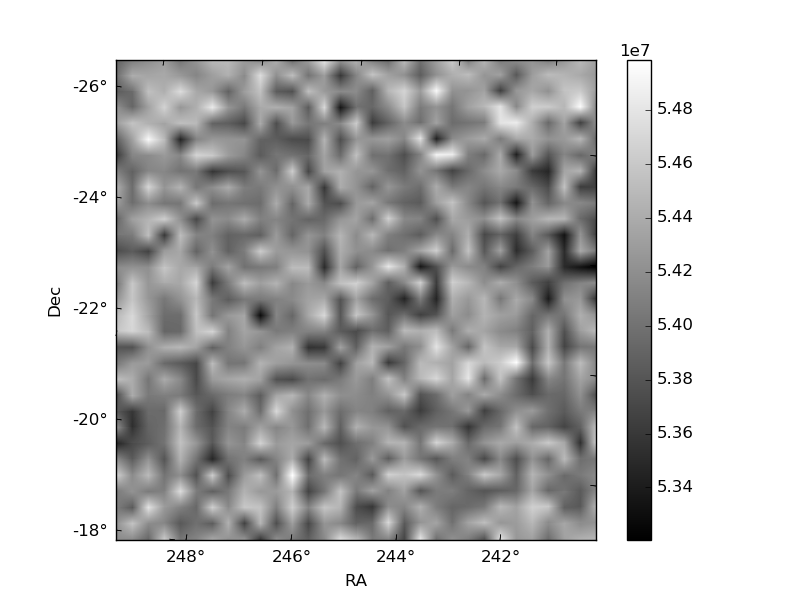
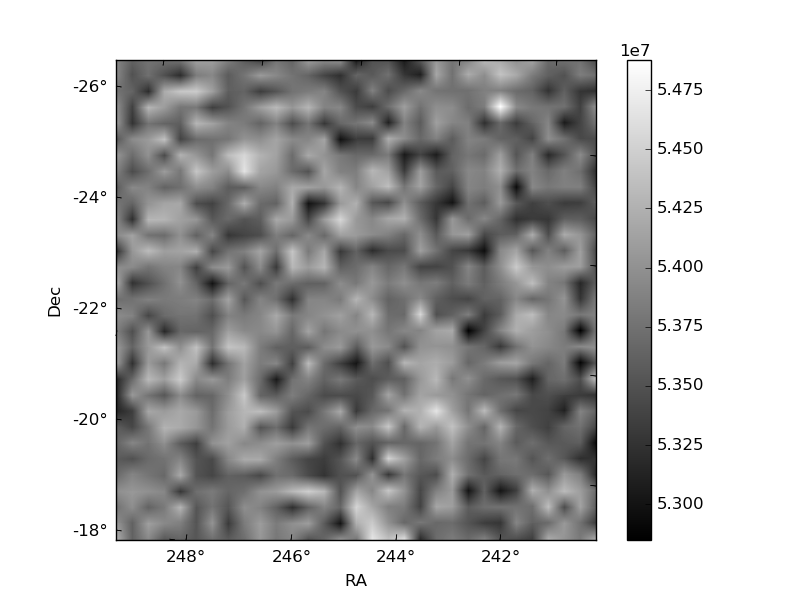
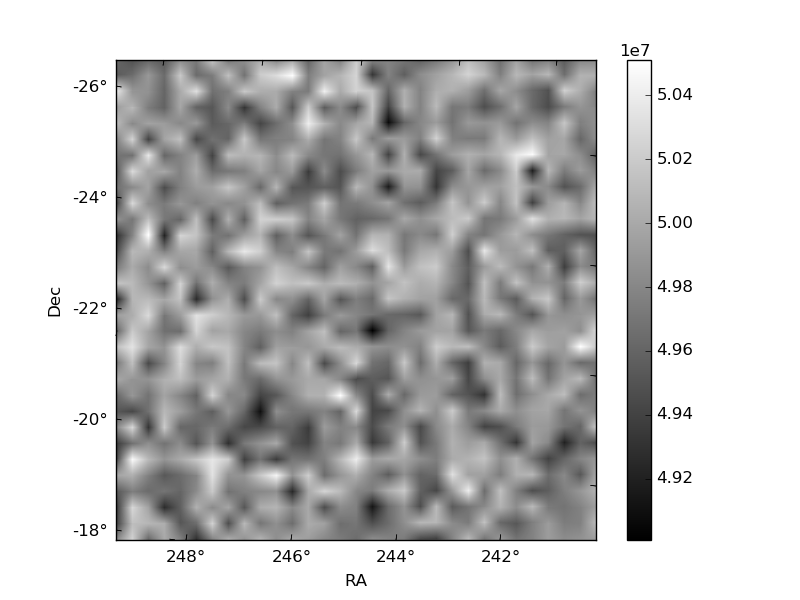
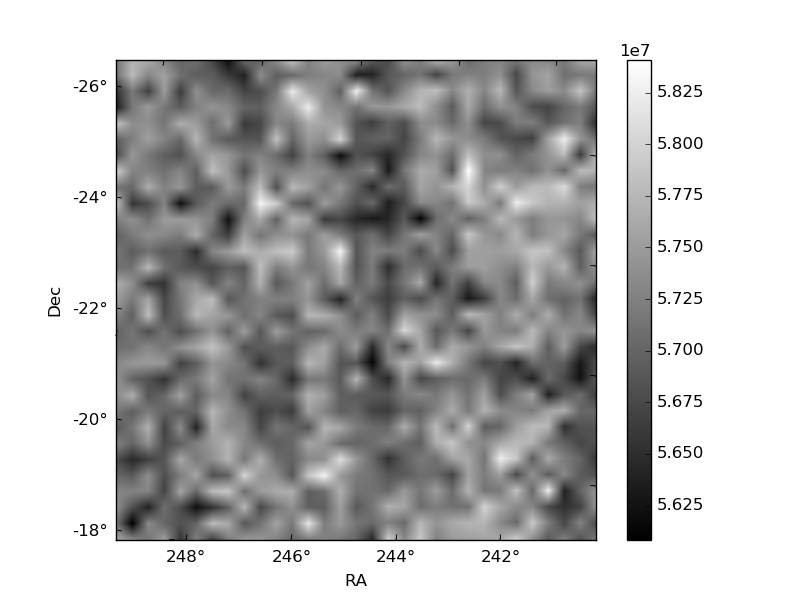
Histogram calculated using DETX and DETY for each event in the final _common_clean file
| Quadrant A | 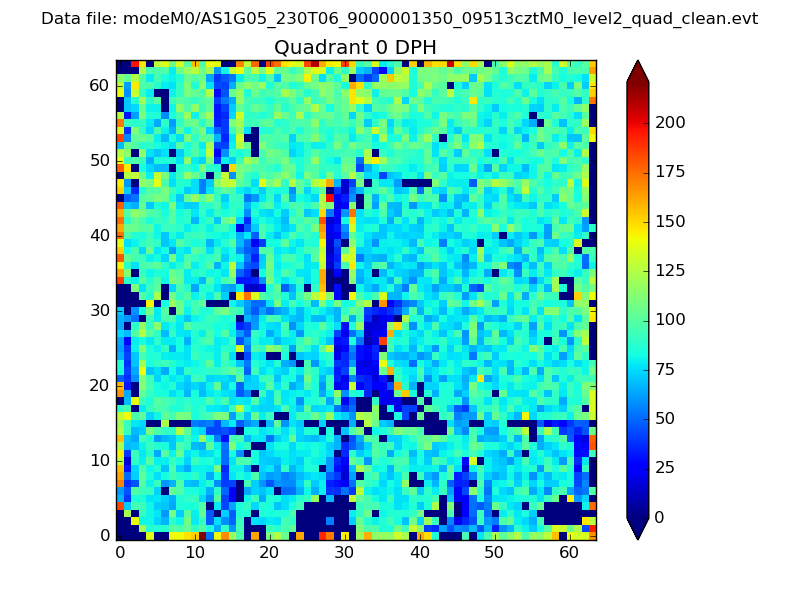 |
 |
Quadrant B |
|---|---|---|---|
| Quadrant D | 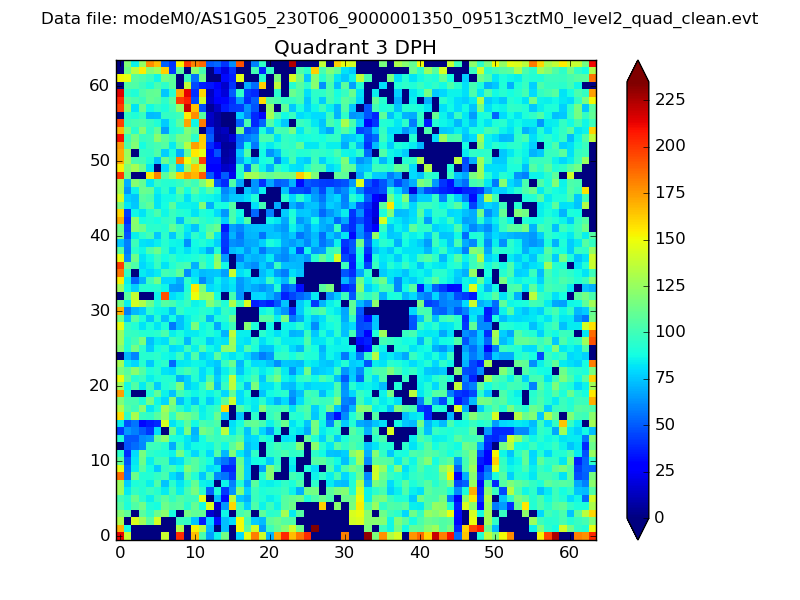 |
 |
Quadrant C |
| Plot type | Count rate plots | Images |
|---|---|---|
| Comparison with Poisson distribution Blue bars denote a histogram of data divided into 1 sec bins. Red curve is a Poisson curve with rate = median count rate of data. |
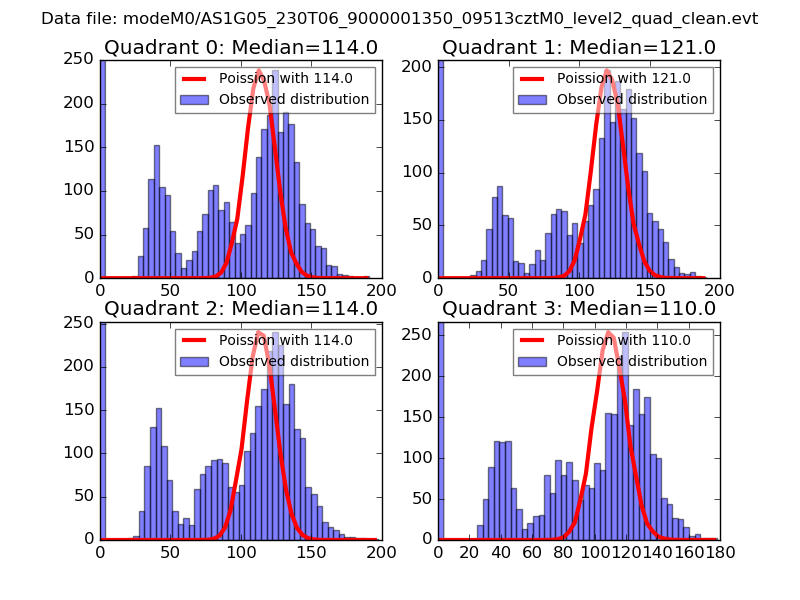 |
 |
| Quadrant-wise count rates Data is divided into 100 sec bins |
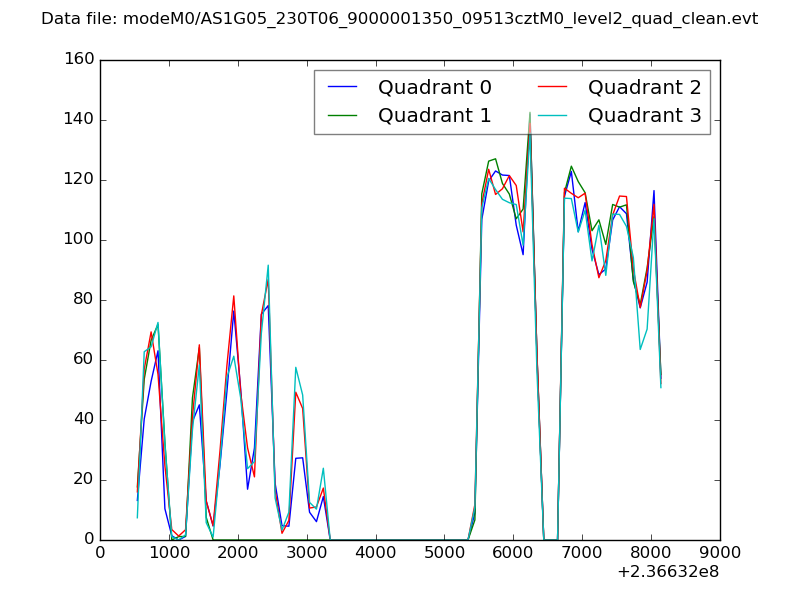 |
|
| Module-wise count rates for Quadrant A Data is divided into 100 sec bins |
 |
 |
| Module-wise count rates for Quadrant B Data is divided into 100 sec bins |
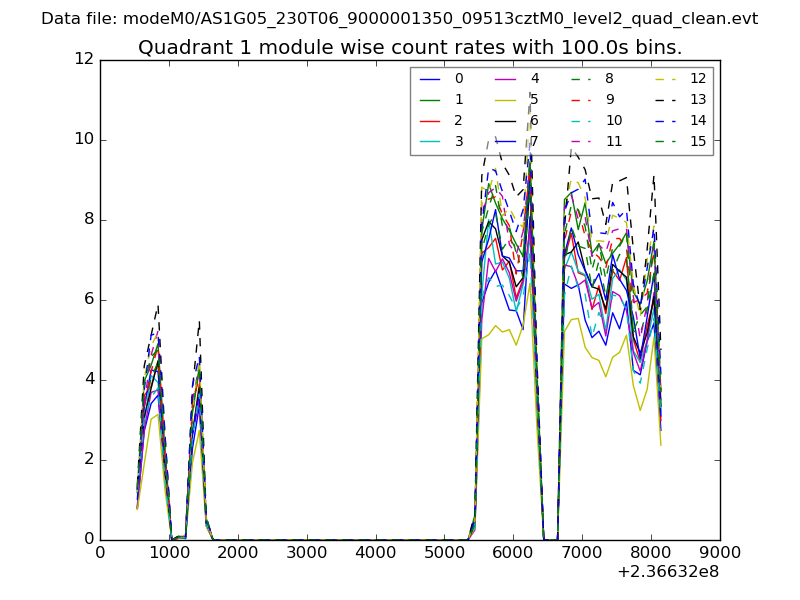 |
 |
| Module-wise count rates for Quadrant C Data is divided into 100 sec bins |
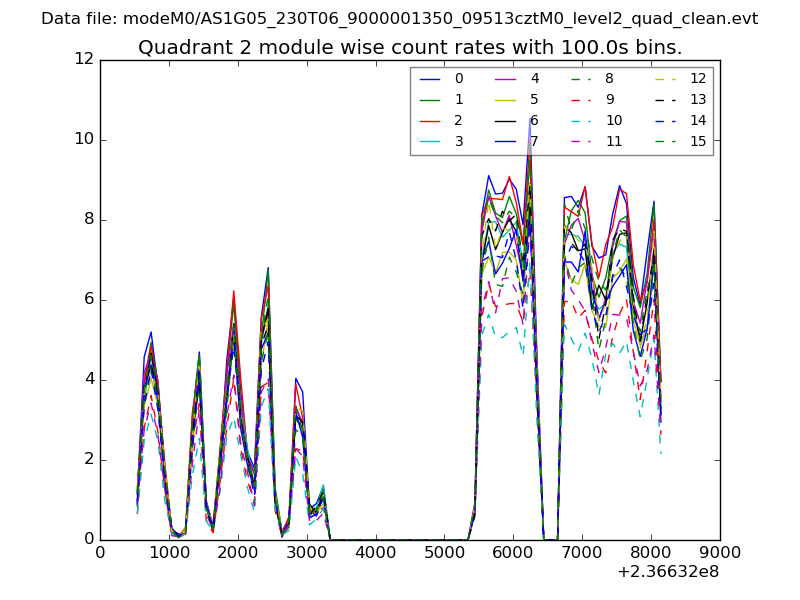 |
 |
| Module-wise count rates for Quadrant D Data is divided into 100 sec bins |
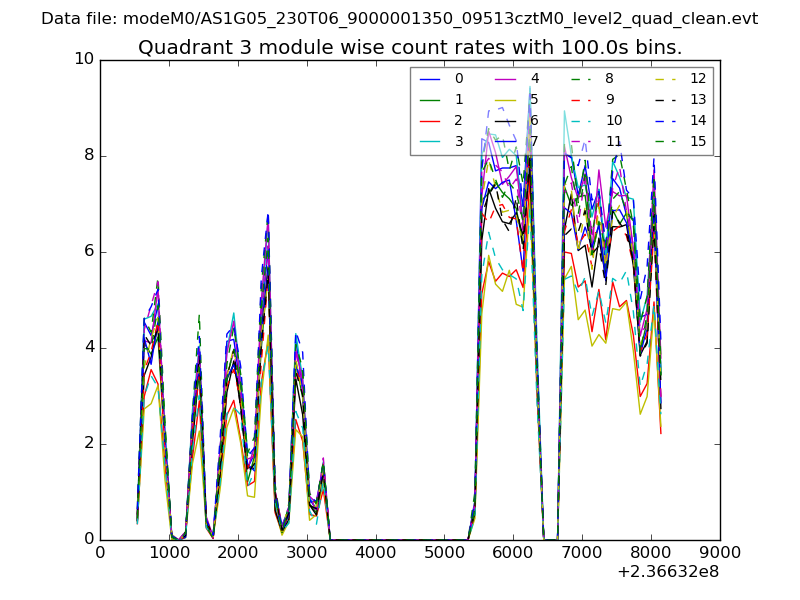 |
 |
| Parameter | Plot |
|---|---|
| CZT HV Monitor | 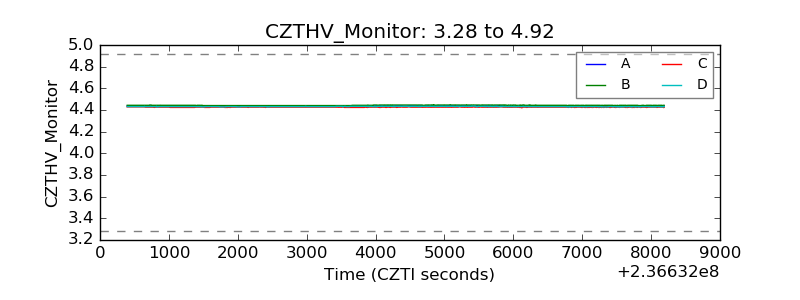 |
| D_VDD | 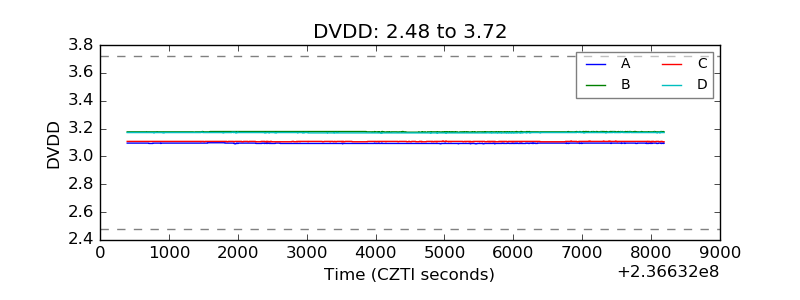 |
| Temperature 1 | 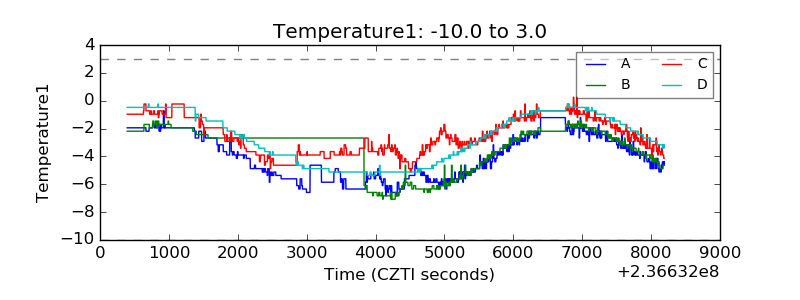 |
| Veto HV Monitor | 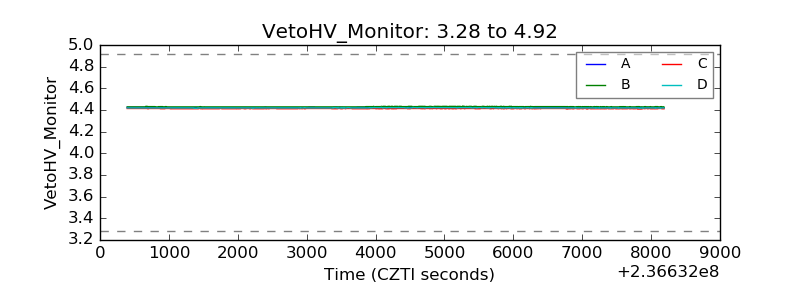 |
| Veto LLD | 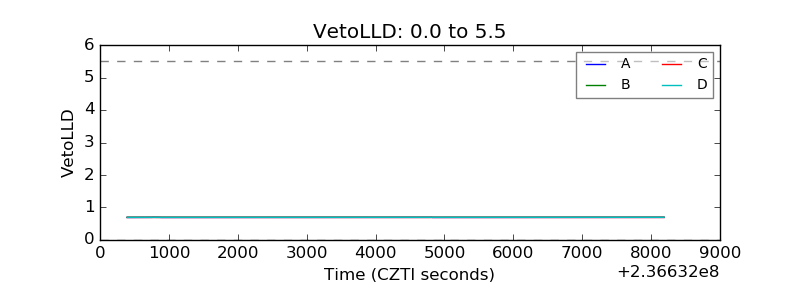 |
| Alpha Counter | 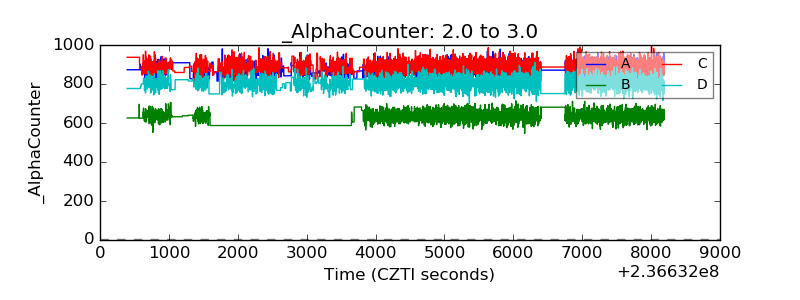 |
| _CPM_Rate | 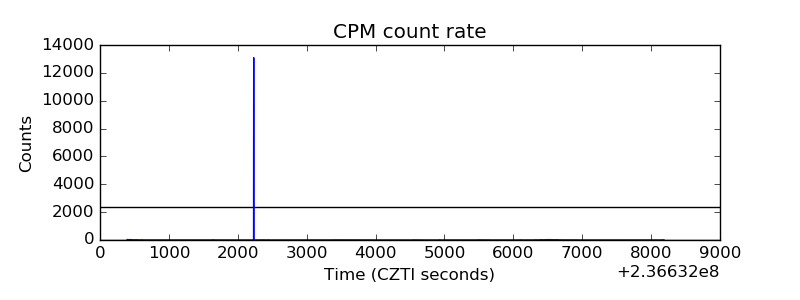 |
| CZT Counter | 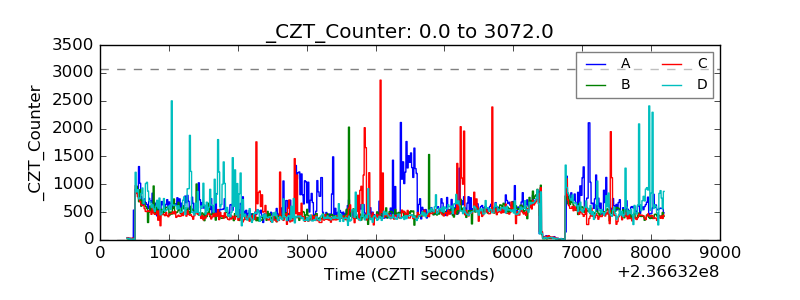 |
| +2.5 Volts monitor |  |
| +5 Volts monitor |  |
| _ROLL_ROT | 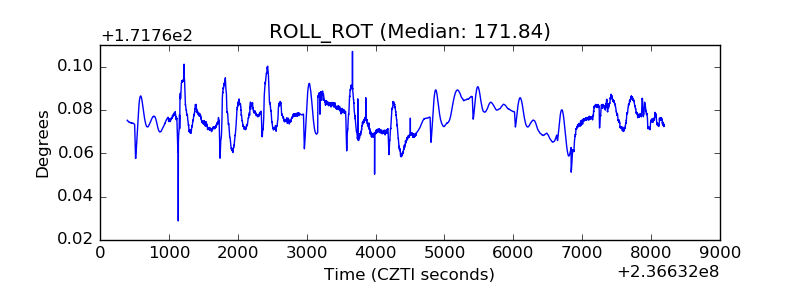 |
| _Roll_DEC | 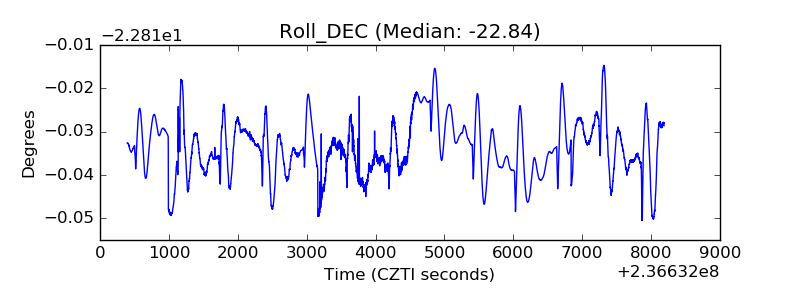 |
| _Roll_RA | 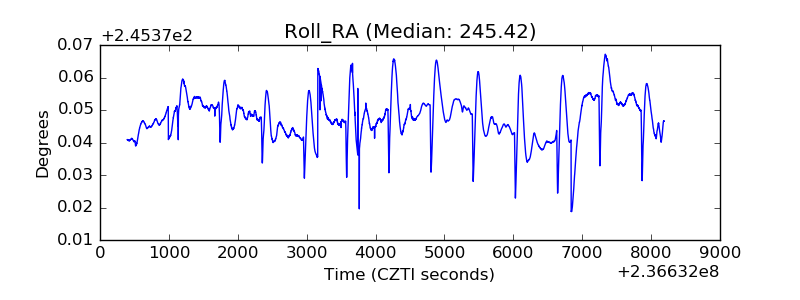 |
| Veto Counter |  |