| Param | Original file | Final file |
|---|---|---|
| Filename | modeM0/AS1G05_230T06_9000001350_09514cztM0_level2.evt | modeM0/AS1G05_230T06_9000001350_09514cztM0_level2_quad_clean.evt |
| Size (bytes) | 485,812,800 | 80,375,040 |
| Size | 463.3 MB | 76.7 MB |
| Events in quadrant A | 3,354,417 | 518,696 |
| Events in quadrant B | 2,899,682 | 530,297 |
| Events in quadrant C | 4,695,923 | 471,796 |
| Events in quadrant D | 3,363,322 | 503,063 |
| Mode M0 | |||
|---|---|---|---|
| Quadrant | BADHDUFLAG | Total packets | Discarded packets |
| A | 0 | 18972 | 5150 |
| B | 0 | 16995 | 4478 |
| C | 0 | 27123 | 9236 |
| D | 0 | 19177 | 5337 |
| Mode SS | |||
|---|---|---|---|
| Quadrant | BADHDUFLAG | Total packets | Discarded packets |
| A | 0 | 166 | 42 |
| B | 0 | 166 | 42 |
| C | 0 | 165 | 51 |
| D | 0 | 166 | 36 |
| Mode M9 | |||
|---|---|---|---|
| Quadrant | BADHDUFLAG | Total packets | Discarded packets |
| A | 0 | 5 | 1 |
| B | 0 | 5 | 1 |
| C | 0 | 5 | 0 |
| D | 0 | 5 | 0 |
| Quadrant | Total seconds | Saturated seconds | Saturation percentage |
|---|---|---|---|
| A | 5894 | 68 | 1.153716% |
| B | 5967 | 31 | 0.519524% |
| C | 5526 | 1751 | 31.686573% |
| D | 5937 | 34 | 0.572680% |
Noise dominated data is calculated using 1-second bins in cleaned event files. If a bin has >2000 counts, and if more than 50% of those come from <1% of pixels, then it is considered to be noise-dominated and hence unusable.
| Quadrant | # 1 sec bins | Bins with >0 counts | Bins with >2000 counts | High rate bins dominated by noise | Noise dominated (total time) | Noise dominated (detector-on time) | Marked lightcurve |
|---|---|---|---|---|---|---|---|
| A | 8637 | 6869 | 9 | 9 | 0.10% | 0.13% | 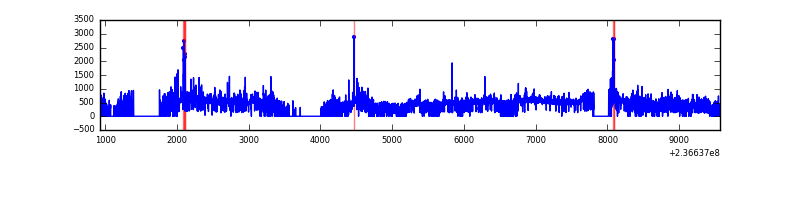 |
| B | 8635 | 6937 | 1 | 1 | 0.01% | 0.01% | 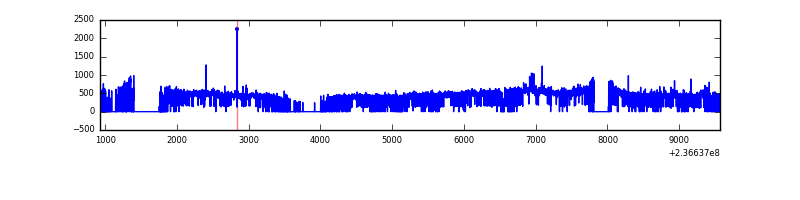 |
| C | 8639 | 6300 | 600 | 600 | 6.95% | 9.52% | 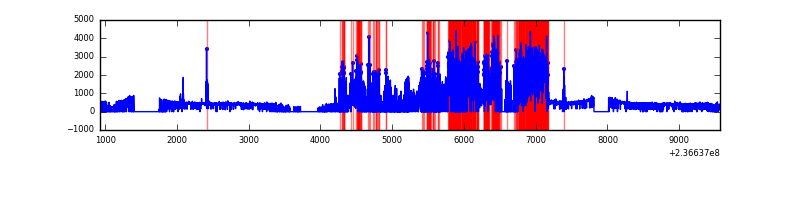 |
| D | 8639 | 6907 | 18 | 18 | 0.21% | 0.26% | 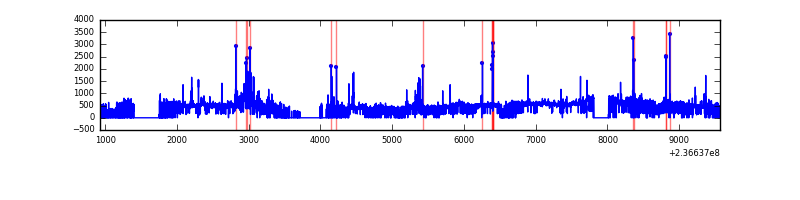 |
Top three noisy pixels from each quadrant. If the there are fewer than three noisy pixels in the level2.evt file, extra rows are filled as -1
| Pixel properties | Quadrant properties | ||||||
|---|---|---|---|---|---|---|---|
| Quadrant | DetID | PixID | Counts | Sigma | Mean | Median | Sigma |
| A | 8 | 5 | 268840 | 1818.04 | 709 | 691 | 147.5 |
| A | 1 | 162 | 144407 | 974.39 | 709 | 691 | 147.5 |
| A | 1 | 178 | 58075 | 389.06 | 709 | 691 | 147.5 |
| B | 0 | 219 | 37367 | 263.35 | 718 | 702 | 139.2 |
| B | 0 | 214 | 36025 | 253.71 | 718 | 702 | 139.2 |
| B | 12 | 111 | 14722 | 100.7 | 718 | 702 | 139.2 |
| C | 4 | 254 | 2749244 | 23773.66 | 494 | 496 | 115.6 |
| C | 14 | 234 | 16645 | 139.67 | 494 | 496 | 115.6 |
| C | 13 | 61 | 3792 | 28.51 | 494 | 496 | 115.6 |
| D | 8 | 195 | 335315 | 1872.03 | 684 | 668 | 178.8 |
| D | 1 | 52 | 165984 | 924.78 | 684 | 668 | 178.8 |
| D | 2 | 16 | 75378 | 417.93 | 684 | 668 | 178.8 |
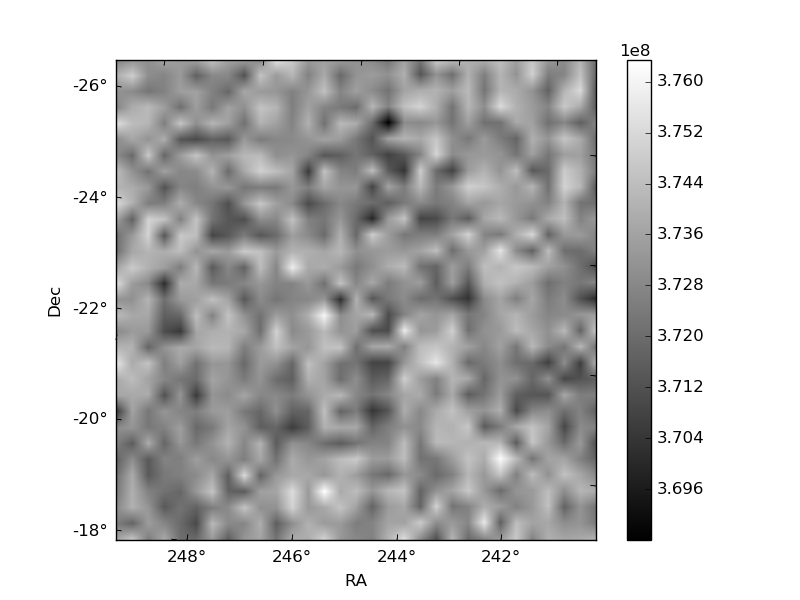
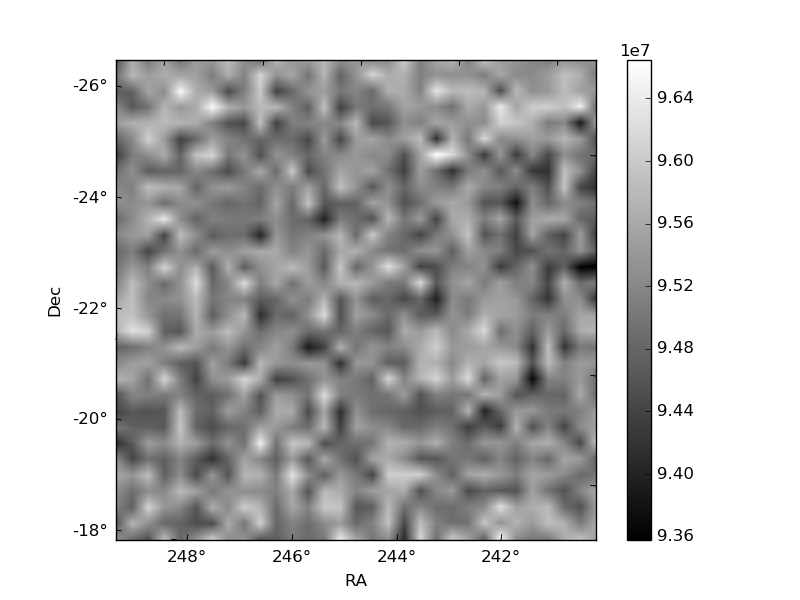
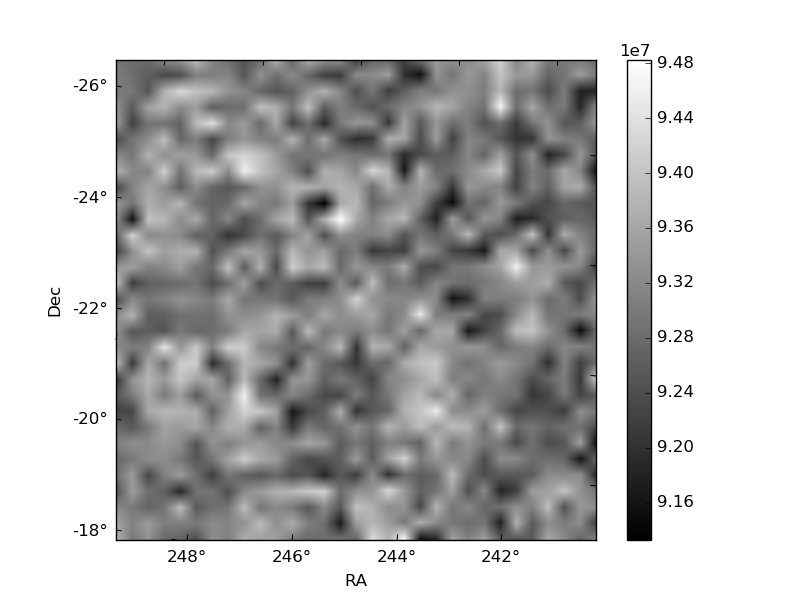
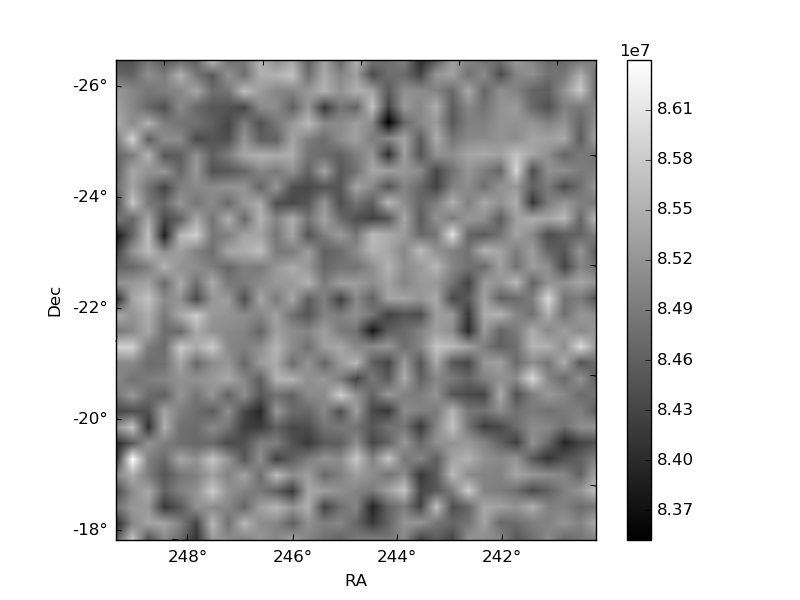
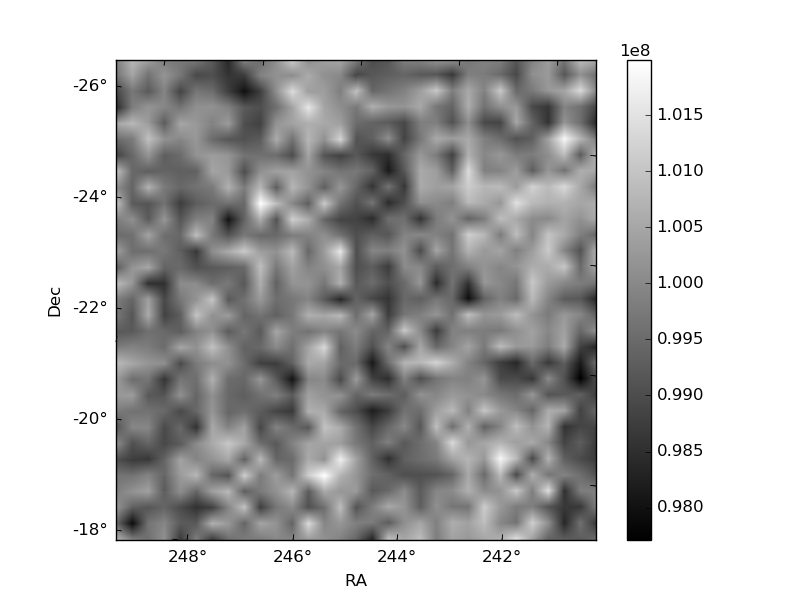
Histogram calculated using DETX and DETY for each event in the final _common_clean file
| Quadrant A | 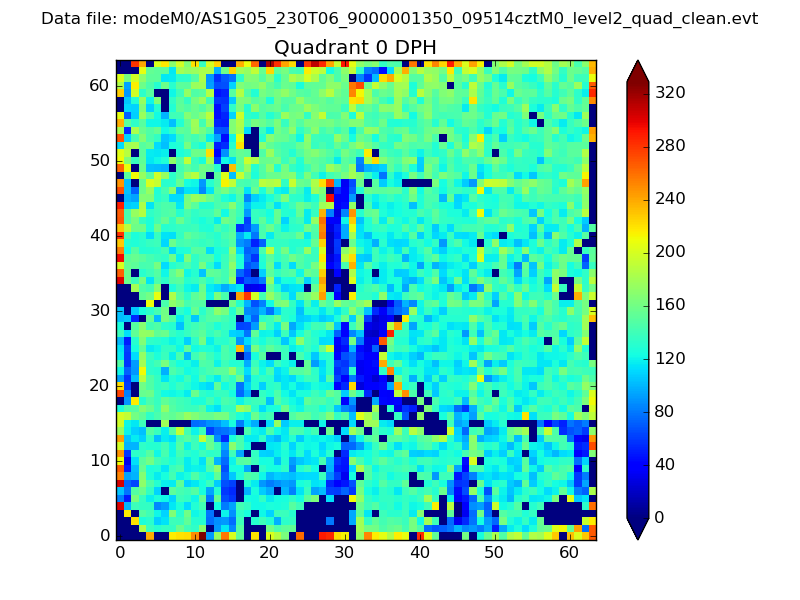 |
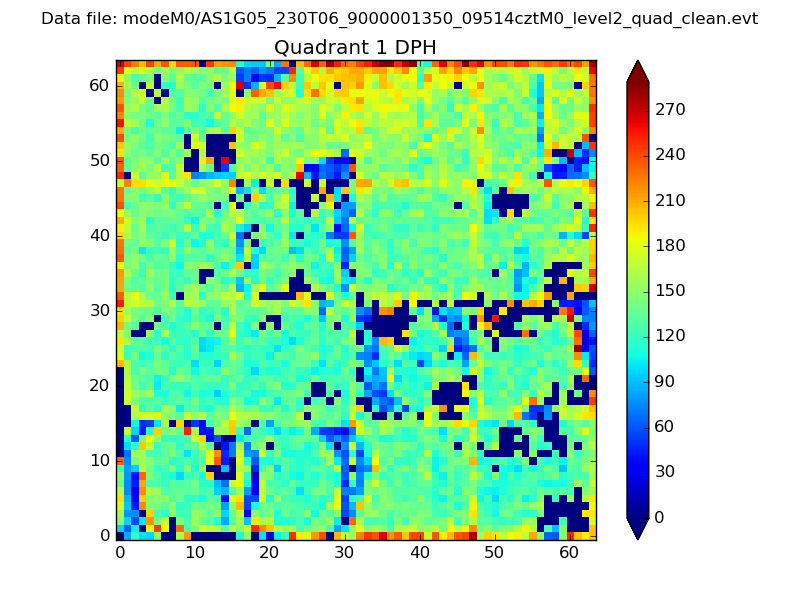 |
Quadrant B |
|---|---|---|---|
| Quadrant D | 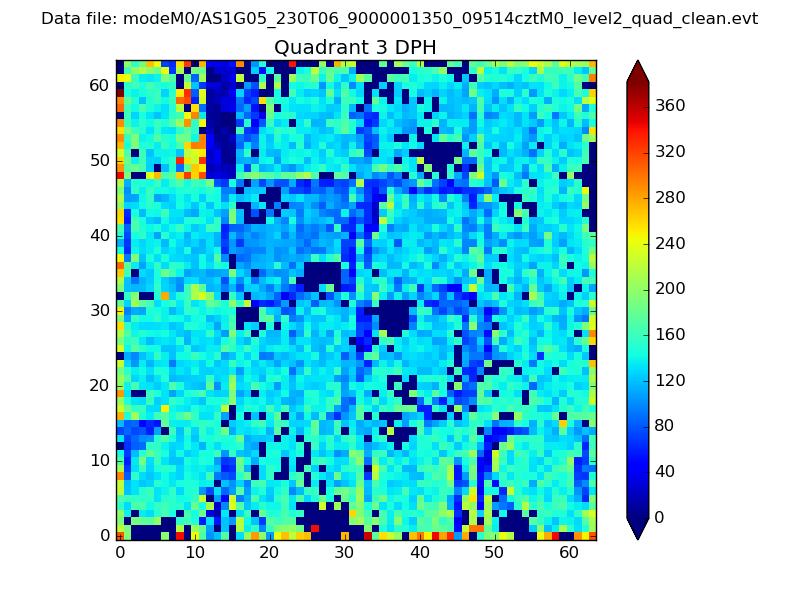 |
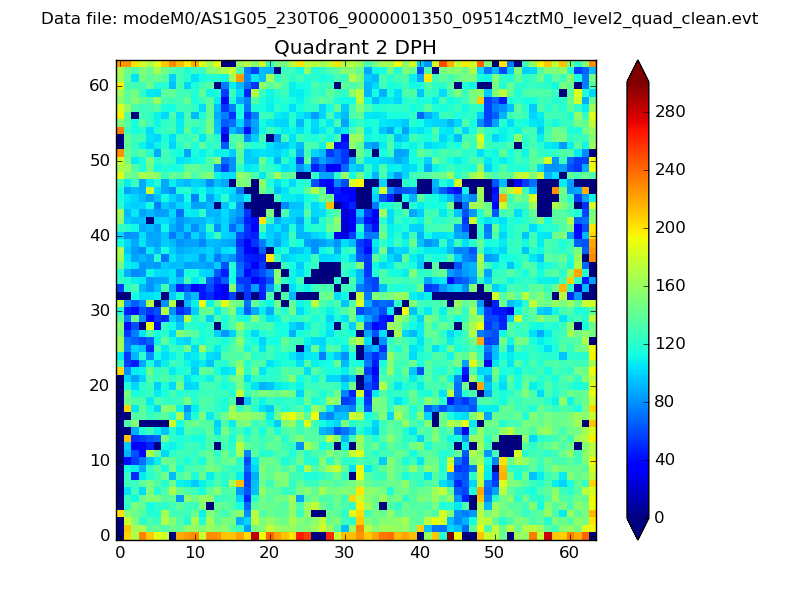 |
Quadrant C |
| Plot type | Count rate plots | Images |
|---|---|---|
| Comparison with Poisson distribution Blue bars denote a histogram of data divided into 1 sec bins. Red curve is a Poisson curve with rate = median count rate of data. |
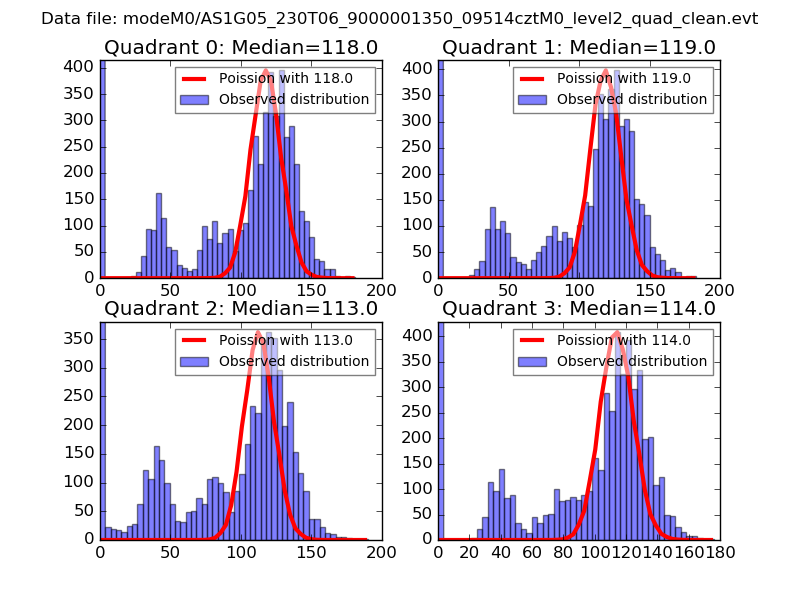 |
 |
| Quadrant-wise count rates Data is divided into 100 sec bins |
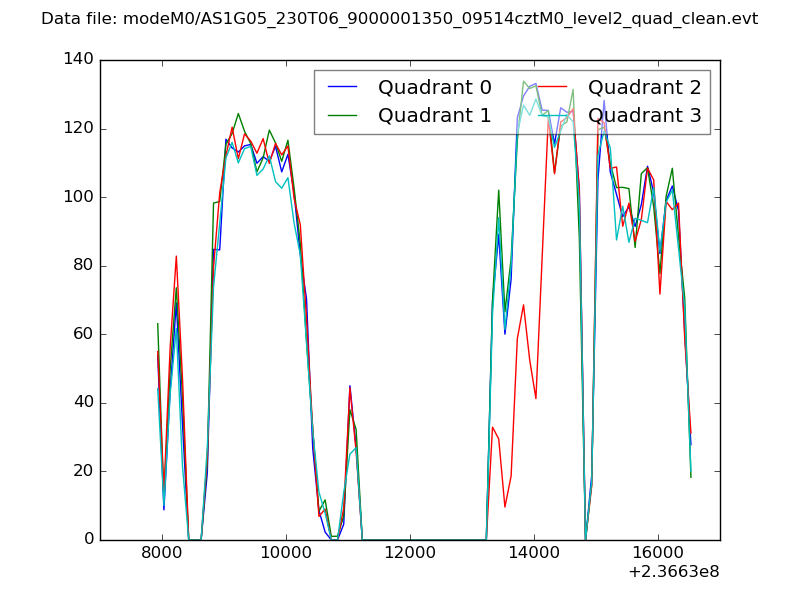 |
|
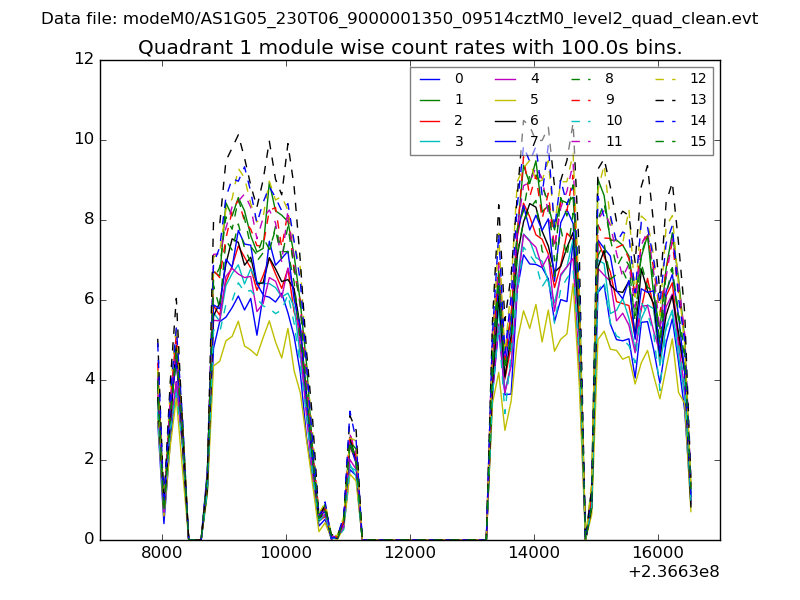
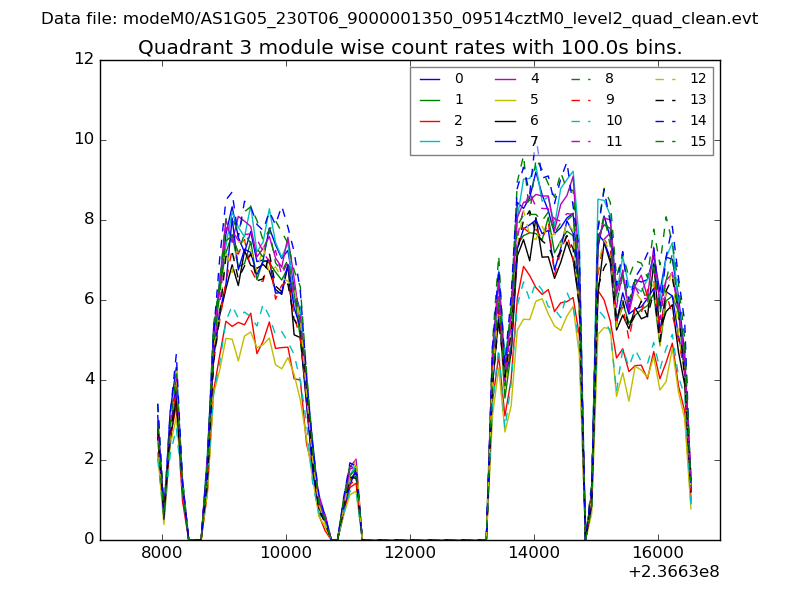
| Module-wise count rates for Quadrant A Data is divided into 100 sec bins |
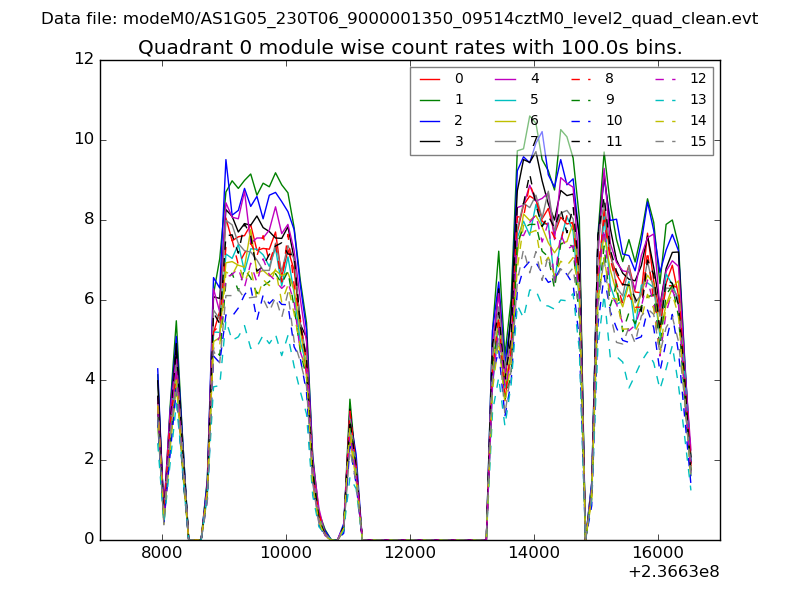 |
 |
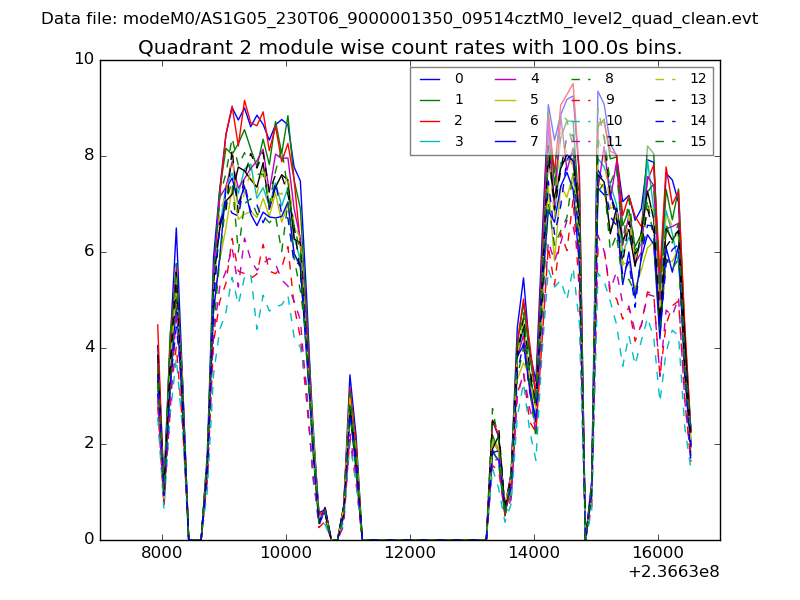
| Module-wise count rates for Quadrant B Data is divided into 100 sec bins |
 |
 |
| Module-wise count rates for Quadrant C Data is divided into 100 sec bins |
 |
 |
| Module-wise count rates for Quadrant D Data is divided into 100 sec bins |
 |
 |
| Parameter | Plot |
|---|---|
| CZT HV Monitor | 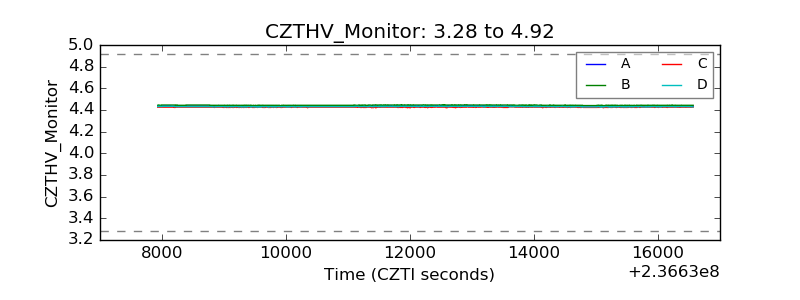 |
| D_VDD | 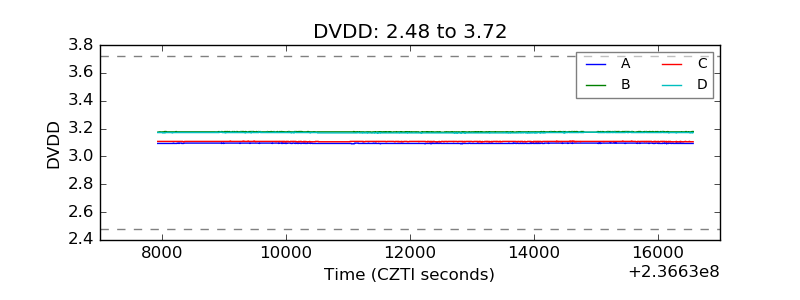 |
| Temperature 1 | 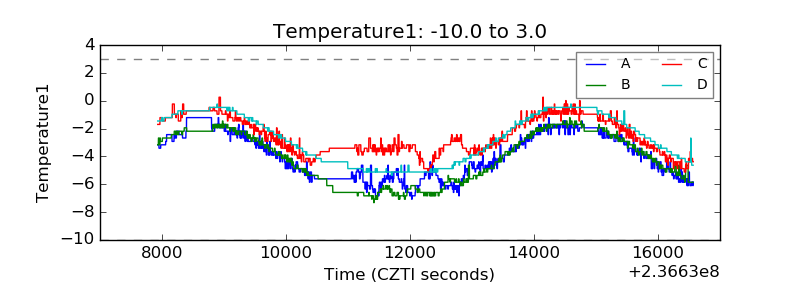 |
| Veto HV Monitor | 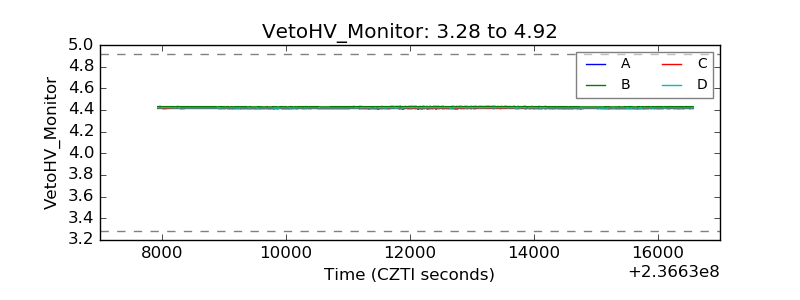 |
| Veto LLD | 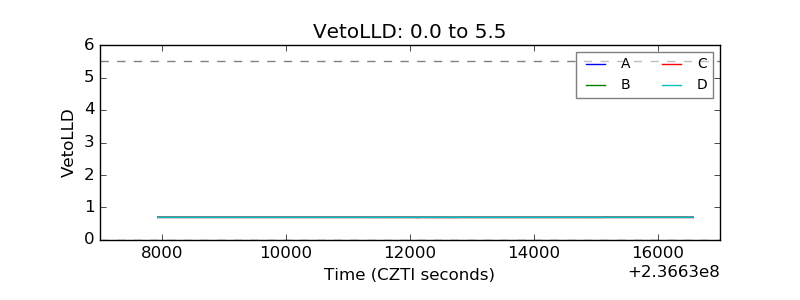 |
| Alpha Counter | 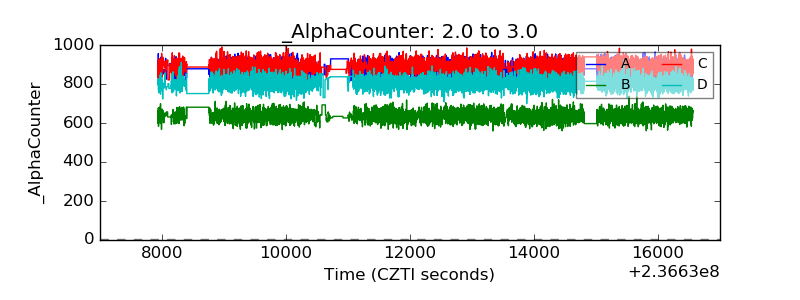 |
| _CPM_Rate | 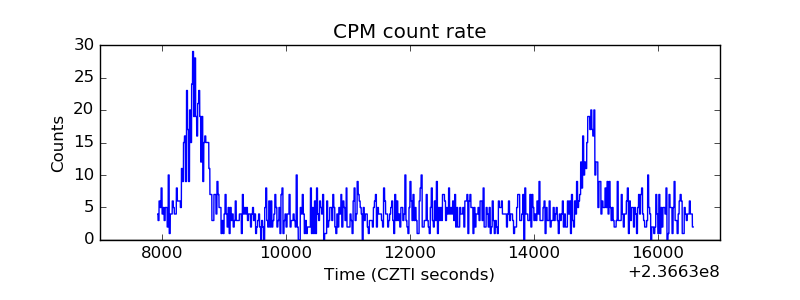 |
| CZT Counter | 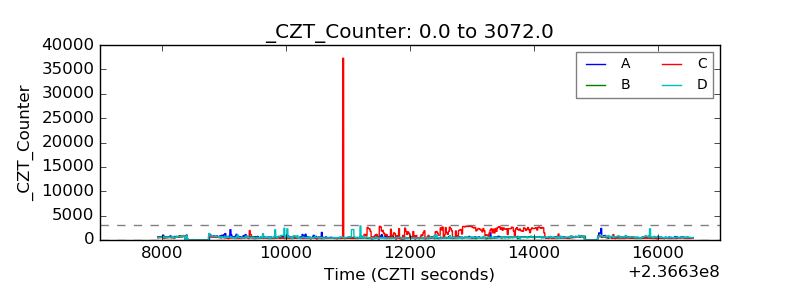 |
| +2.5 Volts monitor |  |
| +5 Volts monitor |  |
| _ROLL_ROT | 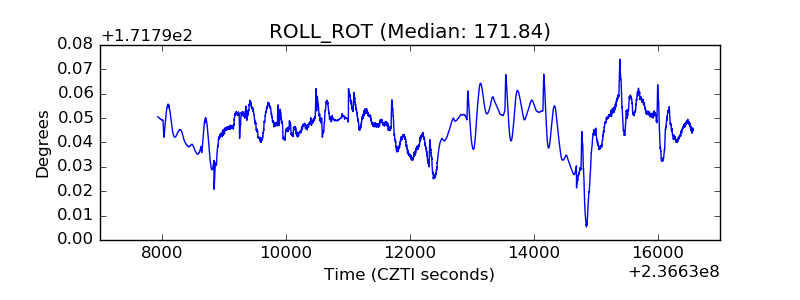 |
| _Roll_DEC | 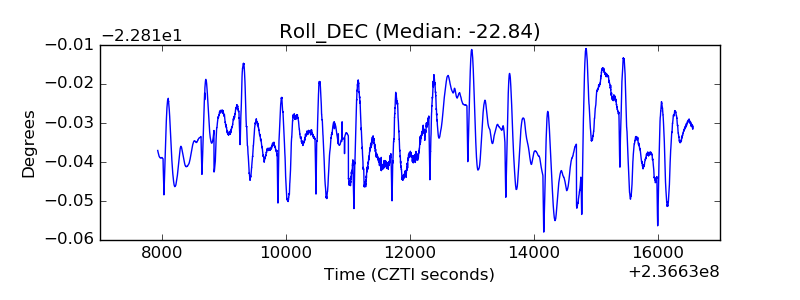 |
| _Roll_RA | 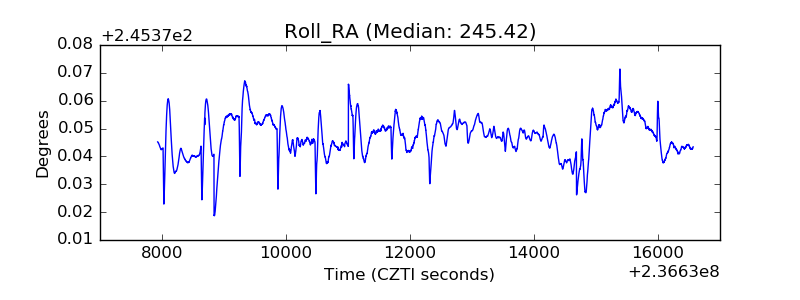 |
| Veto Counter | 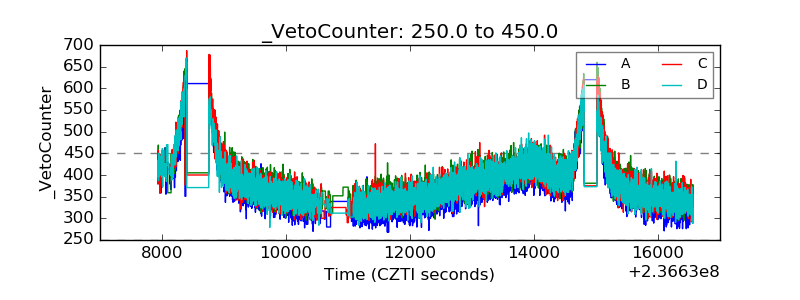 |