| Param | Original file | Final file |
|---|---|---|
| Filename | modeM0/AS1G05_230T06_9000001350_09515cztM0_level2.evt | modeM0/AS1G05_230T06_9000001350_09515cztM0_level2_quad_clean.evt |
| Size (bytes) | 359,700,480 | 75,850,560 |
| Size | 343.0 MB | 72.3 MB |
| Events in quadrant A | 2,679,091 | 483,520 |
| Events in quadrant B | 2,539,862 | 488,574 |
| Events in quadrant C | 2,446,950 | 481,961 |
| Events in quadrant D | 2,855,125 | 461,378 |
| Mode M0 | |||
|---|---|---|---|
| Quadrant | BADHDUFLAG | Total packets | Discarded packets |
| A | 0 | 17923 | 6357 |
| B | 0 | 17221 | 5975 |
| C | 0 | 17003 | 5718 |
| D | 0 | 19319 | 7364 |
| Mode SS | |||
|---|---|---|---|
| Quadrant | BADHDUFLAG | Total packets | Discarded packets |
| A | 0 | 170 | 52 |
| B | 0 | 169 | 59 |
| C | 0 | 169 | 41 |
| D | 0 | 170 | 62 |
| Mode M9 | |||
|---|---|---|---|
| Quadrant | BADHDUFLAG | Total packets | Discarded packets |
| A | 0 | 6 | 1 |
| B | 0 | 5 | 2 |
| C | 0 | 5 | 2 |
| D | 0 | 5 | 2 |
| Quadrant | Total seconds | Saturated seconds | Saturation percentage |
|---|---|---|---|
| A | 5386 | 38 | 0.705533% |
| B | 5436 | 34 | 0.625460% |
| C | 5461 | 32 | 0.585973% |
| D | 5363 | 18 | 0.335633% |
Noise dominated data is calculated using 1-second bins in cleaned event files. If a bin has >2000 counts, and if more than 50% of those come from <1% of pixels, then it is considered to be noise-dominated and hence unusable.
| Quadrant | # 1 sec bins | Bins with >0 counts | Bins with >2000 counts | High rate bins dominated by noise | Noise dominated (total time) | Noise dominated (detector-on time) | Marked lightcurve |
|---|---|---|---|---|---|---|---|
| A | 8777 | 6624 | 0 | 0 | 0.00% | 0.00% | 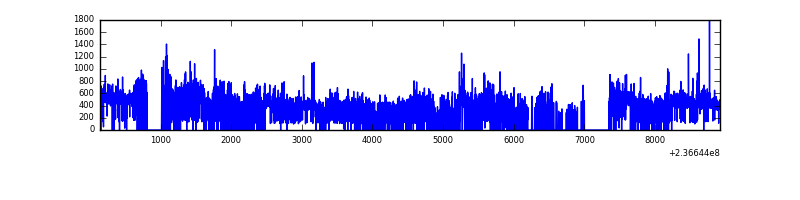 |
| B | 8777 | 6671 | 0 | 0 | 0.00% | 0.00% |  |
| C | 8775 | 6705 | 15 | 15 | 0.17% | 0.22% | 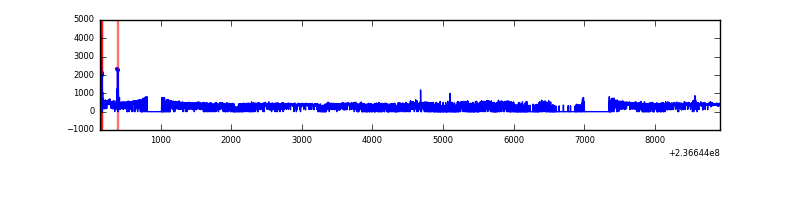 |
| D | 8777 | 6601 | 7 | 7 | 0.08% | 0.11% | 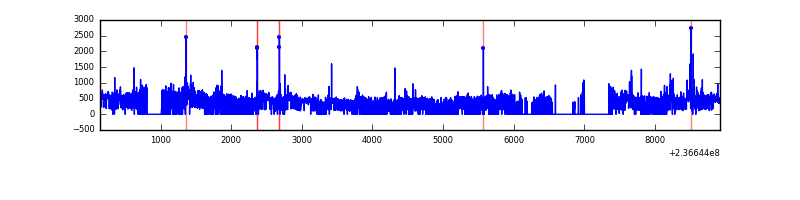 |
Top three noisy pixels from each quadrant. If the there are fewer than three noisy pixels in the level2.evt file, extra rows are filled as -1
| Pixel properties | Quadrant properties | ||||||
|---|---|---|---|---|---|---|---|
| Quadrant | DetID | PixID | Counts | Sigma | Mean | Median | Sigma |
| A | 1 | 162 | 119191 | 909.5 | 622 | 607 | 130.4 |
| A | 1 | 178 | 46993 | 355.77 | 622 | 607 | 130.4 |
| A | 1 | 161 | 44235 | 334.61 | 622 | 607 | 130.4 |
| B | 0 | 219 | 30402 | 241.02 | 631 | 614 | 123.6 |
| B | 0 | 214 | 27704 | 219.19 | 631 | 614 | 123.6 |
| B | 0 | 187 | 16143 | 125.64 | 631 | 614 | 123.6 |
| C | 4 | 254 | 69329 | 480.48 | 606 | 607 | 143.0 |
| C | 9 | 68 | 7130 | 45.61 | 606 | 607 | 143.0 |
| C | 13 | 61 | 4527 | 27.41 | 606 | 607 | 143.0 |
| D | 8 | 195 | 340669 | 2142.78 | 592 | 578 | 158.7 |
| D | 1 | 52 | 69737 | 435.74 | 592 | 578 | 158.7 |
| D | 2 | 152 | 42548 | 264.44 | 592 | 578 | 158.7 |
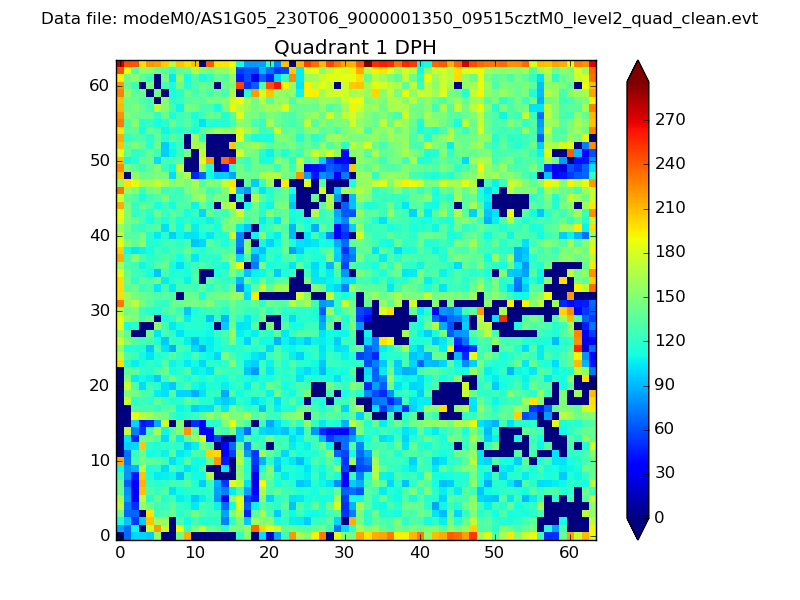
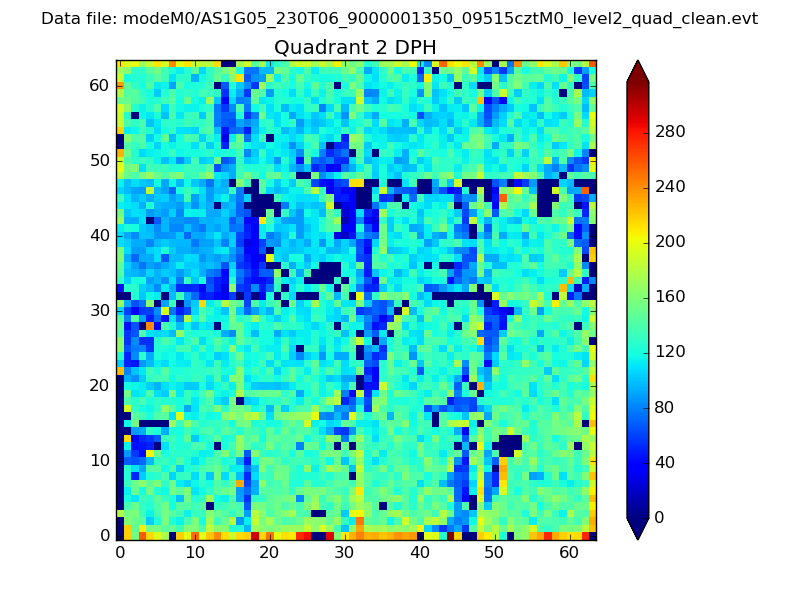
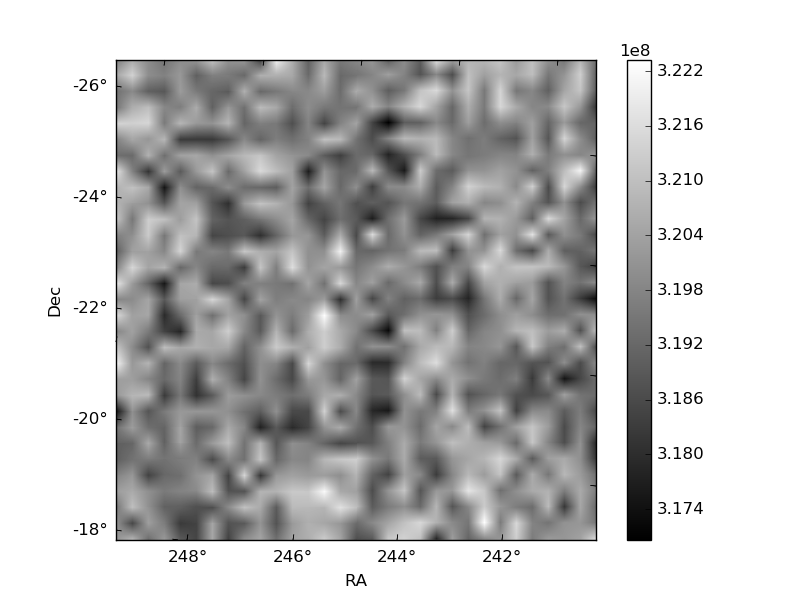
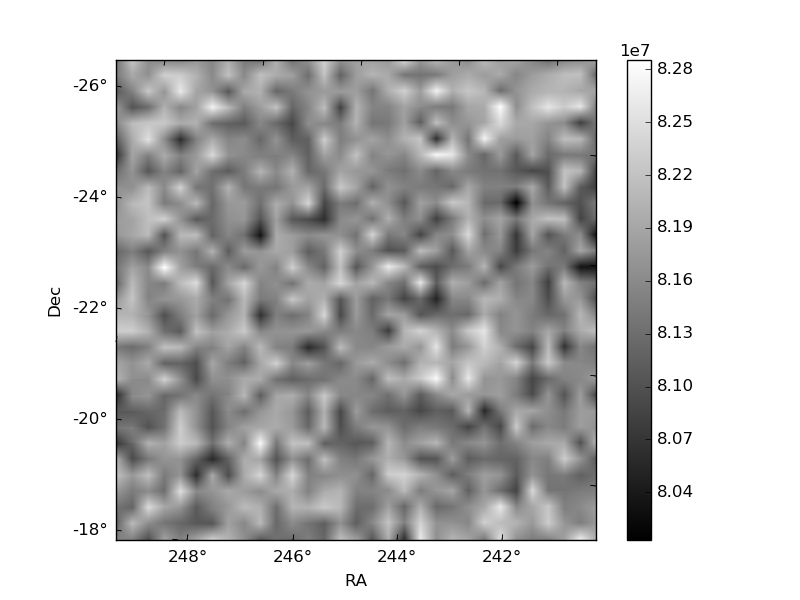
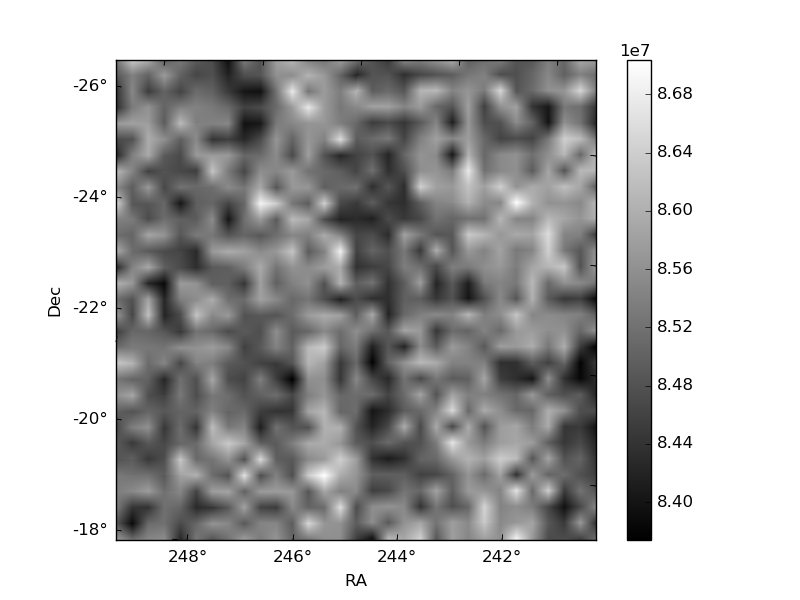
Histogram calculated using DETX and DETY for each event in the final _common_clean file
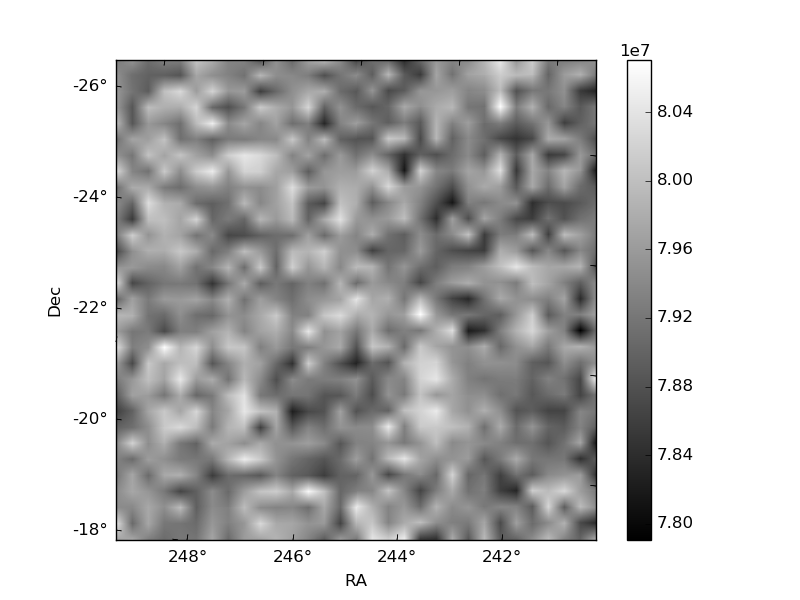
| Quadrant A | 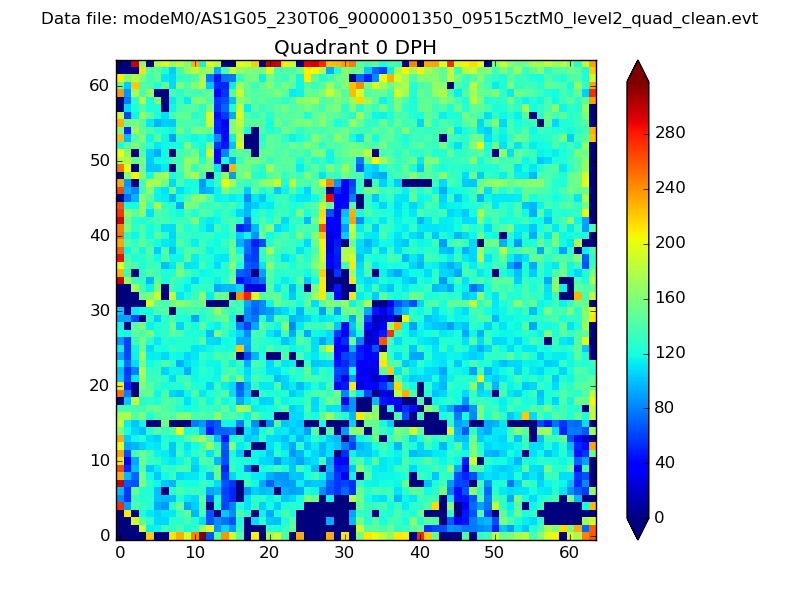 |
 |
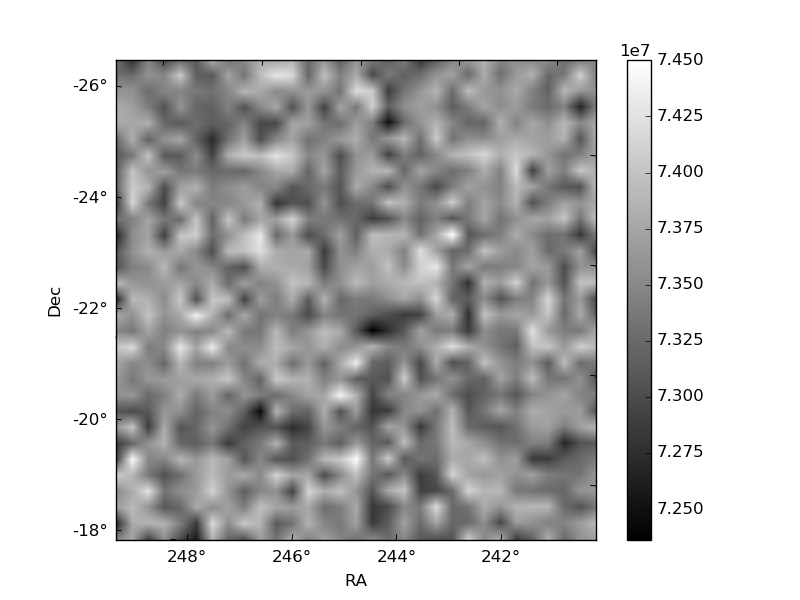
Quadrant B |
|---|---|---|---|
| Quadrant D | 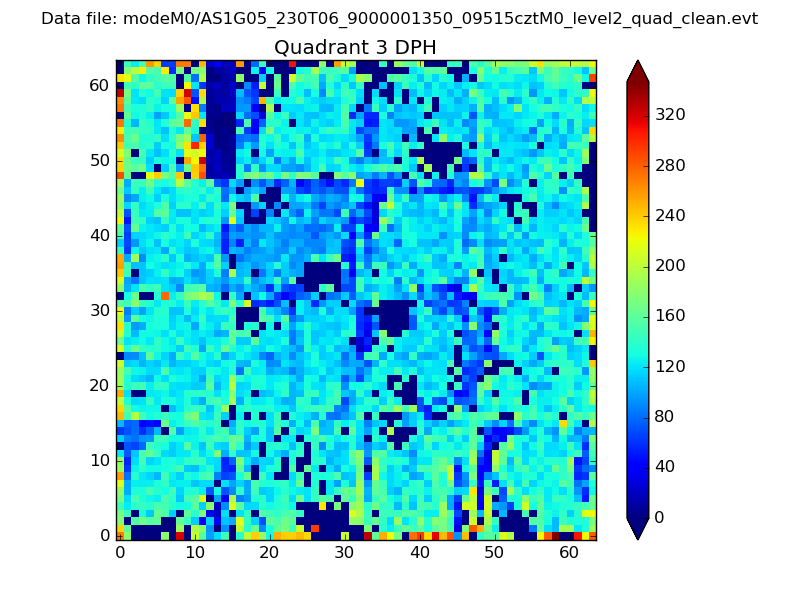 |
 |
Quadrant C |
| Plot type | Count rate plots | Images |
|---|---|---|
| Comparison with Poisson distribution Blue bars denote a histogram of data divided into 1 sec bins. Red curve is a Poisson curve with rate = median count rate of data. |
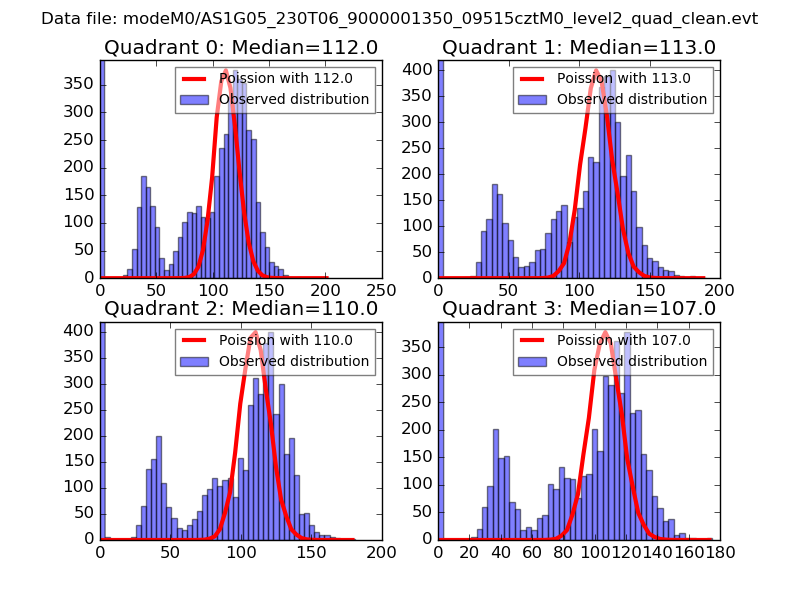 |
 |
| Quadrant-wise count rates Data is divided into 100 sec bins |
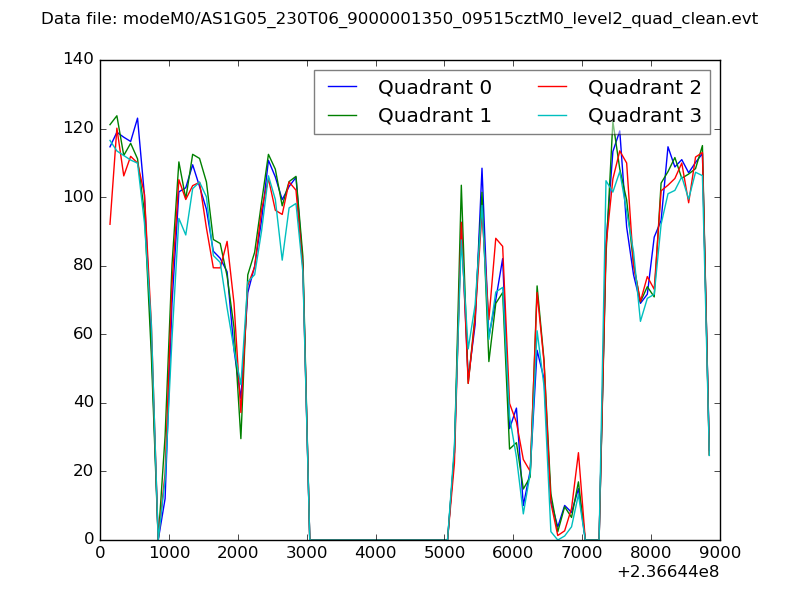 |
|
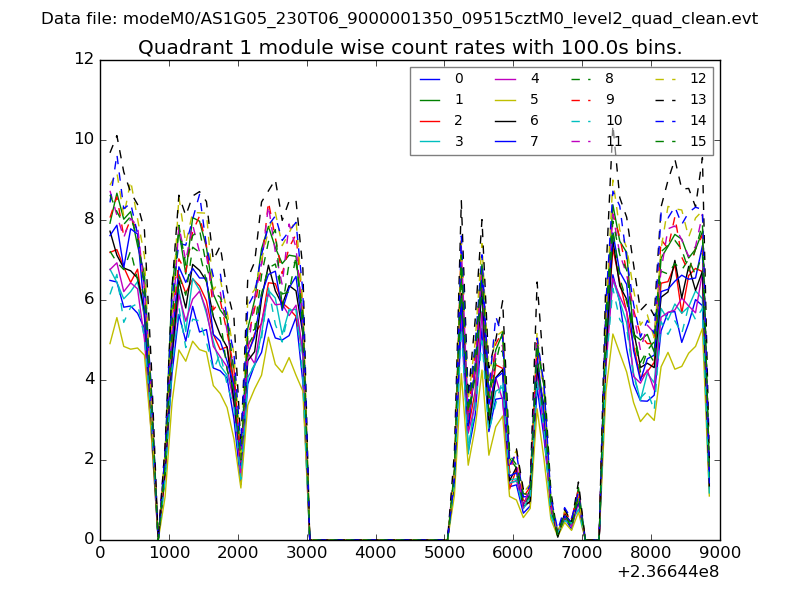
| Module-wise count rates for Quadrant A Data is divided into 100 sec bins |
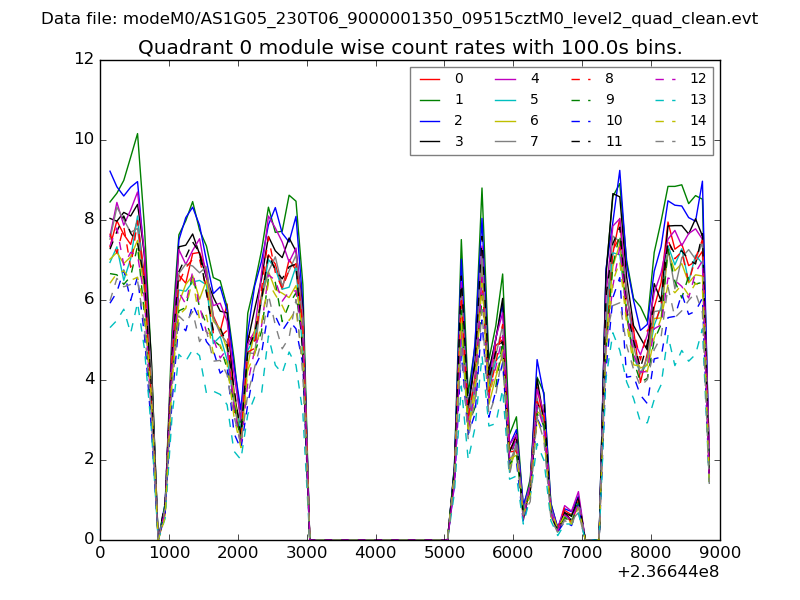 |
 |
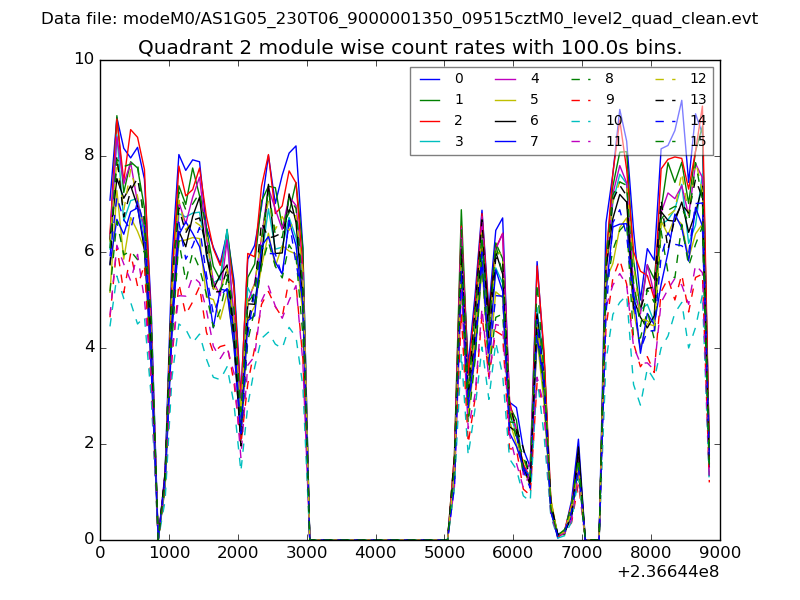
| Module-wise count rates for Quadrant B Data is divided into 100 sec bins |
 |
 |
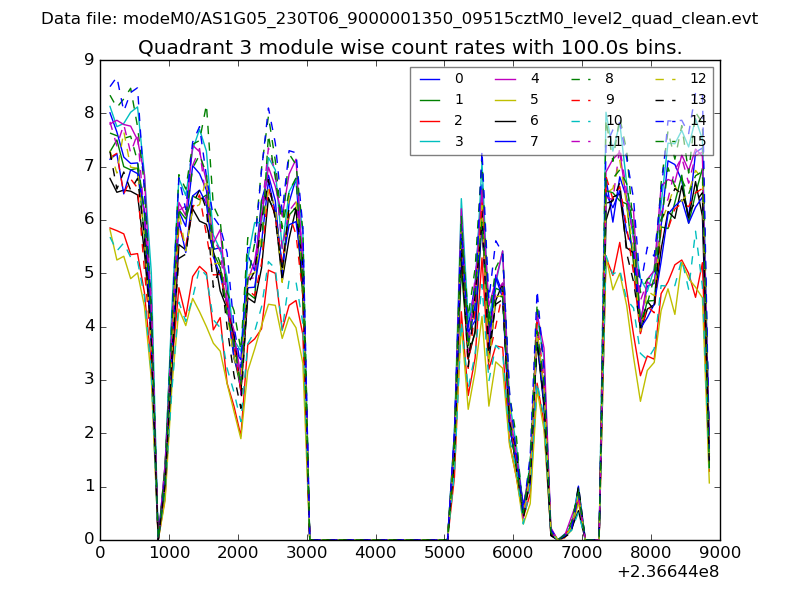
| Module-wise count rates for Quadrant C Data is divided into 100 sec bins |
 |
 |
| Module-wise count rates for Quadrant D Data is divided into 100 sec bins |
 |
 |
| Parameter | Plot |
|---|---|
| CZT HV Monitor | 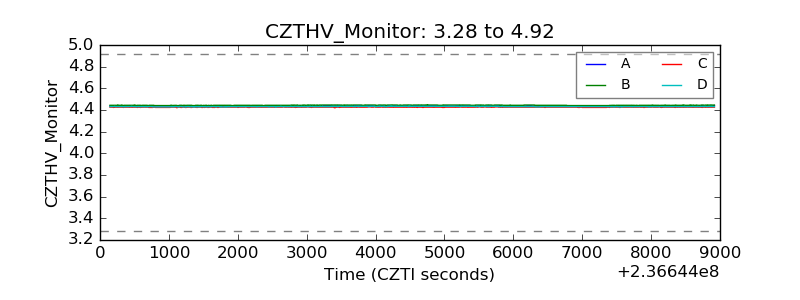 |
| D_VDD | 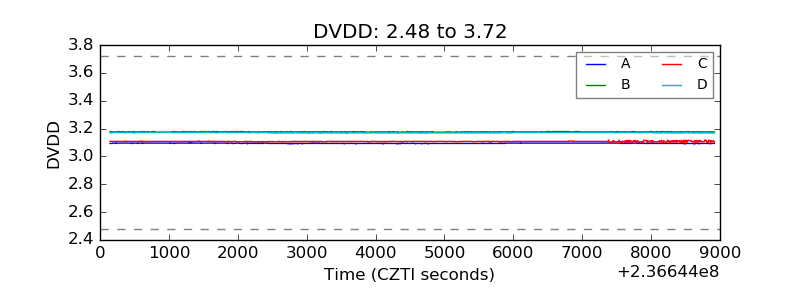 |
| Temperature 1 | 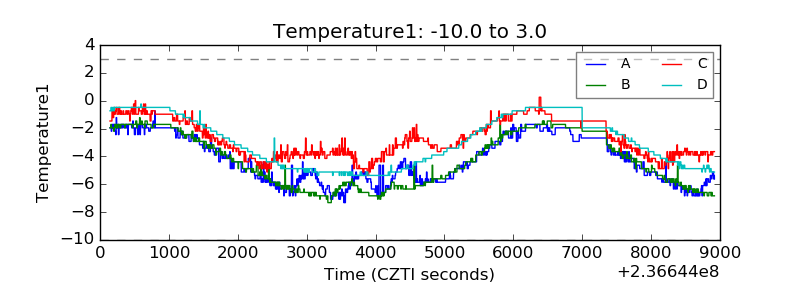 |
| Veto HV Monitor | 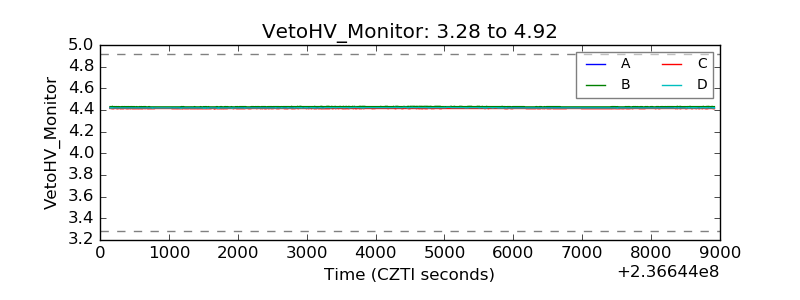 |
| Veto LLD |  |
| Alpha Counter | 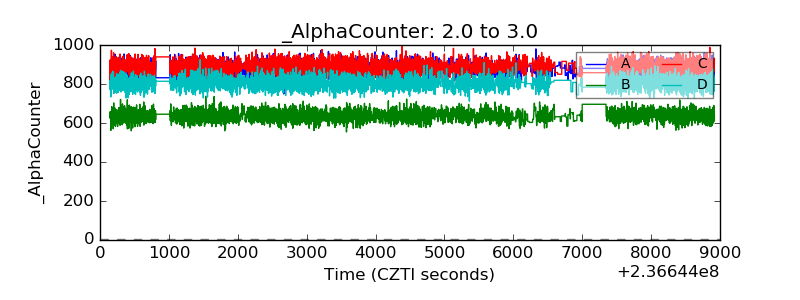 |
| _CPM_Rate | 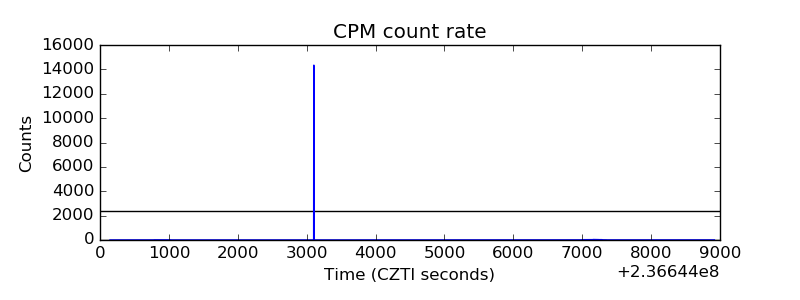 |
| CZT Counter | 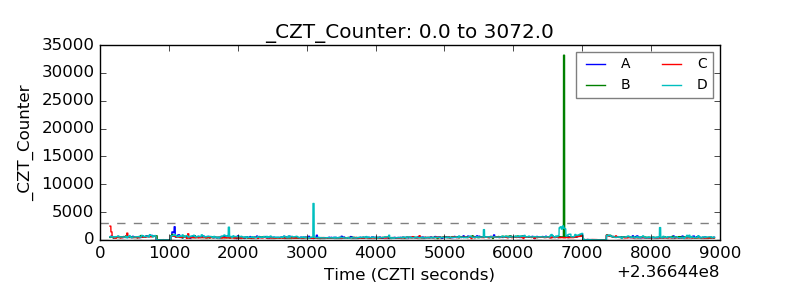 |
| +2.5 Volts monitor |  |
| +5 Volts monitor |  |
| _ROLL_ROT |  |
| _Roll_DEC | 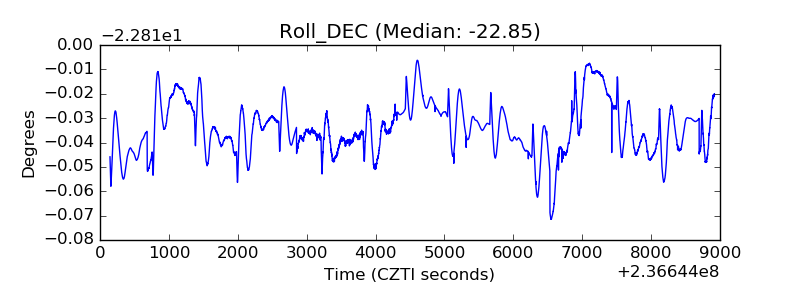 |
| _Roll_RA | 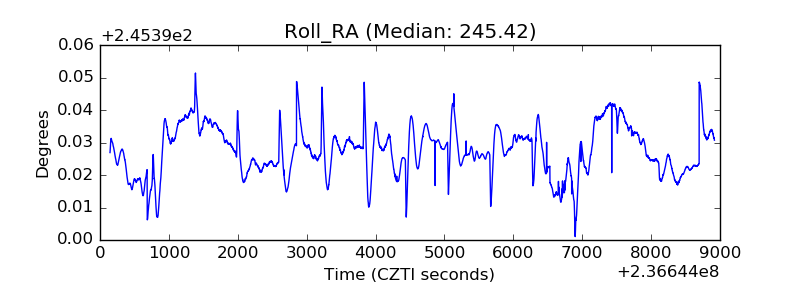 |
| Veto Counter | 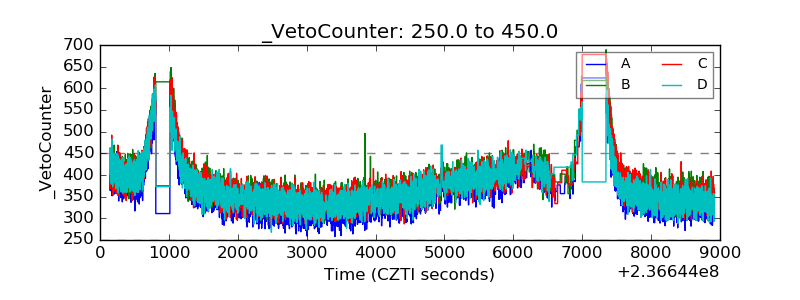 |