| Param | Original file | Final file |
|---|---|---|
| Filename | modeM0/AS1G05_230T06_9000001350_09517cztM0_level2.evt | modeM0/AS1G05_230T06_9000001350_09517cztM0_level2_quad_clean.evt |
| Size (bytes) | 567,233,280 | 97,153,920 |
| Size | 541.0 MB | 92.7 MB |
| Events in quadrant A | 4,260,836 | 594,382 |
| Events in quadrant B | 4,044,090 | 603,552 |
| Events in quadrant C | 3,775,043 | 589,273 |
| Events in quadrant D | 4,514,296 | 559,367 |
| Mode M0 | |||
|---|---|---|---|
| Quadrant | BADHDUFLAG | Total packets | Discarded packets |
| A | 0 | 27235 | 9056 |
| B | 0 | 26421 | 8688 |
| C | 0 | 25707 | 8371 |
| D | 0 | 28851 | 9809 |
| Mode SS | |||
|---|---|---|---|
| Quadrant | BADHDUFLAG | Total packets | Discarded packets |
| A | 0 | 257 | 86 |
| B | 0 | 258 | 80 |
| C | 0 | 257 | 83 |
| D | 0 | 257 | 73 |
| Mode M9 | |||
|---|---|---|---|
| Quadrant | BADHDUFLAG | Total packets | Discarded packets |
| A | 0 | 13 | 2 |
| B | 0 | 13 | 0 |
| C | 0 | 13 | 2 |
| D | 0 | 14 | 1 |
| Quadrant | Total seconds | Saturated seconds | Saturation percentage |
|---|---|---|---|
| A | 8512 | 50 | 0.587406% |
| B | 8589 | 28 | 0.325998% |
| C | 8601 | 8 | 0.093012% |
| D | 8442 | 25 | 0.296138% |
Noise dominated data is calculated using 1-second bins in cleaned event files. If a bin has >2000 counts, and if more than 50% of those come from <1% of pixels, then it is considered to be noise-dominated and hence unusable.
| Quadrant | # 1 sec bins | Bins with >0 counts | Bins with >2000 counts | High rate bins dominated by noise | Noise dominated (total time) | Noise dominated (detector-on time) | Marked lightcurve |
|---|---|---|---|---|---|---|---|
| A | 14024 | 10443 | 4 | 4 | 0.03% | 0.04% | 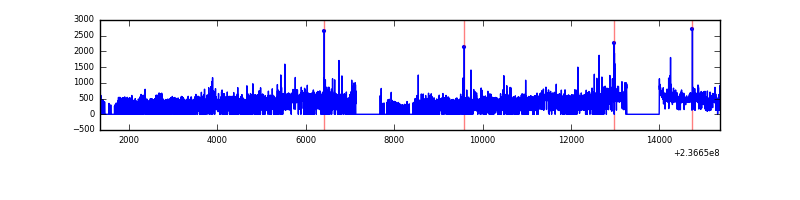 |
| B | 14024 | 10546 | 1 | 1 | 0.01% | 0.01% | 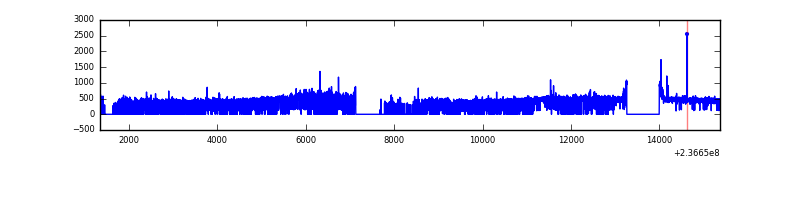 |
| C | 14020 | 10502 | 0 | 0 | 0.00% | 0.00% | 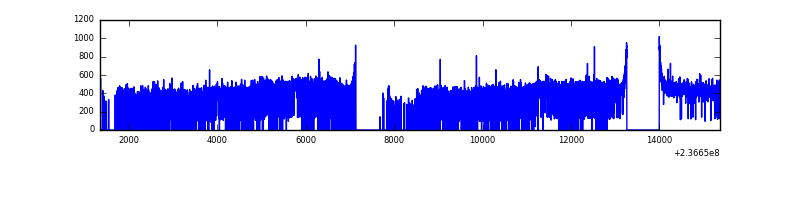 |
| D | 14024 | 10429 | 7 | 7 | 0.05% | 0.07% | 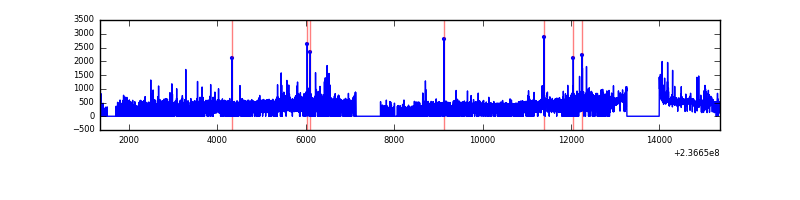 |
Top three noisy pixels from each quadrant. If the there are fewer than three noisy pixels in the level2.evt file, extra rows are filled as -1
| Pixel properties | Quadrant properties | ||||||
|---|---|---|---|---|---|---|---|
| Quadrant | DetID | PixID | Counts | Sigma | Mean | Median | Sigma |
| A | 1 | 162 | 210999 | 1037.14 | 987 | 968 | 202.5 |
| A | 1 | 178 | 82372 | 401.98 | 987 | 968 | 202.5 |
| A | 1 | 161 | 81983 | 400.06 | 987 | 968 | 202.5 |
| B | 0 | 214 | 83455 | 428.22 | 1001 | 975 | 192.6 |
| B | 0 | 219 | 43530 | 220.94 | 1001 | 975 | 192.6 |
| B | 12 | 111 | 21057 | 104.26 | 1001 | 975 | 192.6 |
| C | 8 | 128 | 7809 | 30.29 | 963 | 966 | 225.9 |
| C | 13 | 61 | 7208 | 27.63 | 963 | 966 | 225.9 |
| C | 8 | 222 | 4773 | 16.85 | 963 | 966 | 225.9 |
| D | 8 | 195 | 464476 | 1939.03 | 939 | 913 | 239.1 |
| D | 1 | 52 | 149224 | 620.36 | 939 | 913 | 239.1 |
| D | 2 | 152 | 120020 | 498.21 | 939 | 913 | 239.1 |
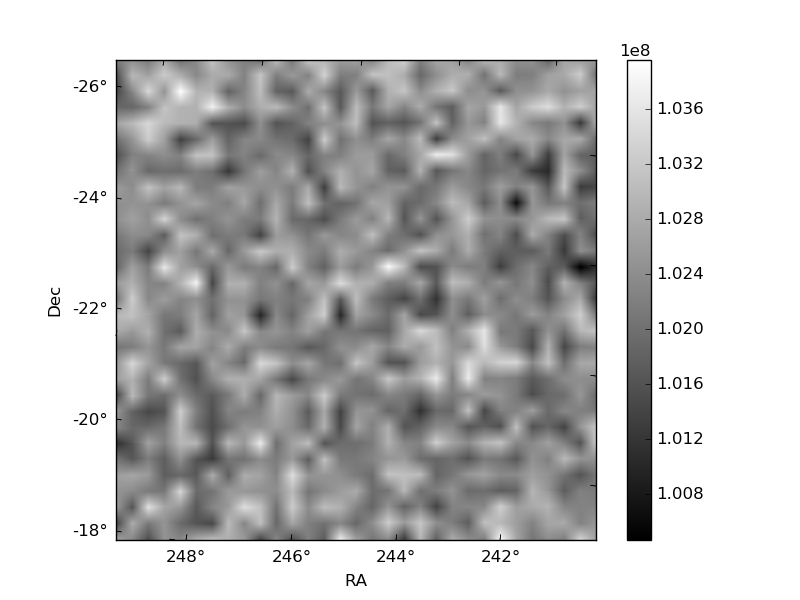
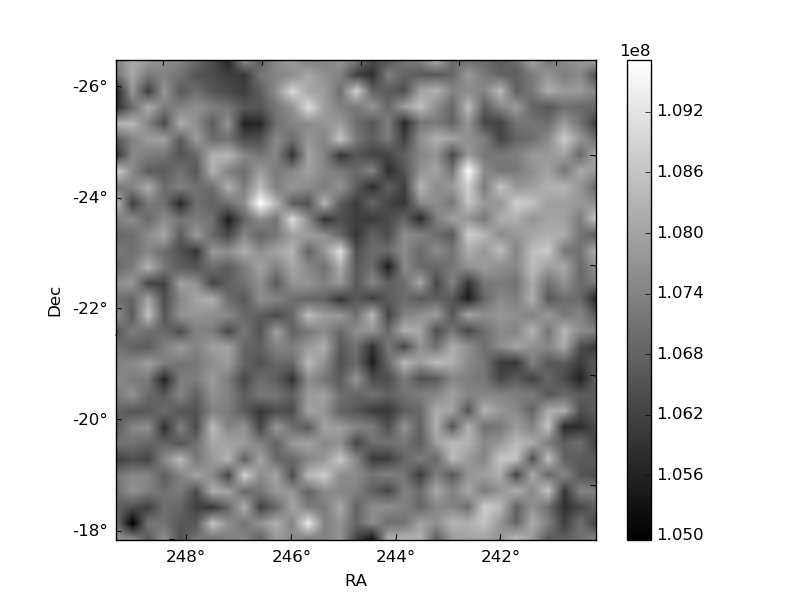
Histogram calculated using DETX and DETY for each event in the final _common_clean file
| Quadrant A |  |
 |
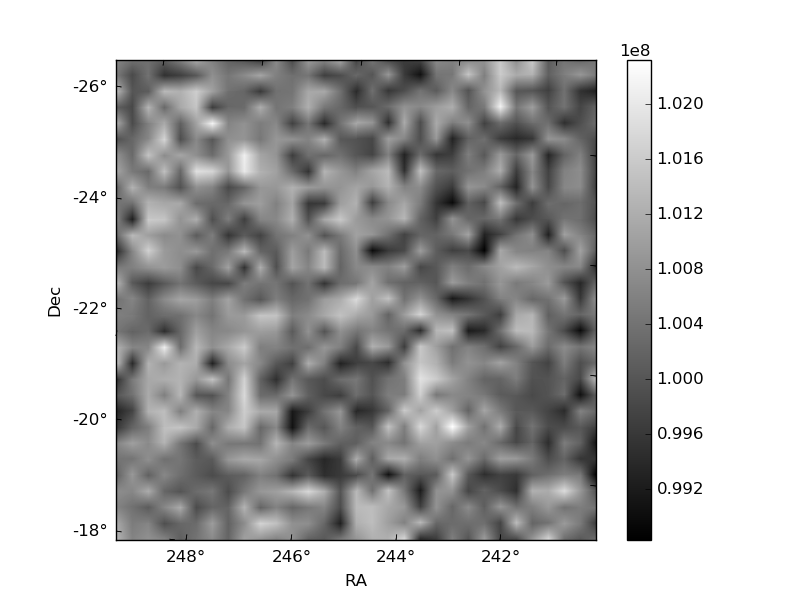
Quadrant B |
|---|---|---|---|
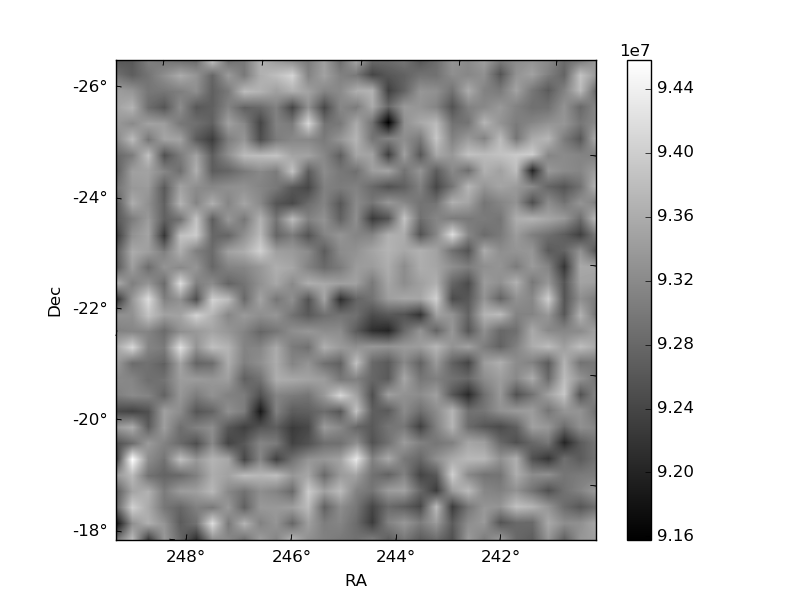
| Quadrant D |  |
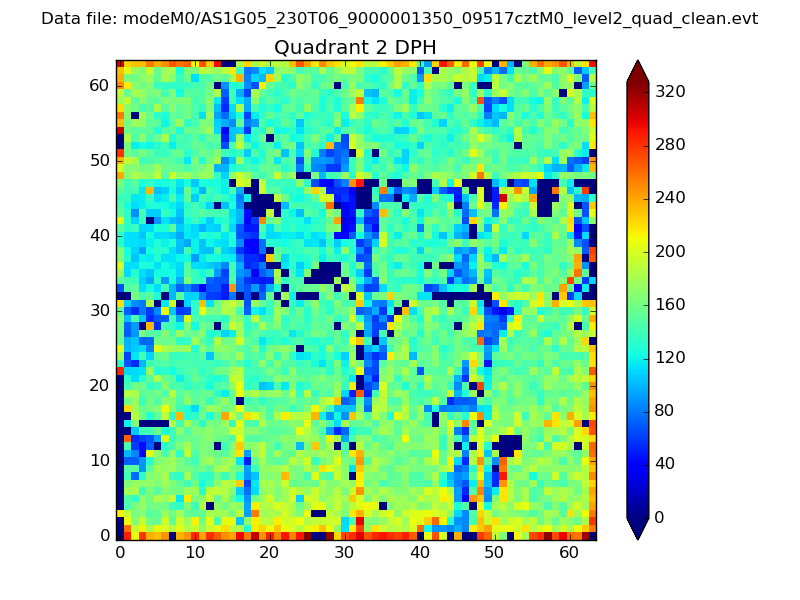 |
Quadrant C |
| Plot type | Count rate plots | Images |
|---|---|---|
| Comparison with Poisson distribution Blue bars denote a histogram of data divided into 1 sec bins. Red curve is a Poisson curve with rate = median count rate of data. |
 |
 |
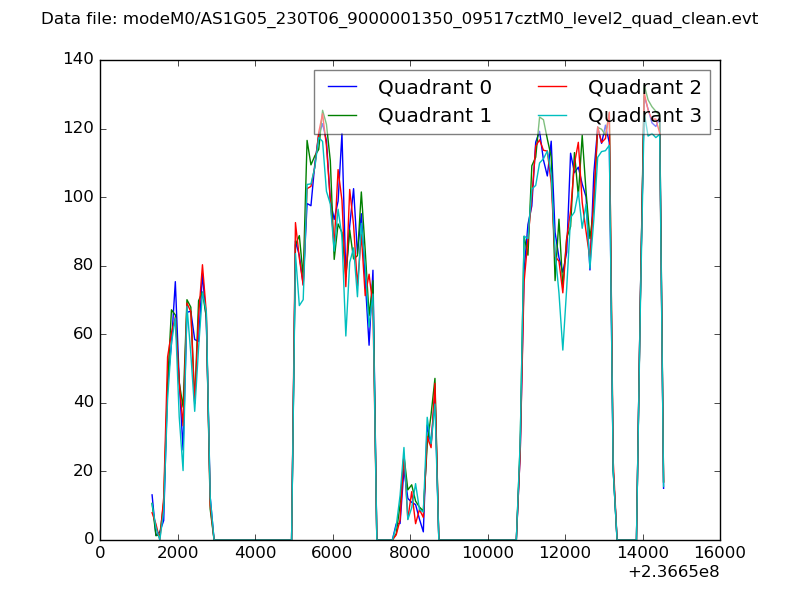
| Quadrant-wise count rates Data is divided into 100 sec bins |
 |
|
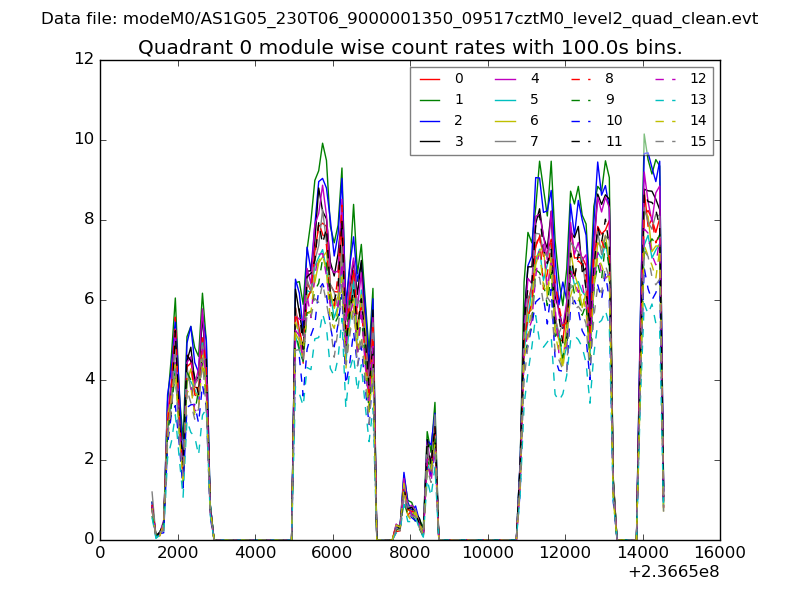
| Module-wise count rates for Quadrant A Data is divided into 100 sec bins |
 |
 |
| Module-wise count rates for Quadrant B Data is divided into 100 sec bins |
 |
 |
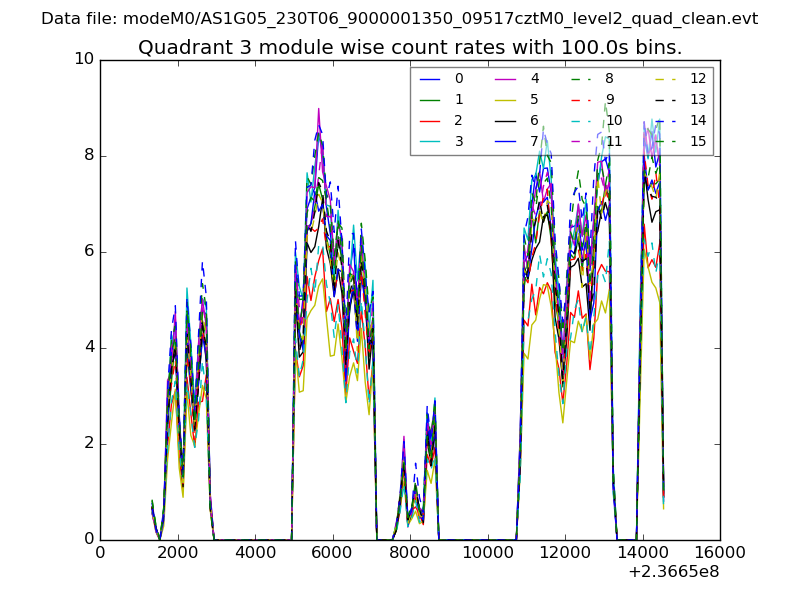
| Module-wise count rates for Quadrant C Data is divided into 100 sec bins |
 |
 |
| Module-wise count rates for Quadrant D Data is divided into 100 sec bins |
 |
 |
| Parameter | Plot |
|---|---|
| CZT HV Monitor |  |
| D_VDD | 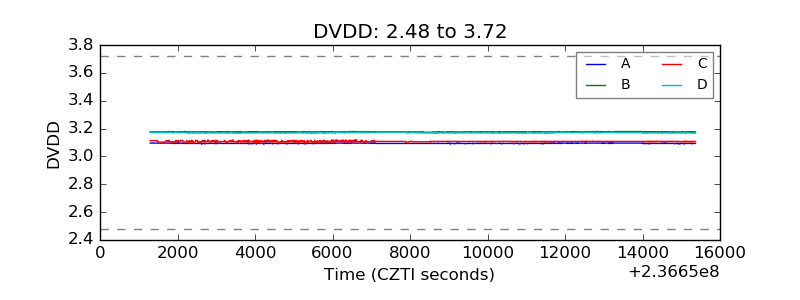 |
| Temperature 1 |  |
| Veto HV Monitor | 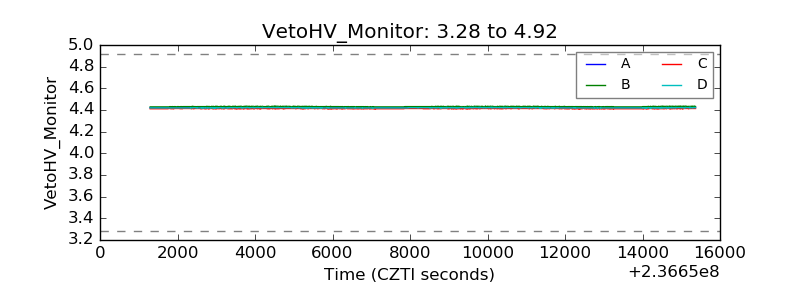 |
| Veto LLD | 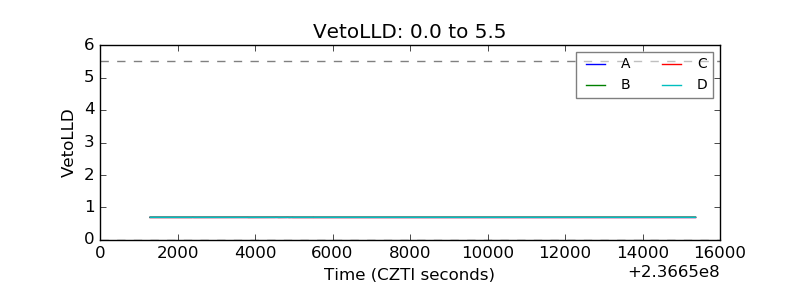 |
| Alpha Counter | 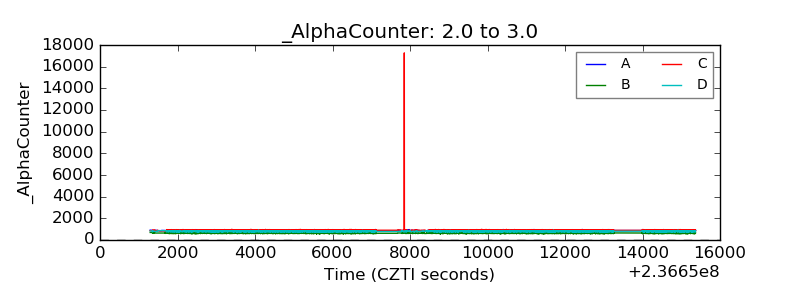 |
| _CPM_Rate | 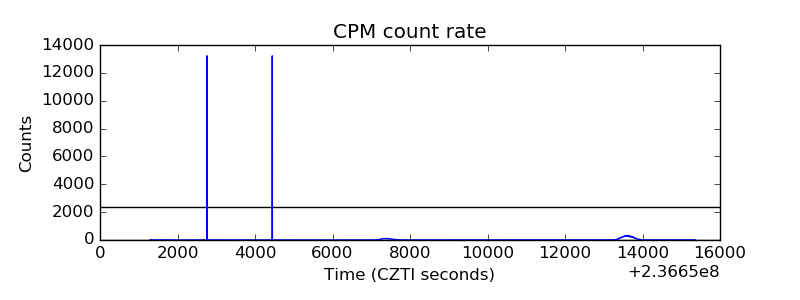 |
| CZT Counter | 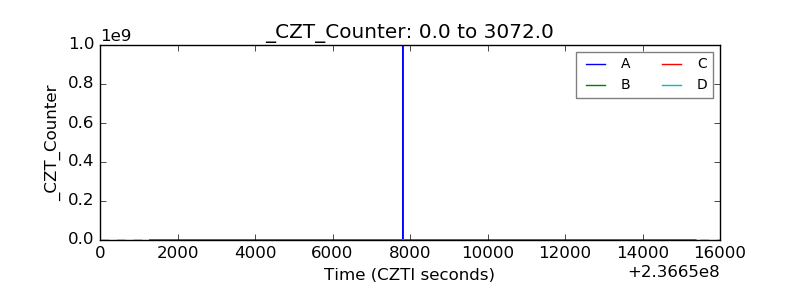 |
| +2.5 Volts monitor |  |
| +5 Volts monitor |  |
| _ROLL_ROT | 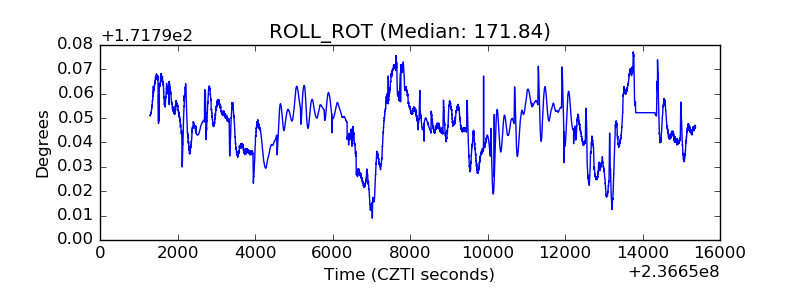 |
| _Roll_DEC | 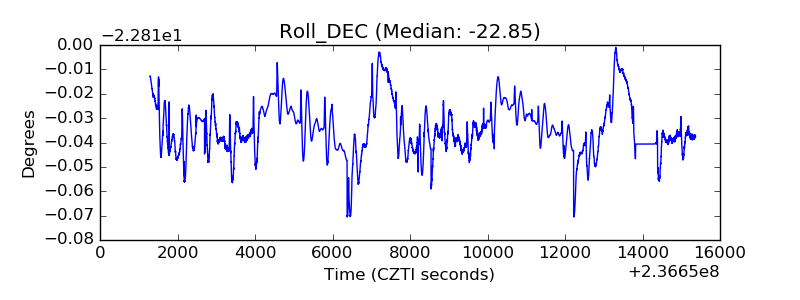 |
| _Roll_RA | 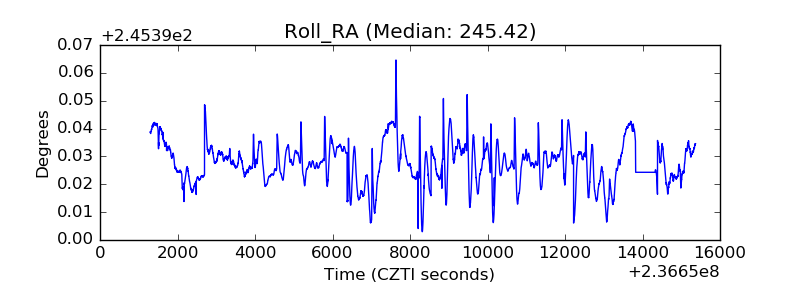 |
| Veto Counter | 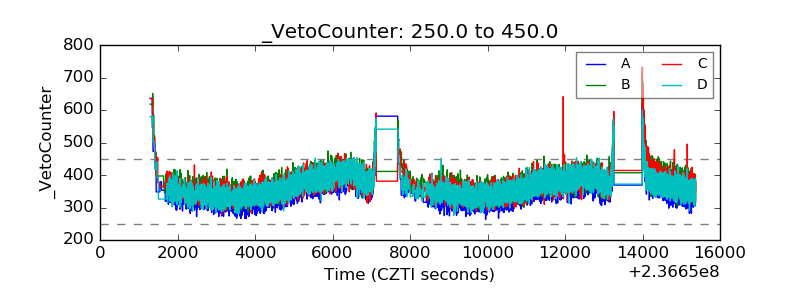 |