| Param | Original file | Final file |
|---|---|---|
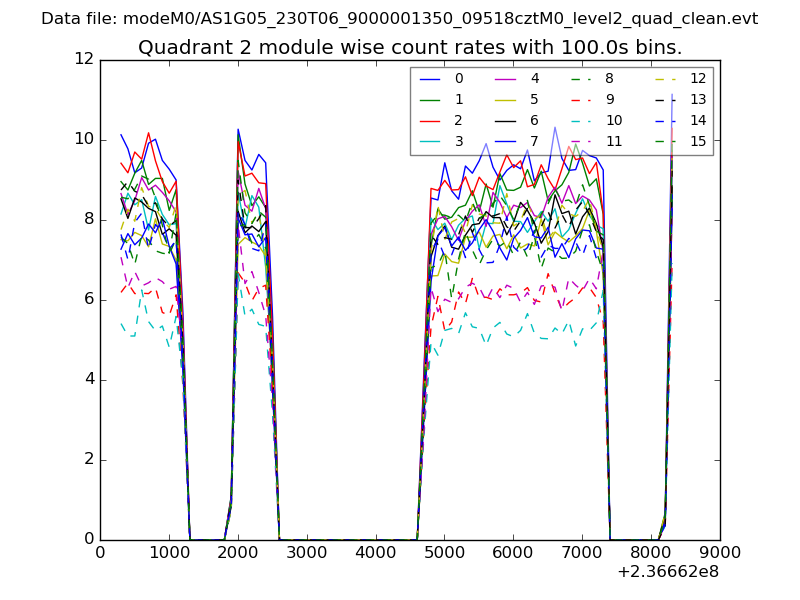
| Filename | modeM0/AS1G05_230T06_9000001350_09518cztM0_level2.evt | modeM0/AS1G05_230T06_9000001350_09518cztM0_level2_quad_clean.evt |
| Size (bytes) | 538,554,240 | 87,937,920 |
| Size | 513.6 MB | 83.9 MB |
| Events in quadrant A | 4,073,328 | 532,910 |
| Events in quadrant B | 3,831,349 | 538,224 |
| Events in quadrant C | 3,544,821 | 530,110 |
| Events in quadrant D | 4,322,883 | 510,642 |
| Mode M0 | |||
|---|---|---|---|
| Quadrant | BADHDUFLAG | Total packets | Discarded packets |
| A | 0 | 17149 | 3 |
| B | 0 | 16539 | 2 |
| C | 0 | 16072 | 2 |
| D | 0 | 18141 | 10 |
| Mode SS | |||
|---|---|---|---|
| Quadrant | BADHDUFLAG | Total packets | Discarded packets |
| A | 0 | 160 | 0 |
| B | 0 | 160 | 0 |
| C | 0 | 160 | 0 |
| D | 0 | 160 | 0 |
| Mode M9 | |||
|---|---|---|---|
| Quadrant | BADHDUFLAG | Total packets | Discarded packets |
| A | 0 | 17 | 0 |
| B | 0 | 17 | 0 |
| C | 0 | 17 | 0 |
| D | 0 | 17 | 0 |
| Quadrant | Total seconds | Saturated seconds | Saturation percentage |
|---|---|---|---|
| A | 7933 | 58 | 0.731123% |
| B | 7933 | 48 | 0.605067% |
| C | 7933 | 10 | 0.126056% |
| D | 7930 | 68 | 0.857503% |
Noise dominated data is calculated using 1-second bins in cleaned event files. If a bin has >2000 counts, and if more than 50% of those come from <1% of pixels, then it is considered to be noise-dominated and hence unusable.
| Quadrant | # 1 sec bins | Bins with >0 counts | Bins with >2000 counts | High rate bins dominated by noise | Noise dominated (total time) | Noise dominated (detector-on time) | Marked lightcurve |
|---|---|---|---|---|---|---|---|
| A | 9573 | 7935 | 7 | 7 | 0.07% | 0.09% | 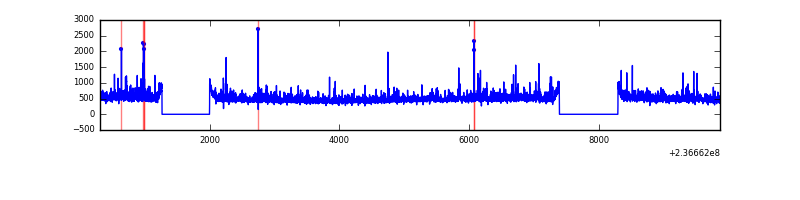 |
| B | 9573 | 7935 | 8 | 8 | 0.08% | 0.10% | 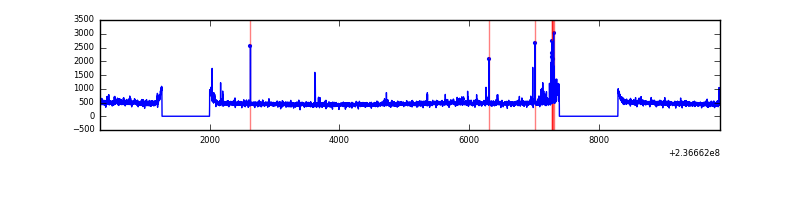 |
| C | 9573 | 7935 | 0 | 0 | 0.00% | 0.00% | 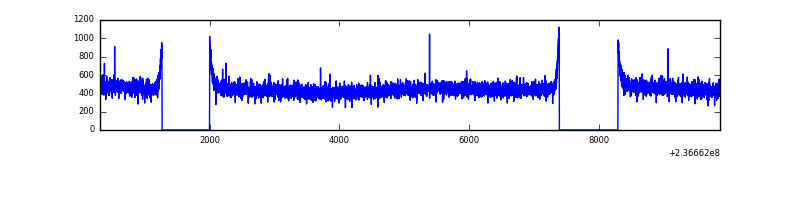 |
| D | 9573 | 7935 | 43 | 43 | 0.45% | 0.54% | 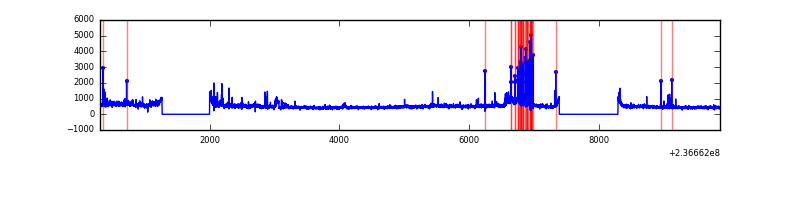 |
Top three noisy pixels from each quadrant. If the there are fewer than three noisy pixels in the level2.evt file, extra rows are filled as -1
| Pixel properties | Quadrant properties | ||||||
|---|---|---|---|---|---|---|---|
| Quadrant | DetID | PixID | Counts | Sigma | Mean | Median | Sigma |
| A | 1 | 162 | 220661 | 1143.53 | 936 | 915 | 192.2 |
| A | 1 | 161 | 82411 | 424.1 | 936 | 915 | 192.2 |
| A | 1 | 178 | 79646 | 409.71 | 936 | 915 | 192.2 |
| B | 10 | 252 | 94823 | 525.06 | 942 | 919 | 178.8 |
| B | 0 | 214 | 47084 | 258.13 | 942 | 919 | 178.8 |
| B | 12 | 111 | 19985 | 106.61 | 942 | 919 | 178.8 |
| C | 13 | 61 | 6698 | 27.26 | 907 | 910 | 212.3 |
| C | 8 | 222 | 4400 | 16.44 | 907 | 910 | 212.3 |
| C | 9 | 68 | 2320 | 6.64 | 907 | 910 | 212.3 |
| D | 8 | 195 | 451167 | 1926.04 | 897 | 873 | 233.8 |
| D | 1 | 52 | 166958 | 710.39 | 897 | 873 | 233.8 |
| D | 12 | 227 | 125459 | 532.89 | 897 | 873 | 233.8 |
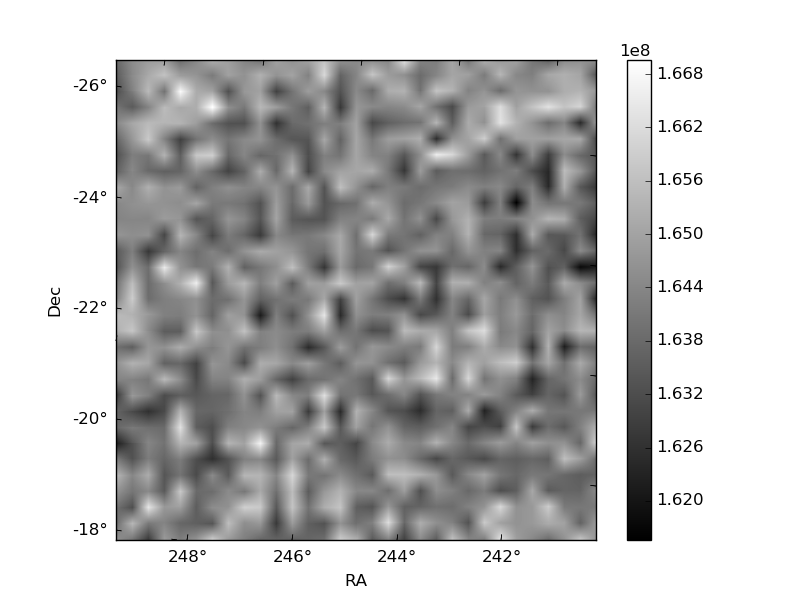
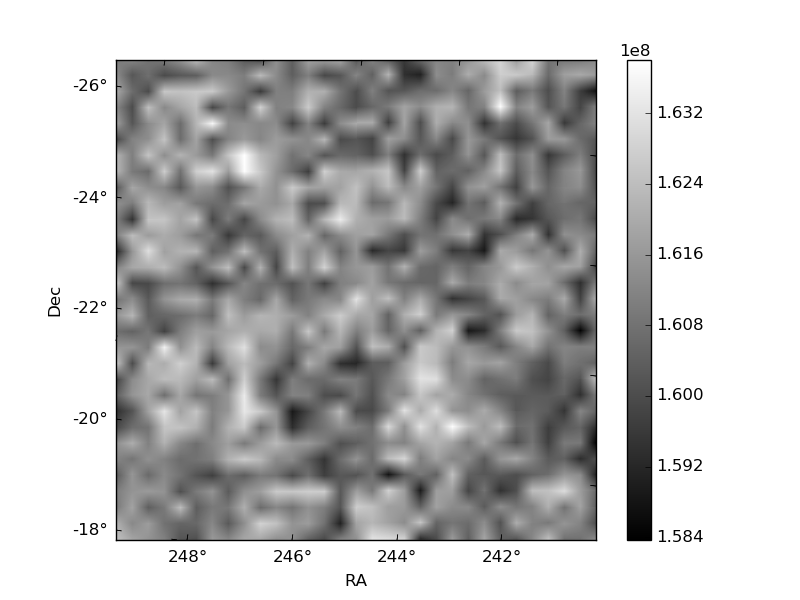
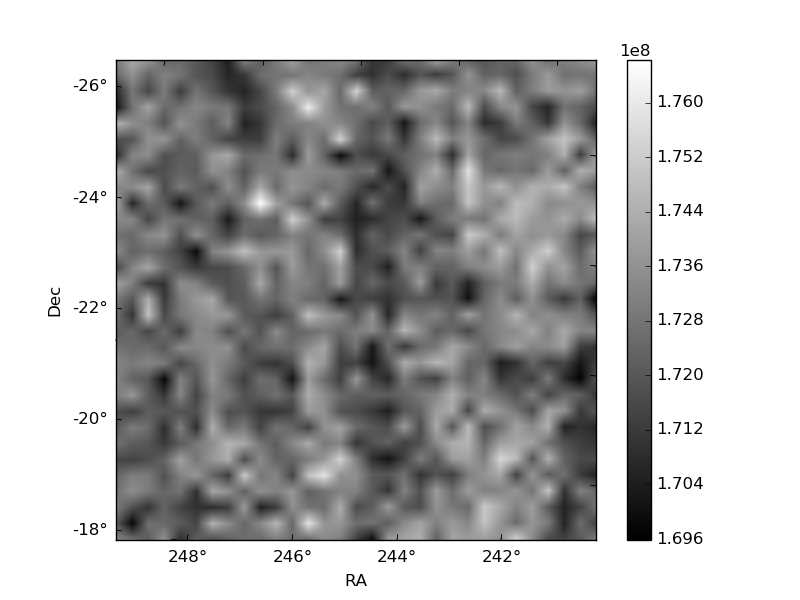
Histogram calculated using DETX and DETY for each event in the final _common_clean file
| Quadrant A |  |
 |
Quadrant B |
|---|---|---|---|
| Quadrant D |  |
 |
Quadrant C |
| Plot type | Count rate plots | Images |
|---|---|---|
| Comparison with Poisson distribution Blue bars denote a histogram of data divided into 1 sec bins. Red curve is a Poisson curve with rate = median count rate of data. |
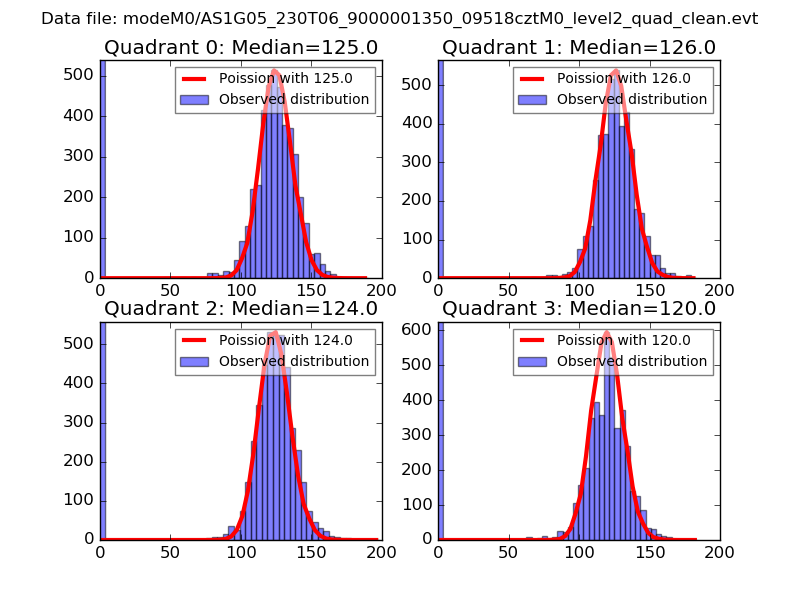 |
 |
| Quadrant-wise count rates Data is divided into 100 sec bins |
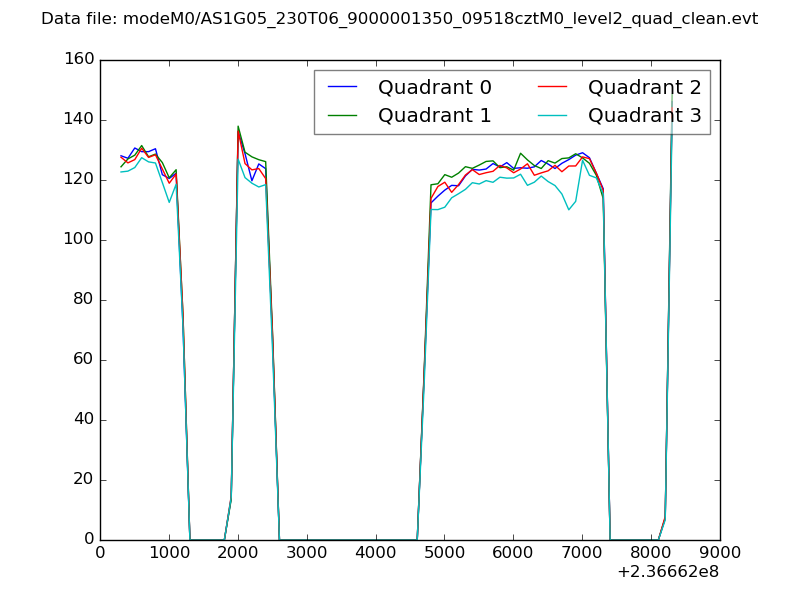 |
|
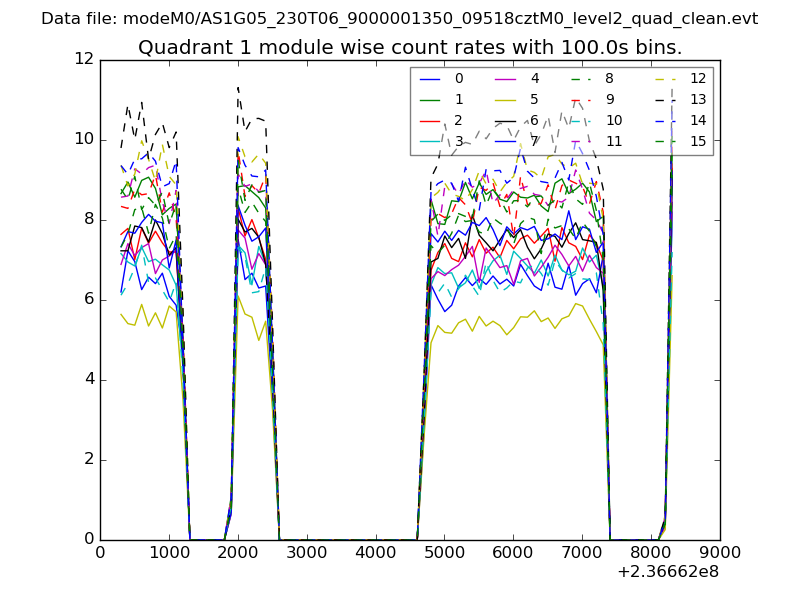
| Module-wise count rates for Quadrant A Data is divided into 100 sec bins |
 |
 |
| Module-wise count rates for Quadrant B Data is divided into 100 sec bins |
 |
 |
| Module-wise count rates for Quadrant C Data is divided into 100 sec bins |
 |
 |
| Module-wise count rates for Quadrant D Data is divided into 100 sec bins |
 |
 |
| Parameter | Plot |
|---|---|
| CZT HV Monitor | 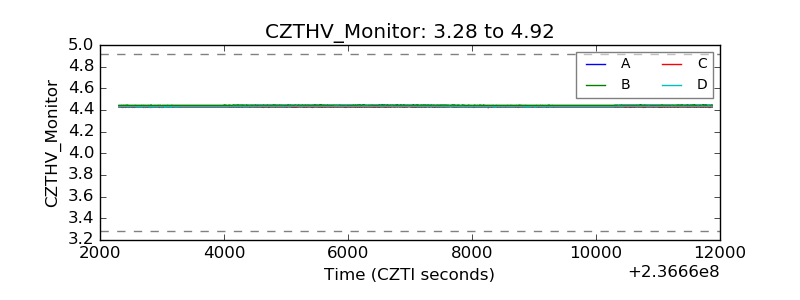 |
| D_VDD |  |
| Temperature 1 |  |
| Veto HV Monitor |  |
| Veto LLD |  |
| Alpha Counter | 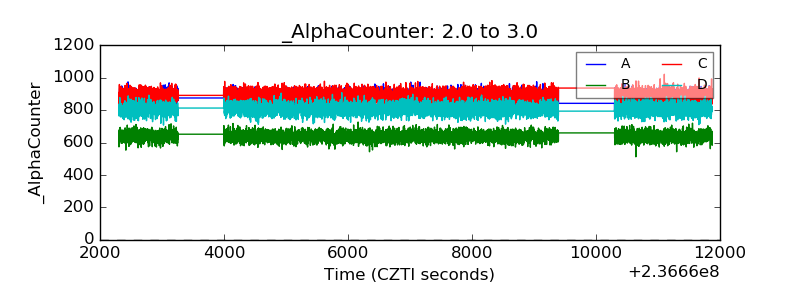 |
| _CPM_Rate | 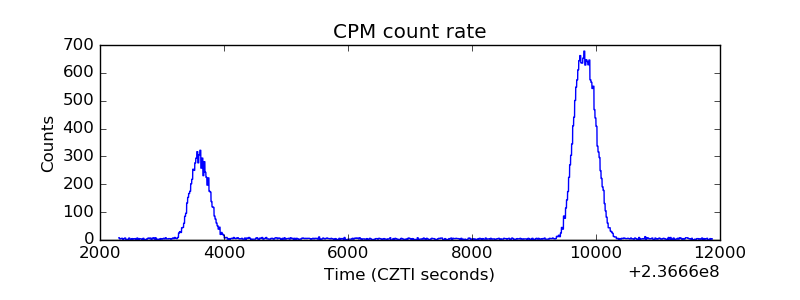 |
| CZT Counter |  |
| +2.5 Volts monitor |  |
| +5 Volts monitor |  |
| _ROLL_ROT |  |
| _Roll_DEC |  |
| _Roll_RA |  |
| Veto Counter |  |