| Param | Original file | Final file |
|---|---|---|
| Filename | modeM0/AS1G05_230T06_9000001350_09519cztM0_level2.evt | modeM0/AS1G05_230T06_9000001350_09519cztM0_level2_quad_clean.evt |
| Size (bytes) | 2,873,315,520 | 466,441,920 |
| Size | 2.7 GB | 444.8 MB |
| Events in quadrant A | 21,326,614 | 2,883,177 |
| Events in quadrant B | 19,160,911 | 2,916,097 |
| Events in quadrant C | 21,740,649 | 2,806,815 |
| Events in quadrant D | 22,078,676 | 2,763,011 |
| Mode M0 | |||
|---|---|---|---|
| Quadrant | BADHDUFLAG | Total packets | Discarded packets |
| A | 0 | 89554 | 9 |
| B | 0 | 83700 | 8 |
| C | 0 | 93207 | 12 |
| D | 0 | 92415 | 10 |
| Mode SS | |||
|---|---|---|---|
| Quadrant | BADHDUFLAG | Total packets | Discarded packets |
| A | 0 | 820 | 0 |
| B | 0 | 820 | 0 |
| C | 0 | 820 | 0 |
| D | 0 | 820 | 0 |
| Mode M9 | |||
|---|---|---|---|
| Quadrant | BADHDUFLAG | Total packets | Discarded packets |
| A | 0 | 40 | 0 |
| B | 0 | 40 | 0 |
| C | 0 | 40 | 0 |
| D | 0 | 40 | 0 |
| Quadrant | Total seconds | Saturated seconds | Saturation percentage |
|---|---|---|---|
| A | 40164 | 356 | 0.886366% |
| B | 40164 | 217 | 0.540285% |
| C | 40162 | 2834 | 7.056421% |
| D | 40163 | 368 | 0.916266% |
Noise dominated data is calculated using 1-second bins in cleaned event files. If a bin has >2000 counts, and if more than 50% of those come from <1% of pixels, then it is considered to be noise-dominated and hence unusable.
| Quadrant | # 1 sec bins | Bins with >0 counts | Bins with >2000 counts | High rate bins dominated by noise | Noise dominated (total time) | Noise dominated (detector-on time) | Marked lightcurve |
|---|---|---|---|---|---|---|---|
| A | 44314 | 40172 | 58 | 58 | 0.13% | 0.14% | 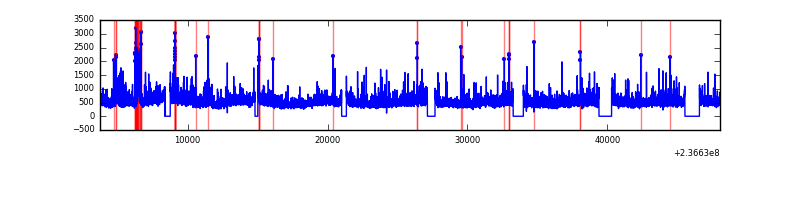 |
| B | 44314 | 40172 | 17 | 17 | 0.04% | 0.04% | 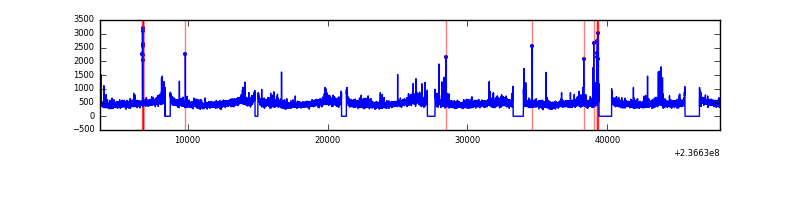 |
| C | 44314 | 40172 | 1157 | 1157 | 2.61% | 2.88% | 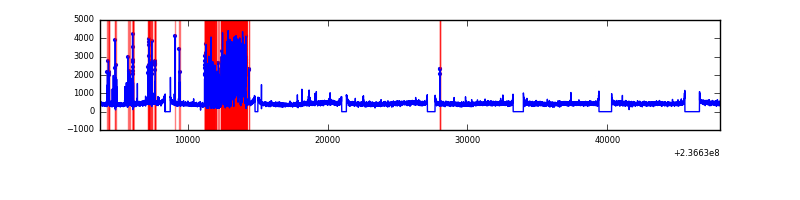 |
| D | 44314 | 40172 | 276 | 276 | 0.62% | 0.69% | 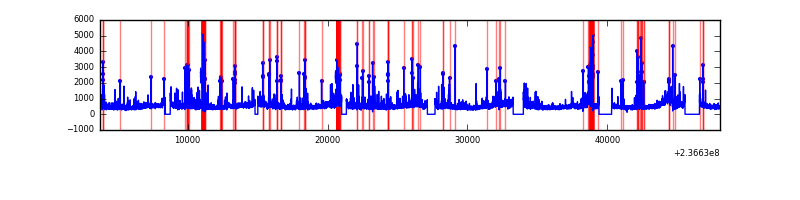 |
Top three noisy pixels from each quadrant. If the there are fewer than three noisy pixels in the level2.evt file, extra rows are filled as -1
| Pixel properties | Quadrant properties | ||||||
|---|---|---|---|---|---|---|---|
| Quadrant | DetID | PixID | Counts | Sigma | Mean | Median | Sigma |
| A | 8 | 5 | 1138761 | 1183.4 | 4705 | 4612 | 958.4 |
| A | 1 | 162 | 927603 | 963.08 | 4705 | 4612 | 958.4 |
| A | 1 | 178 | 355267 | 365.88 | 4705 | 4612 | 958.4 |
| B | 0 | 214 | 241117 | 264.21 | 4729 | 4618 | 895.1 |
| B | 0 | 219 | 229192 | 250.89 | 4729 | 4618 | 895.1 |
| B | 10 | 252 | 137090 | 148.0 | 4729 | 4618 | 895.1 |
| C | 4 | 254 | 4814595 | 4795.48 | 4320 | 4330 | 1003.1 |
| C | 14 | 234 | 37962 | 33.53 | 4320 | 4330 | 1003.1 |
| C | 13 | 61 | 32639 | 28.22 | 4320 | 4330 | 1003.1 |
| D | 8 | 195 | 2262641 | 1983.59 | 4513 | 4395 | 1138.5 |
| D | 1 | 52 | 1130885 | 989.48 | 4513 | 4395 | 1138.5 |
| D | 13 | 137 | 330421 | 286.37 | 4513 | 4395 | 1138.5 |
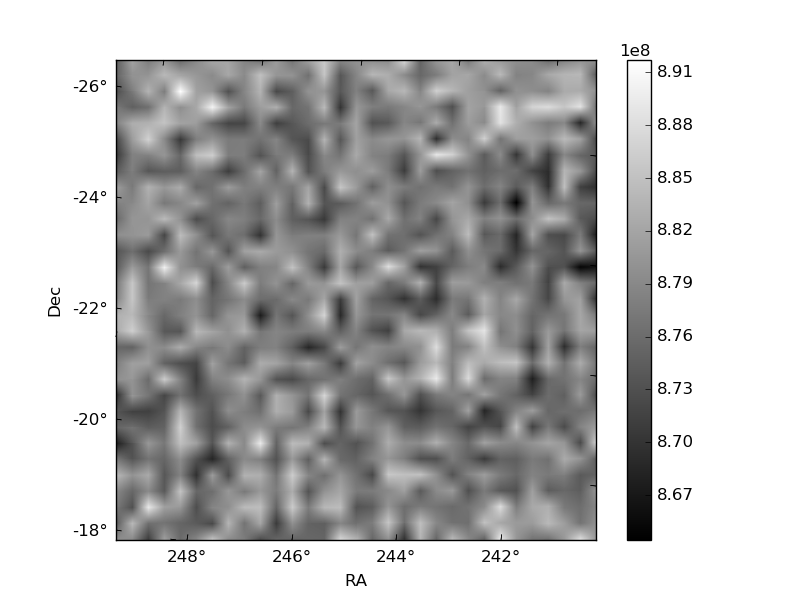
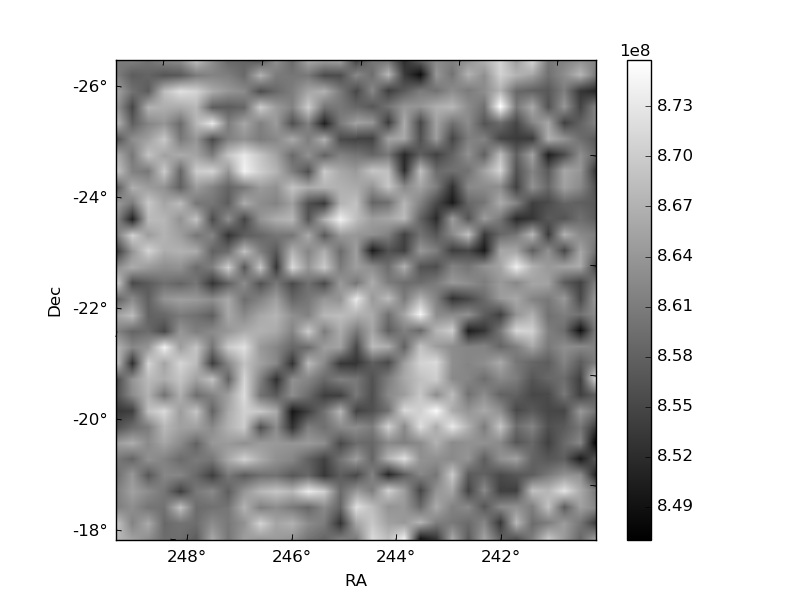
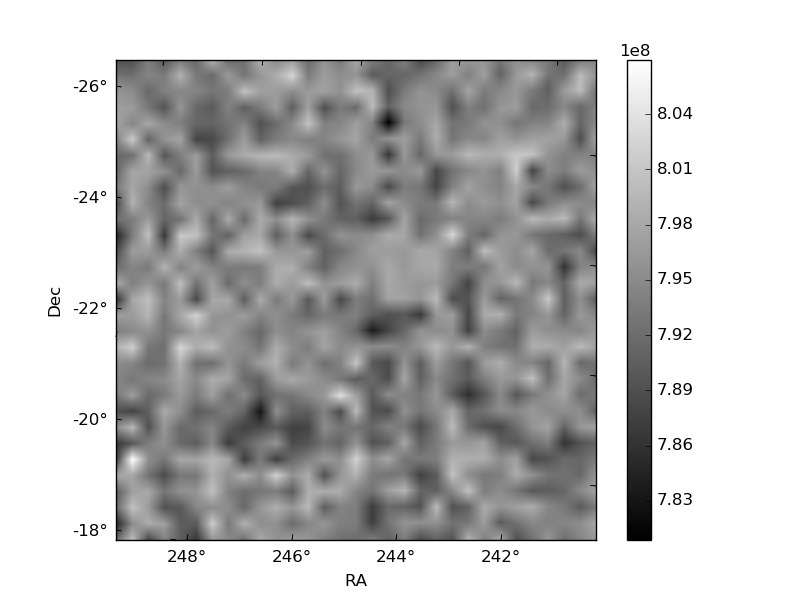
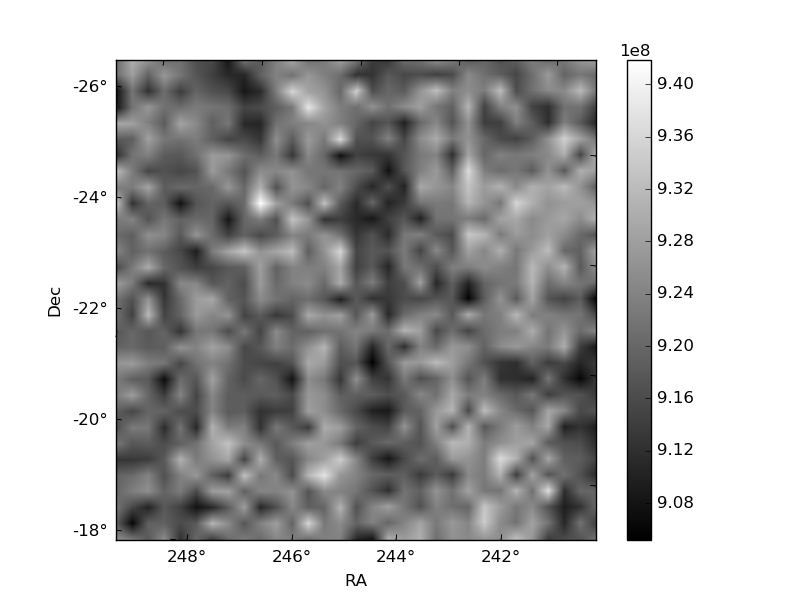
Histogram calculated using DETX and DETY for each event in the final _common_clean file
| Quadrant A | 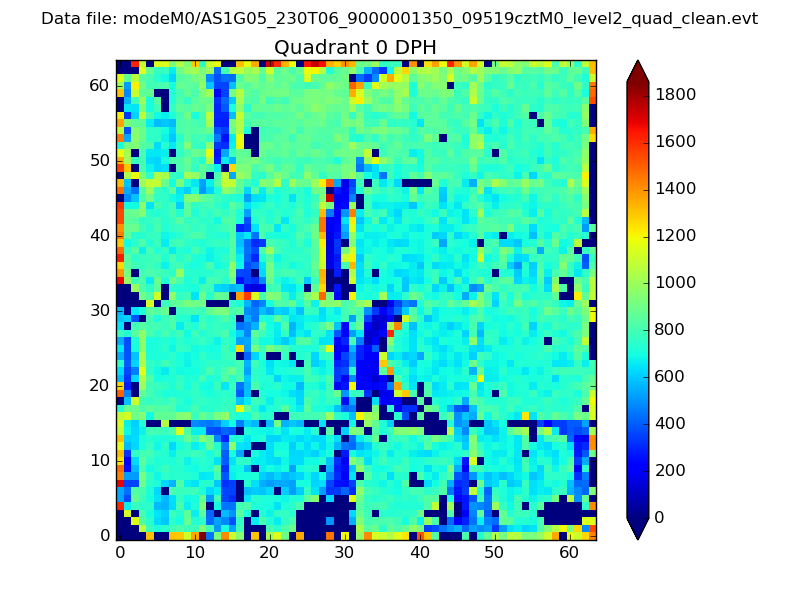 |
 |
Quadrant B |
|---|---|---|---|
| Quadrant D |  |
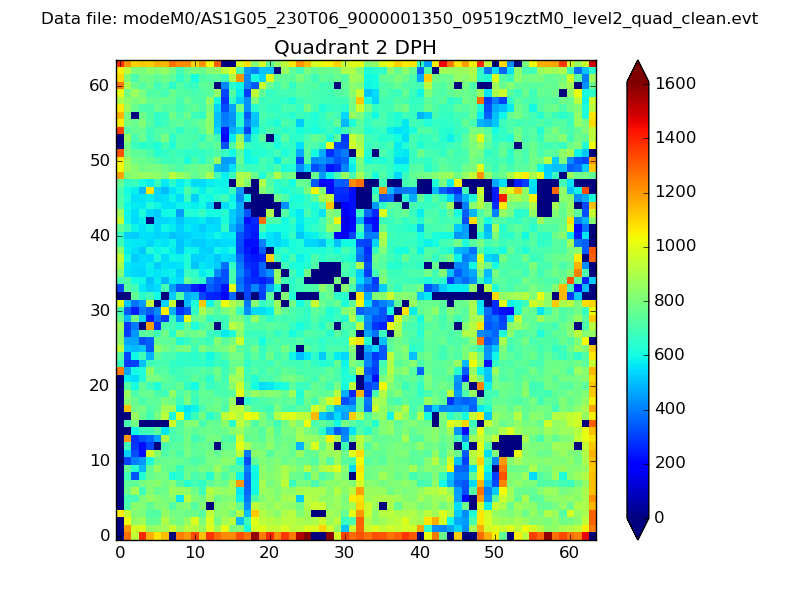 |
Quadrant C |
| Plot type | Count rate plots | Images |
|---|---|---|
| Comparison with Poisson distribution Blue bars denote a histogram of data divided into 1 sec bins. Red curve is a Poisson curve with rate = median count rate of data. |
 |
 |
| Quadrant-wise count rates Data is divided into 100 sec bins |
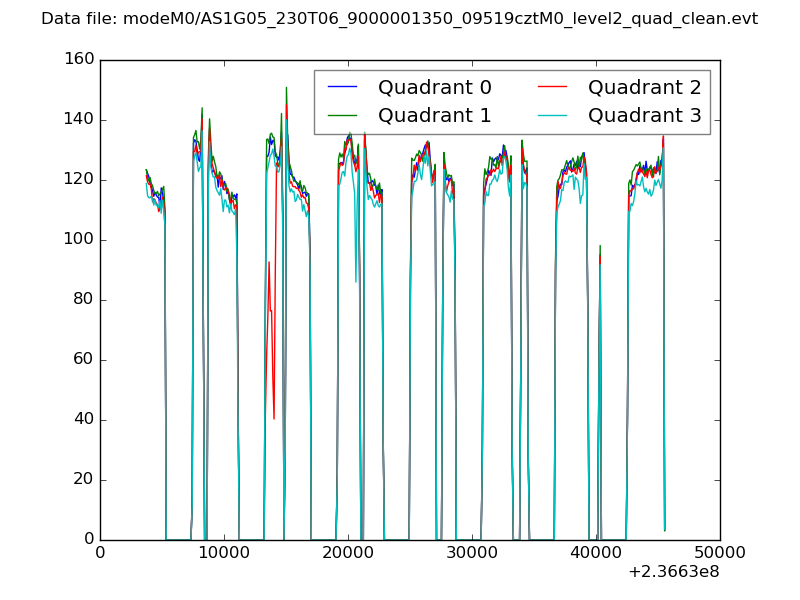 |
|
| Module-wise count rates for Quadrant A Data is divided into 100 sec bins |
 |
 |
| Module-wise count rates for Quadrant B Data is divided into 100 sec bins |
 |
 |
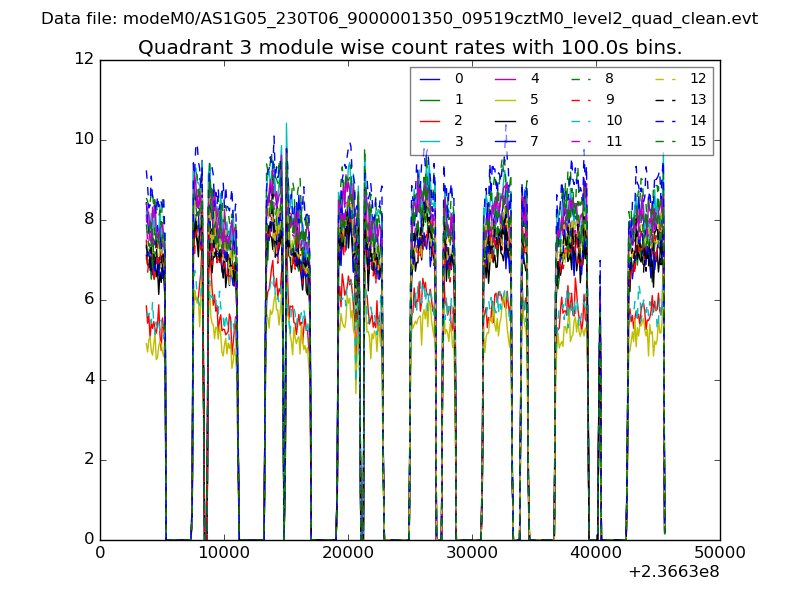
| Module-wise count rates for Quadrant C Data is divided into 100 sec bins |
 |
 |
| Module-wise count rates for Quadrant D Data is divided into 100 sec bins |
 |
 |
| Parameter | Plot |
|---|---|
| CZT HV Monitor |  |
| D_VDD | 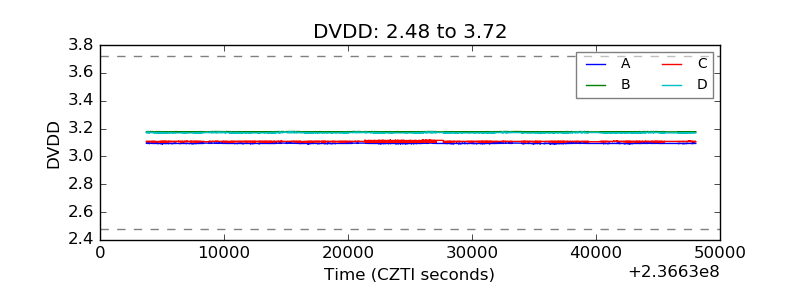 |
| Temperature 1 | 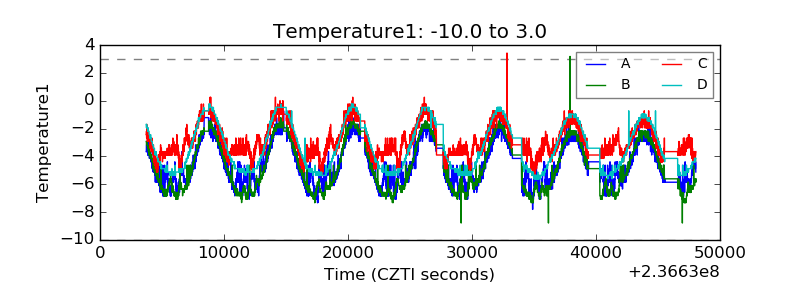 |
| Veto HV Monitor | 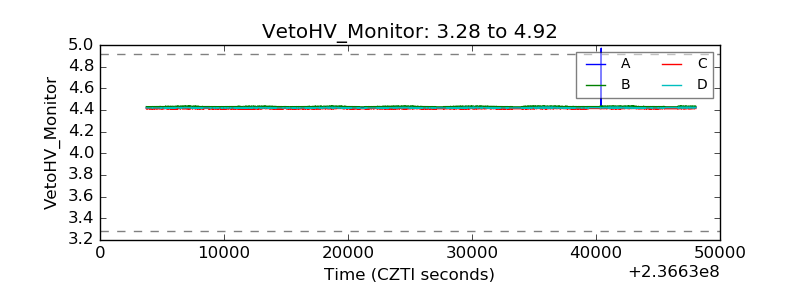 |
| Veto LLD | 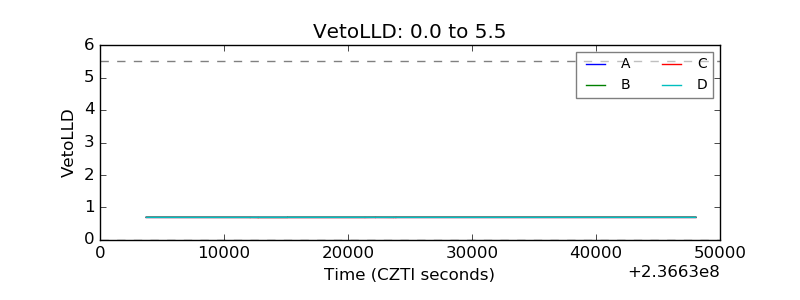 |
| Alpha Counter | 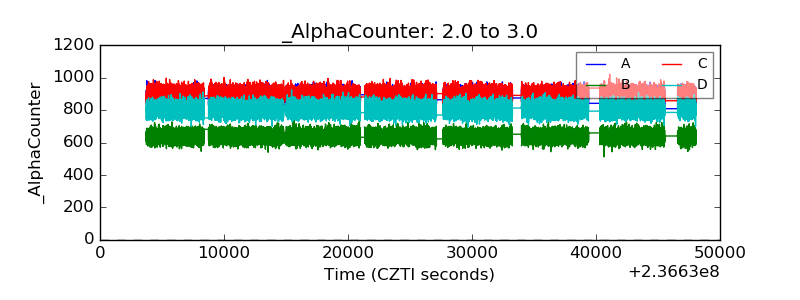 |
| _CPM_Rate | 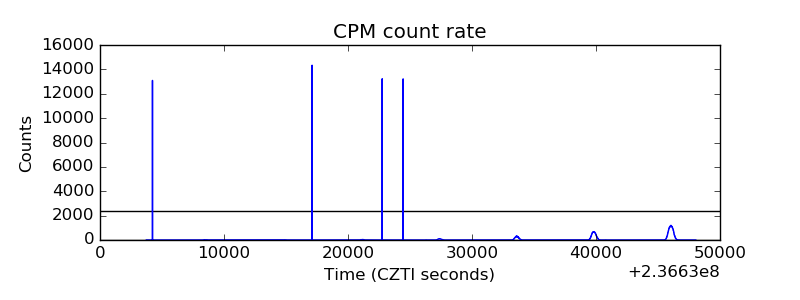 |
| CZT Counter | 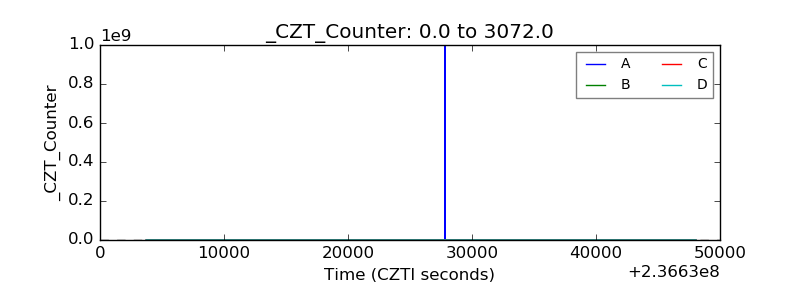 |
| +2.5 Volts monitor |  |
| +5 Volts monitor |  |
| _ROLL_ROT | 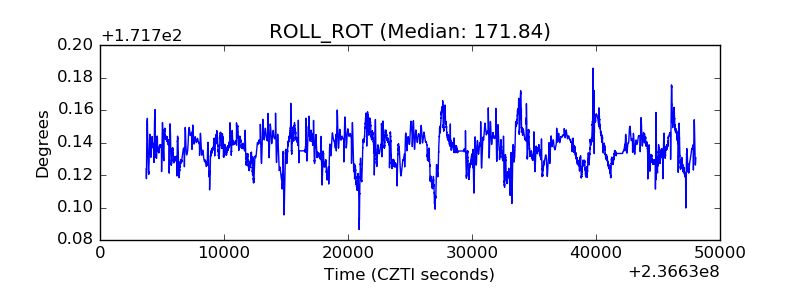 |
| _Roll_DEC | 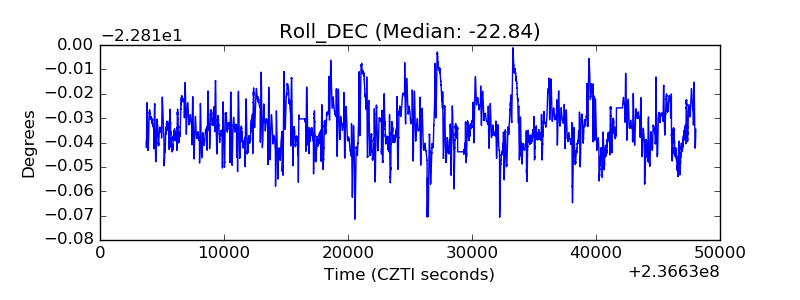 |
| _Roll_RA | 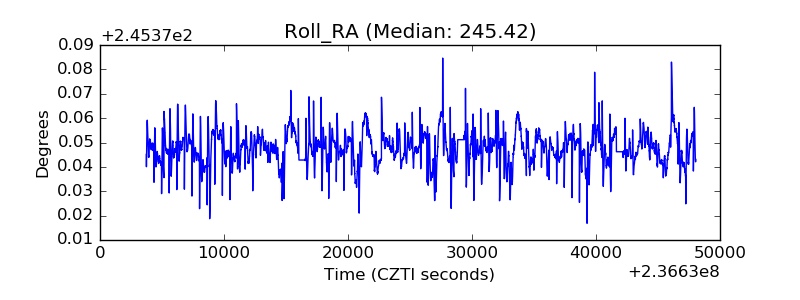 |
| Veto Counter |  |