| Param | Original file | Final file |
|---|---|---|
| Filename | modeM0/AS1G07_049T01_9000001352cztM0_level2.fits | modeM0/AS1G07_049T01_9000001352cztM0_level2_quad_clean.evt |
| Size (bytes) | 1,090,883,520 | 1,445,532,480 |
| Size | 1.0 GB | 1.3 GB |
| Events in quadrant A | 6,767,970 | 9,667,610 |
| Events in quadrant B | 6,499,746 | 9,516,501 |
| Events in quadrant C | 6,564,298 | 9,036,249 |
| Events in quadrant D | 5,295,980 | 7,657,021 |
| Mode M9 | |||
|---|---|---|---|
| Quadrant | BADHDUFLAG | Total packets | Discarded packets |
| A | 0 | 187 | 0 |
| B | 0 | 189 | 0 |
| C | 0 | 186 | 0 |
| D | 0 | 186 | 0 |
| Mode M0 | |||
|---|---|---|---|
| Quadrant | BADHDUFLAG | Total packets | Discarded packets |
| A | 0 | 256307 | 0 |
| B | 0 | 250333 | 0 |
| C | 0 | 260518 | 0 |
| D | 0 | 252011 | 0 |
| Mode SS | |||
|---|---|---|---|
| Quadrant | BADHDUFLAG | Total packets | Discarded packets |
| A | 0 | 2396 | 0 |
| B | 0 | 2381 | 0 |
| C | 0 | 2392 | 0 |
| D | 0 | 2394 | 0 |
| Quadrant | Total seconds | Saturated seconds | Saturation percentage |
|---|---|---|---|
| A | 117575 | 1505 | 1.280034% |
| B | 117654 | 1550 | 1.317422% |
| C | 117686 | 2444 | 2.076713% |
| D | 107914 | 2107 | 1.952481% |
Noise dominated data is calculated using 1-second bins in cleaned event files. If a bin has >2000 counts, and if more than 50% of those come from <1% of pixels, then it is considered to be noise-dominated and hence unusable.
| Quadrant | # 1 sec bins | Bins with >0 counts | Bins with >2000 counts | High rate bins dominated by noise | Noise dominated (total time) | Noise dominated (detector-on time) | Marked lightcurve |
|---|---|---|---|---|---|---|---|
| A | 139189 | 119470 | 0 | 0 | 0.00% | 0.00% | 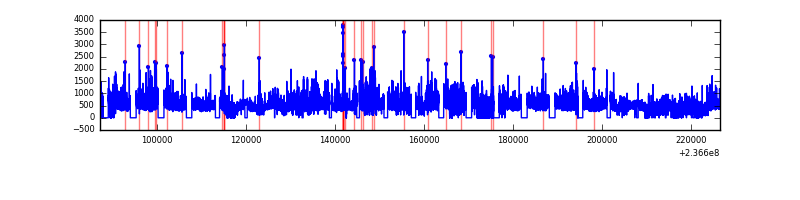 |
| B | 139189 | 119491 | 0 | 0 | 0.00% | 0.00% | 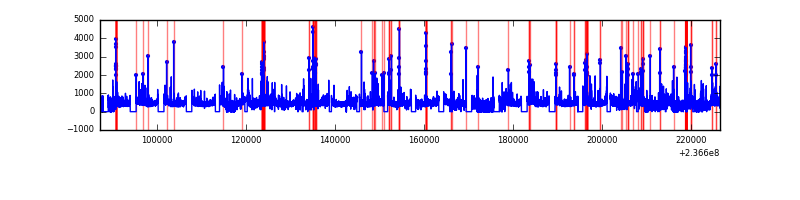 |
| C | 139189 | 119551 | 0 | 0 | 0.00% | 0.00% |  |
| D | 128686 | 109350 | 0 | 0 | 0.00% | 0.00% | 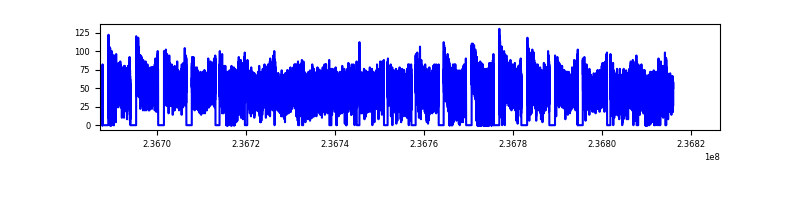 |
Top three noisy pixels from each quadrant. If the there are fewer than three noisy pixels in the level2.evt file, extra rows are filled as -1
| Pixel properties | Quadrant properties | ||||||
|---|---|---|---|---|---|---|---|
| Quadrant | DetID | PixID | Counts | Sigma | Mean | Median | Sigma |
| A | 0 | 29 | 6734 | 11.56 | 1763 | 1659 | 439.0 |
| A | 7 | 110 | 5578 | 8.93 | 1763 | 1659 | 439.0 |
| A | 0 | 30 | 5122 | 7.89 | 1763 | 1659 | 439.0 |
| B | 2 | 9 | 5479 | 11.71 | 1718 | 1649 | 327.0 |
| B | 14 | 254 | 4383 | 8.36 | 1718 | 1649 | 327.0 |
| B | 12 | 226 | 4325 | 8.18 | 1718 | 1649 | 327.0 |
| C | 12 | 241 | 4603 | 6.68 | 1734 | 1619 | 446.9 |
| C | 9 | 188 | 4383 | 6.18 | 1734 | 1619 | 446.9 |
| C | 2 | 191 | 4361 | 6.14 | 1734 | 1619 | 446.9 |
| D | 3 | 14 | 3881 | 6.17 | 1511 | 1379 | 405.2 |
| D | 6 | 231 | 3837 | 6.06 | 1511 | 1379 | 405.2 |
| D | 10 | 189 | 3734 | 5.81 | 1511 | 1379 | 405.2 |
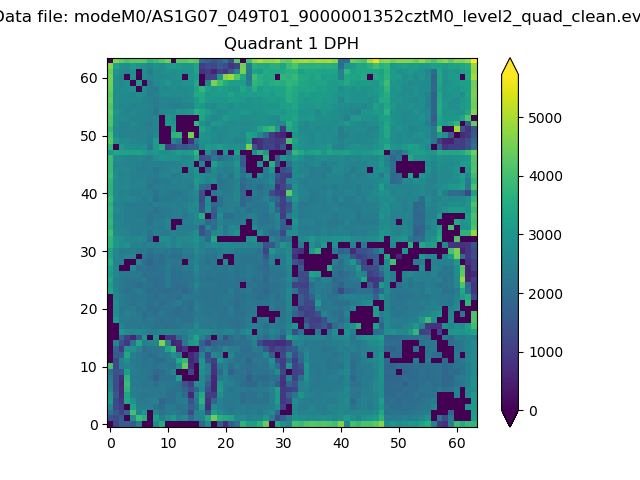
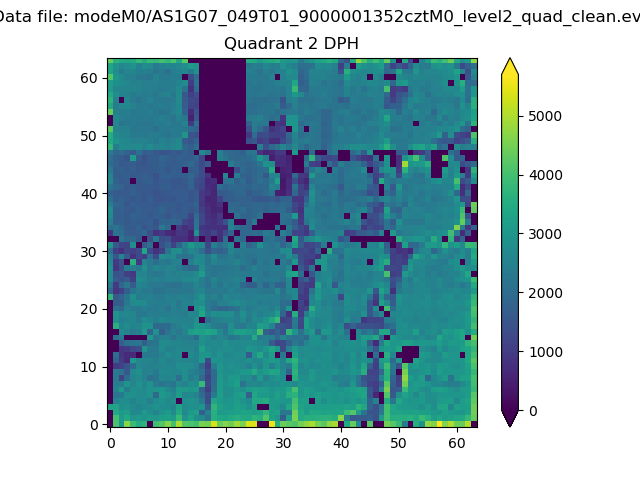
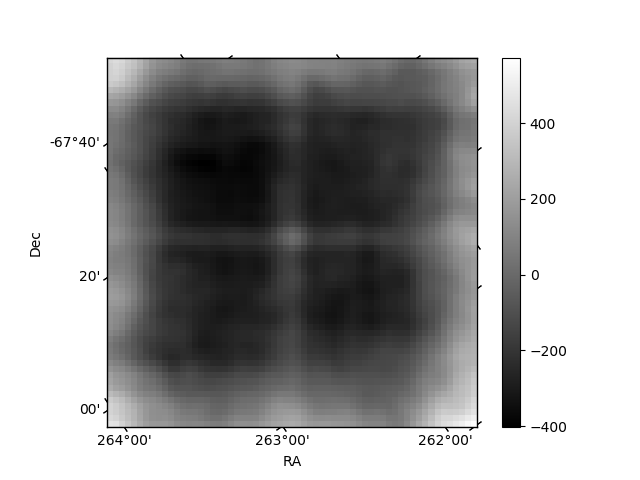
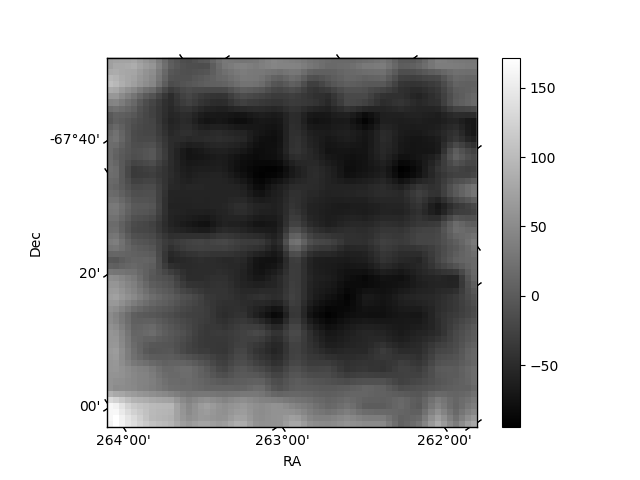
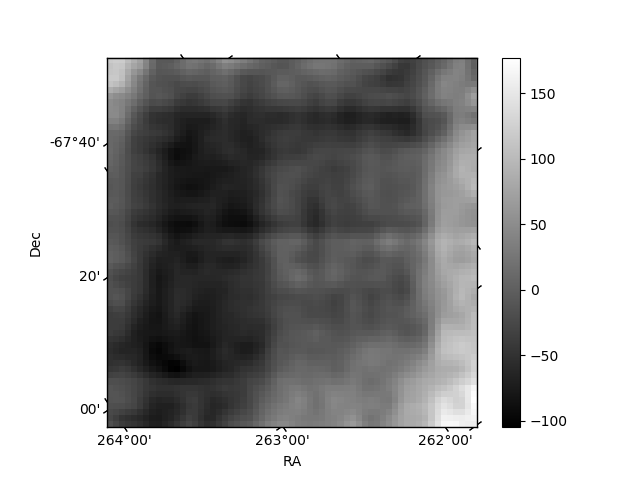
Histogram calculated using DETX and DETY for each event in the final _common_clean file
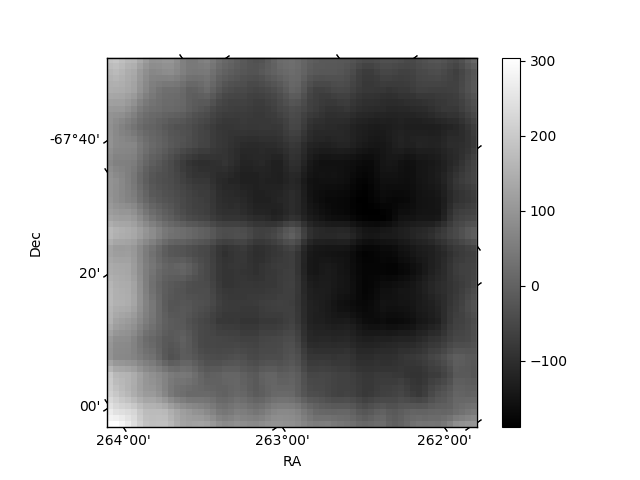
| Quadrant A | 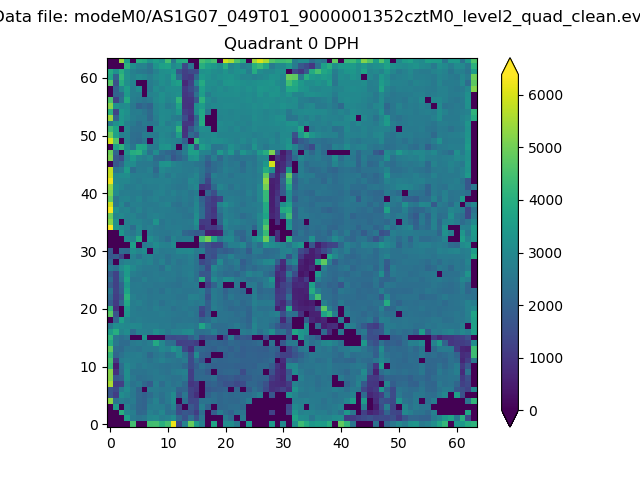 |
 |
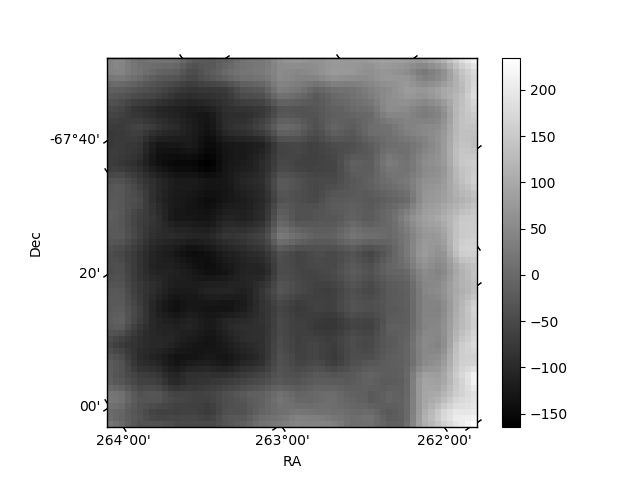
Quadrant B |
|---|---|---|---|
| Quadrant D | 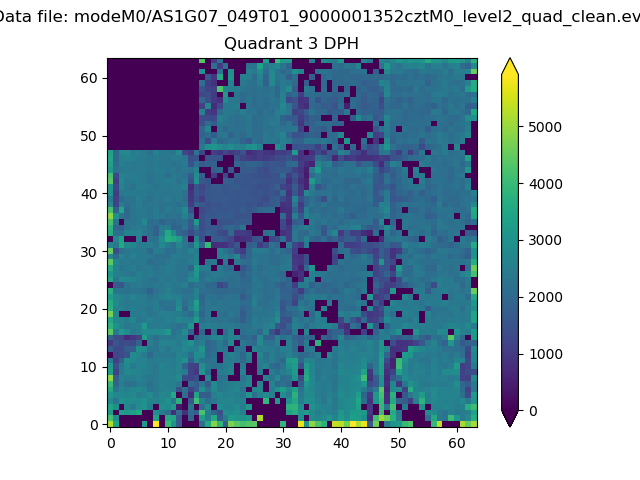 |
 |
Quadrant C |
| Plot type | Count rate plots | Images |
|---|---|---|
| Comparison with Poisson distribution Blue bars denote a histogram of data divided into 1 sec bins. Red curve is a Poisson curve with rate = median count rate of data. |
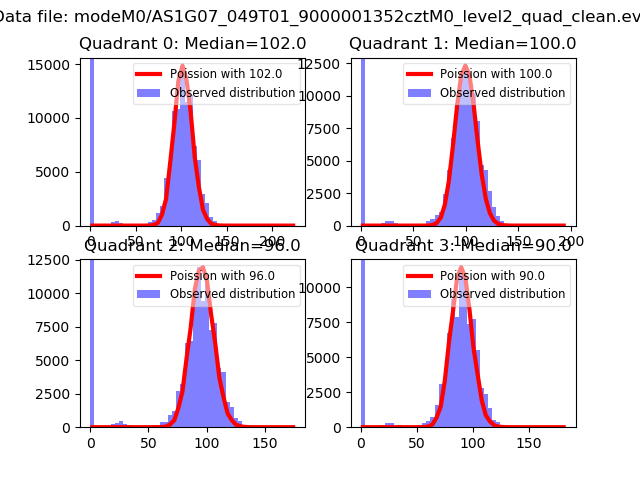 |
 |
| Quadrant-wise count rates Data is divided into 100 sec bins |
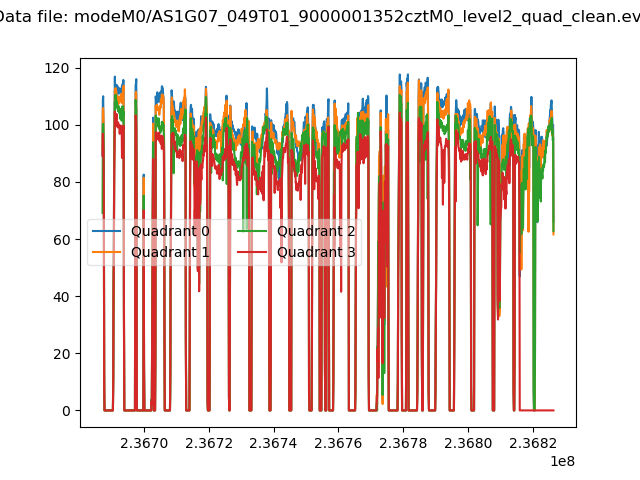 |
|
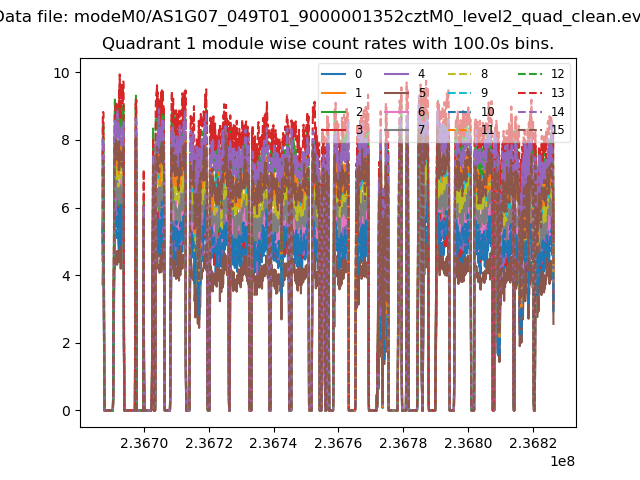
| Module-wise count rates for Quadrant A Data is divided into 100 sec bins |
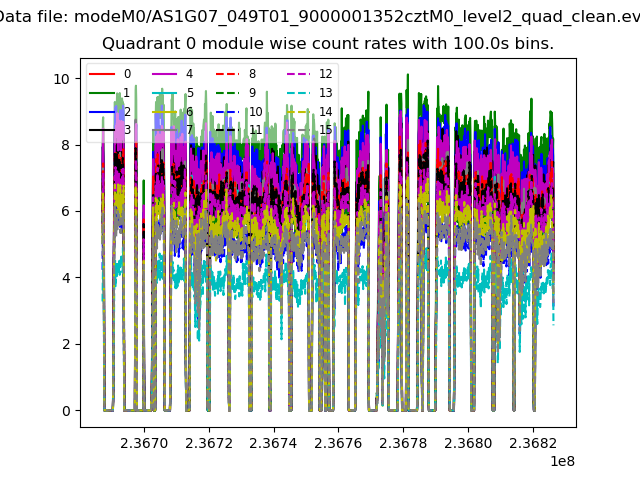 |
 |
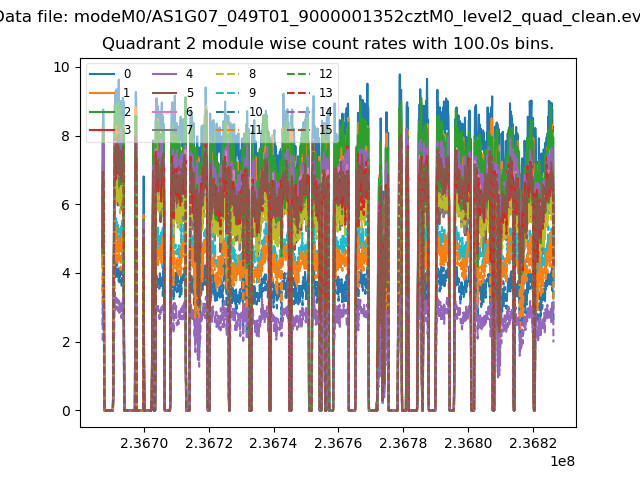
| Module-wise count rates for Quadrant B Data is divided into 100 sec bins |
 |
 |
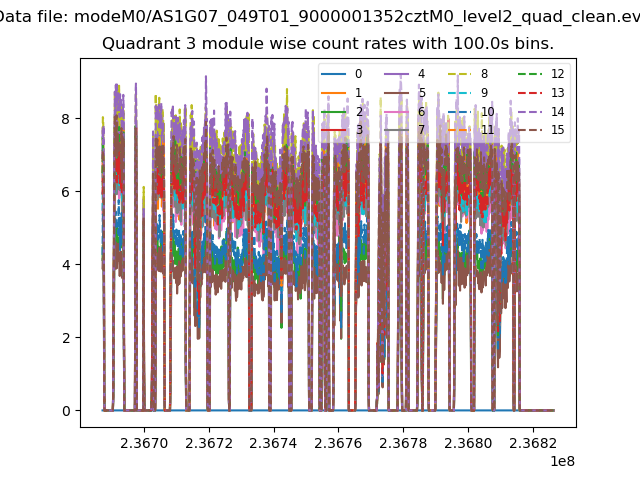
| Module-wise count rates for Quadrant C Data is divided into 100 sec bins |
 |
 |
| Module-wise count rates for Quadrant D Data is divided into 100 sec bins |
 |
 |
| Parameter | Plot |
|---|---|
| CZT HV Monitor | 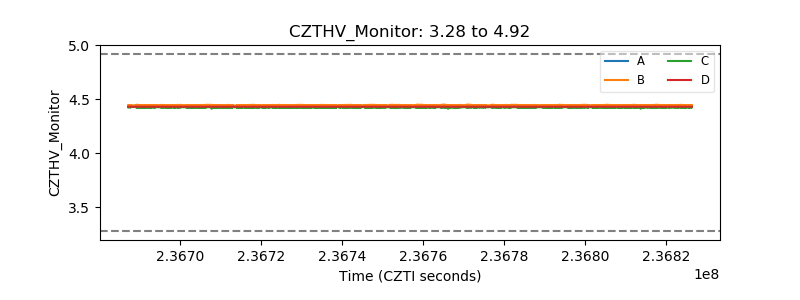 |
| D_VDD | 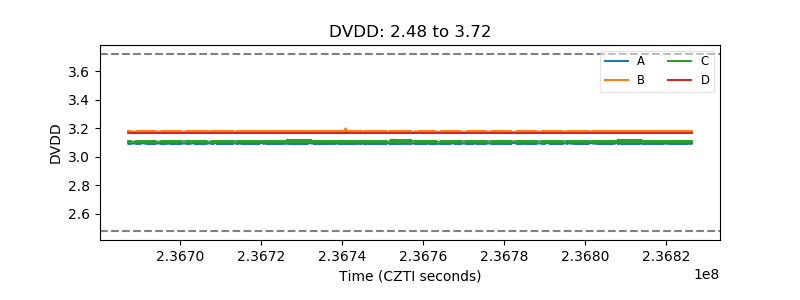 |
| Temperature 1 | 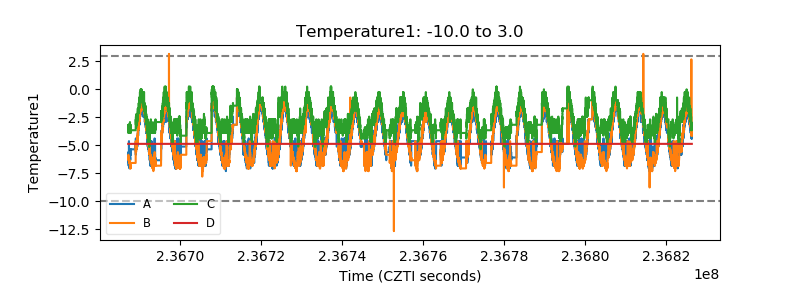 |
| Veto HV Monitor | 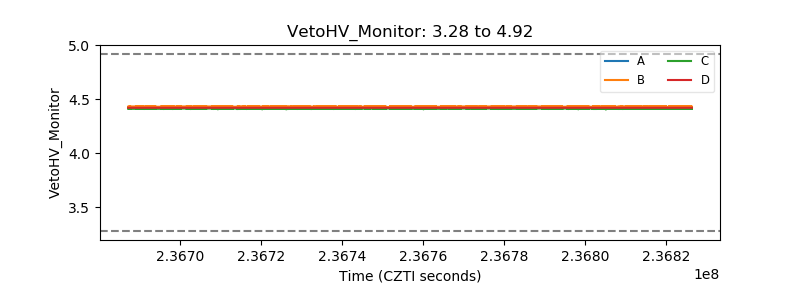 |
| Veto LLD | 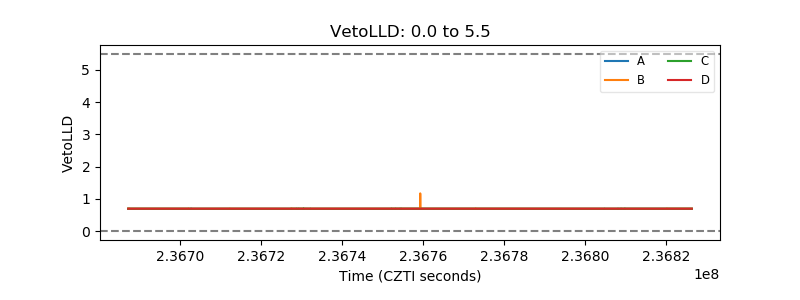 |
| Alpha Counter | 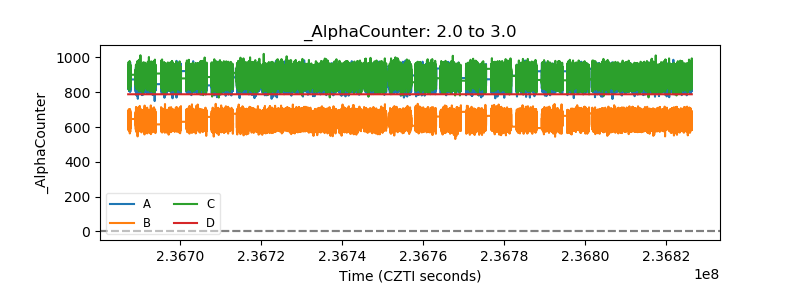 |
| _CPM_Rate | 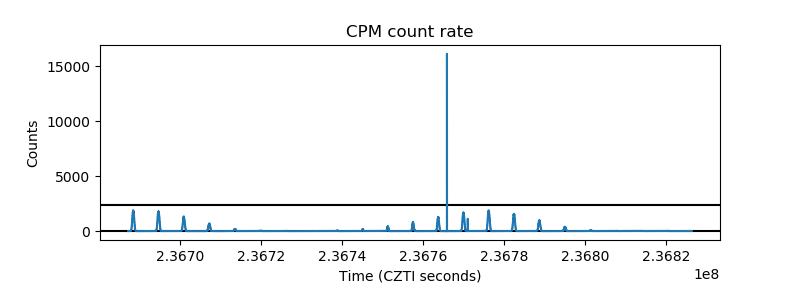 |
| CZT Counter | 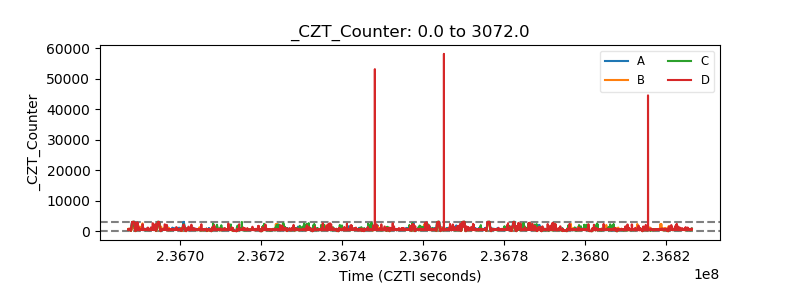 |
| +2.5 Volts monitor | 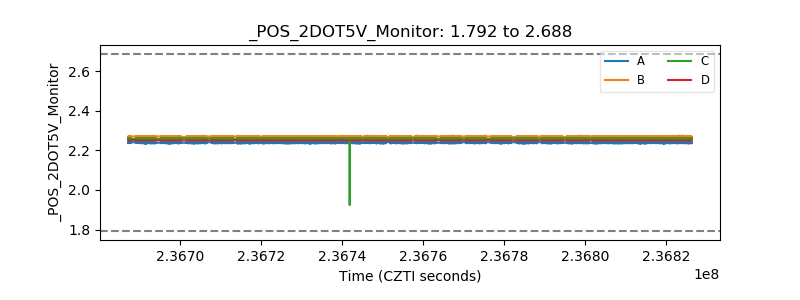 |
| +5 Volts monitor | 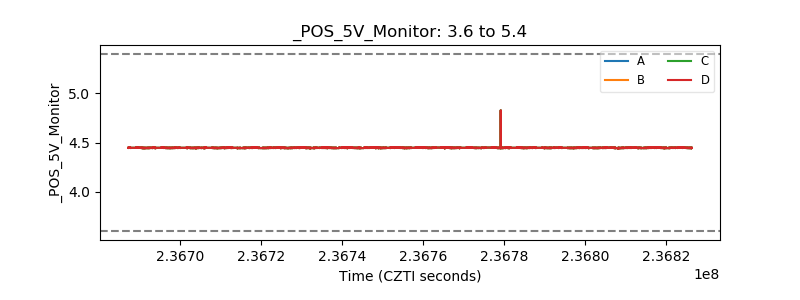 |
| _ROLL_ROT | 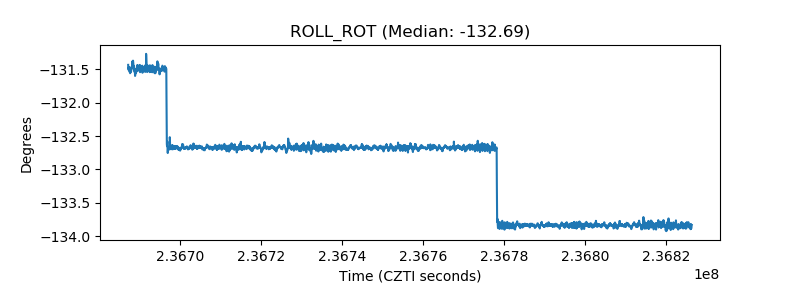 |
| _Roll_DEC | 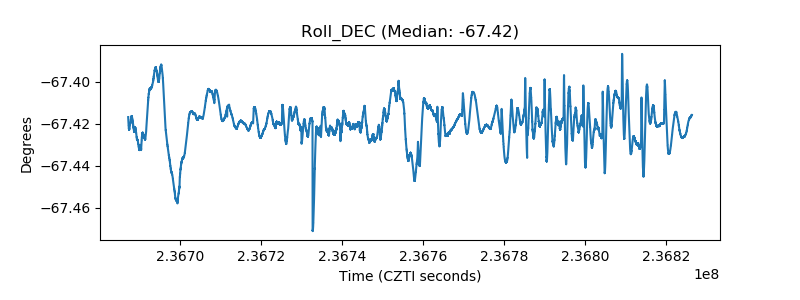 |
| _Roll_RA | 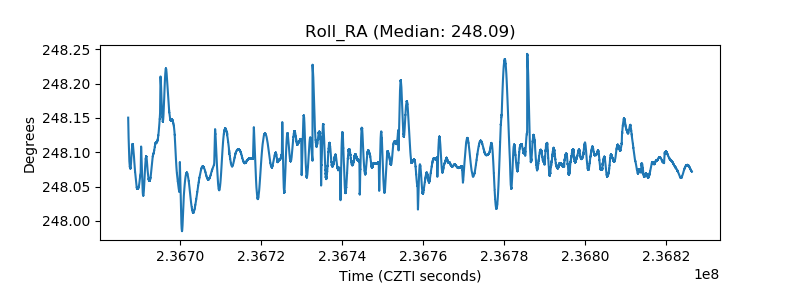 |
| Veto Counter | 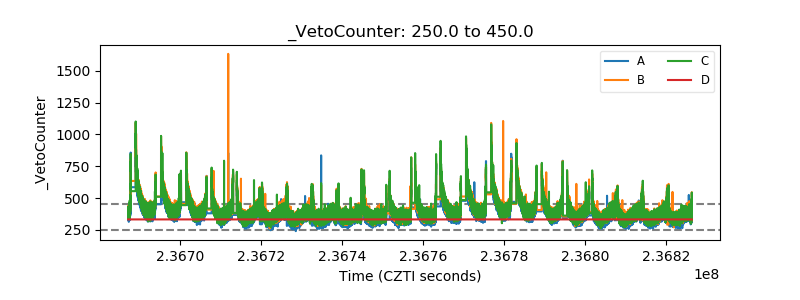 |