| Param | Original file | Final file |
|---|---|---|
| Filename | modeM0/AS1G07_049T01_9000001352_09522cztM0_level2.evt | modeM0/AS1G07_049T01_9000001352_09522cztM0_level2_quad_clean.evt |
| Size (bytes) | 140,509,440 | 39,588,480 |
| Size | 134.0 MB | 37.8 MB |
| Events in quadrant A | 1,024,105 | 268,354 |
| Events in quadrant B | 989,077 | 280,592 |
| Events in quadrant C | 949,099 | 272,115 |
| Events in quadrant D | 1,173,378 | 251,252 |
| Mode M9 | |||
|---|---|---|---|
| Quadrant | BADHDUFLAG | Total packets | Discarded packets |
| A | 0 | 13 | 1 |
| B | 0 | 13 | 0 |
| C | 0 | 13 | 2 |
| D | 0 | 13 | 1 |
| Mode M0 | |||
|---|---|---|---|
| Quadrant | BADHDUFLAG | Total packets | Discarded packets |
| A | 0 | 4801 | 570 |
| B | 0 | 4518 | 417 |
| C | 0 | 4335 | 396 |
| D | 0 | 5150 | 591 |
| Mode SS | |||
|---|---|---|---|
| Quadrant | BADHDUFLAG | Total packets | Discarded packets |
| A | 0 | 38 | 2 |
| B | 0 | 38 | 6 |
| C | 0 | 38 | 4 |
| D | 0 | 38 | 4 |
| Quadrant | Total seconds | Saturated seconds | Saturation percentage |
|---|---|---|---|
| A | 1699 | 82 | 4.826368% |
| B | 1743 | 85 | 4.876649% |
| C | 1739 | 75 | 4.312823% |
| D | 1720 | 161 | 9.360465% |
Noise dominated data is calculated using 1-second bins in cleaned event files. If a bin has >2000 counts, and if more than 50% of those come from <1% of pixels, then it is considered to be noise-dominated and hence unusable.
| Quadrant | # 1 sec bins | Bins with >0 counts | Bins with >2000 counts | High rate bins dominated by noise | Noise dominated (total time) | Noise dominated (detector-on time) | Marked lightcurve |
|---|---|---|---|---|---|---|---|
| A | 3145 | 1856 | 0 | 0 | 0.00% | 0.00% | 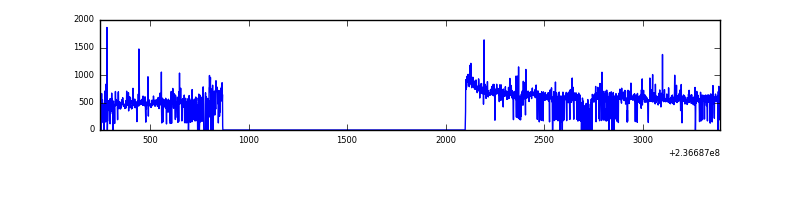 |
| B | 3145 | 1874 | 0 | 0 | 0.00% | 0.00% | 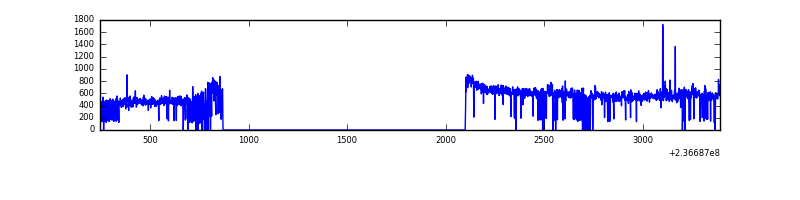 |
| C | 3145 | 1872 | 0 | 0 | 0.00% | 0.00% | 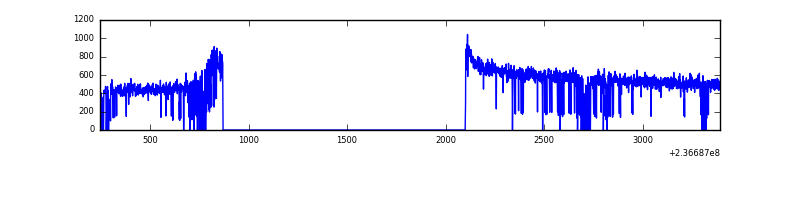 |
| D | 3145 | 1843 | 64 | 64 | 2.03% | 3.47% | 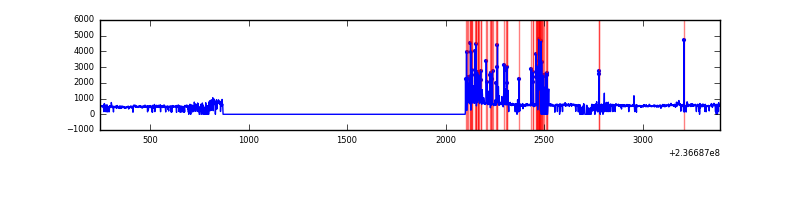 |
Top three noisy pixels from each quadrant. If the there are fewer than three noisy pixels in the level2.evt file, extra rows are filled as -1
| Pixel properties | Quadrant properties | ||||||
|---|---|---|---|---|---|---|---|
| Quadrant | DetID | PixID | Counts | Sigma | Mean | Median | Sigma |
| A | 1 | 162 | 43907 | 862.45 | 242 | 237 | 50.6 |
| A | 1 | 161 | 16510 | 321.38 | 242 | 237 | 50.6 |
| A | 1 | 178 | 16186 | 314.98 | 242 | 237 | 50.6 |
| B | 0 | 214 | 13916 | 286.88 | 247 | 241 | 47.7 |
| B | 0 | 219 | 5421 | 108.67 | 247 | 241 | 47.7 |
| B | 12 | 111 | 4770 | 95.01 | 247 | 241 | 47.7 |
| C | 13 | 61 | 1777 | 27.06 | 243 | 244 | 56.7 |
| C | 3 | 202 | 624 | 6.71 | 243 | 244 | 56.7 |
| C | 8 | 222 | 607 | 6.41 | 243 | 244 | 56.7 |
| D | 1 | 52 | 213306 | 3779.52 | 233 | 227 | 56.4 |
| D | 8 | 195 | 63717 | 1126.16 | 233 | 227 | 56.4 |
| D | 2 | 234 | 6183 | 105.65 | 233 | 227 | 56.4 |
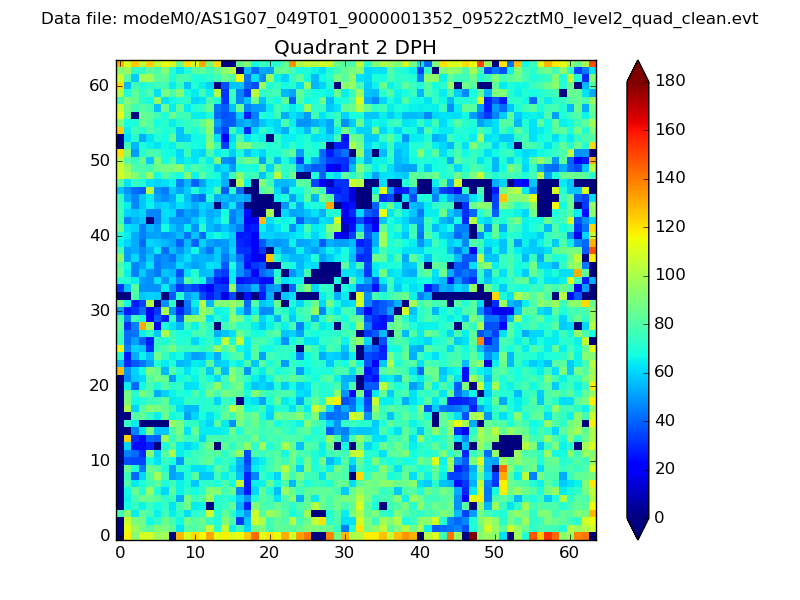
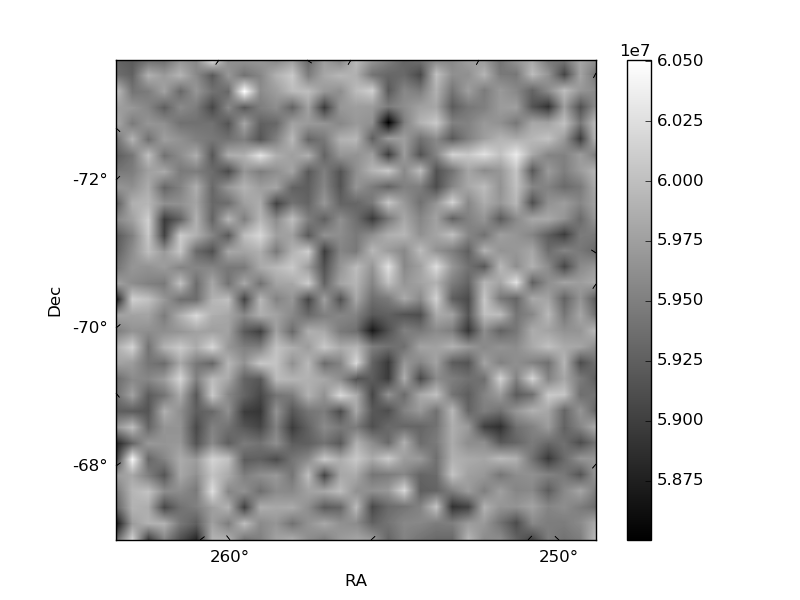
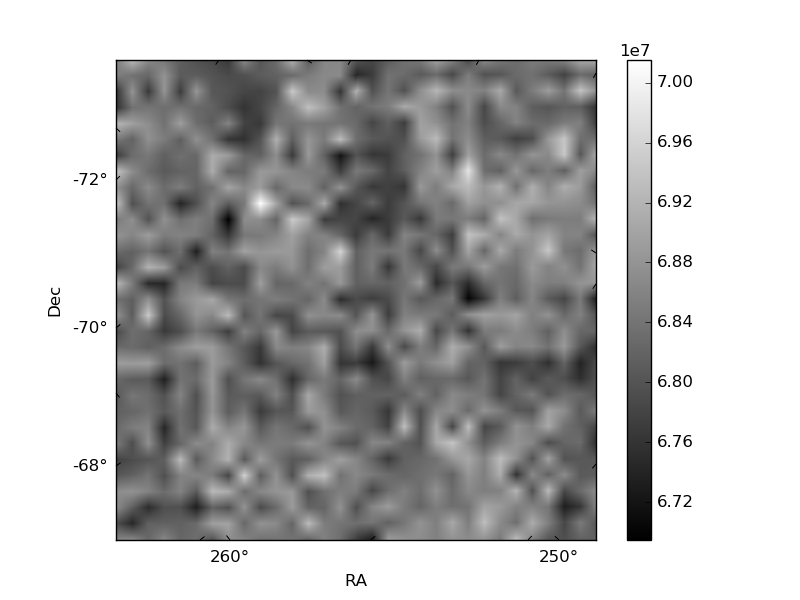
Histogram calculated using DETX and DETY for each event in the final _common_clean file
| Quadrant A | 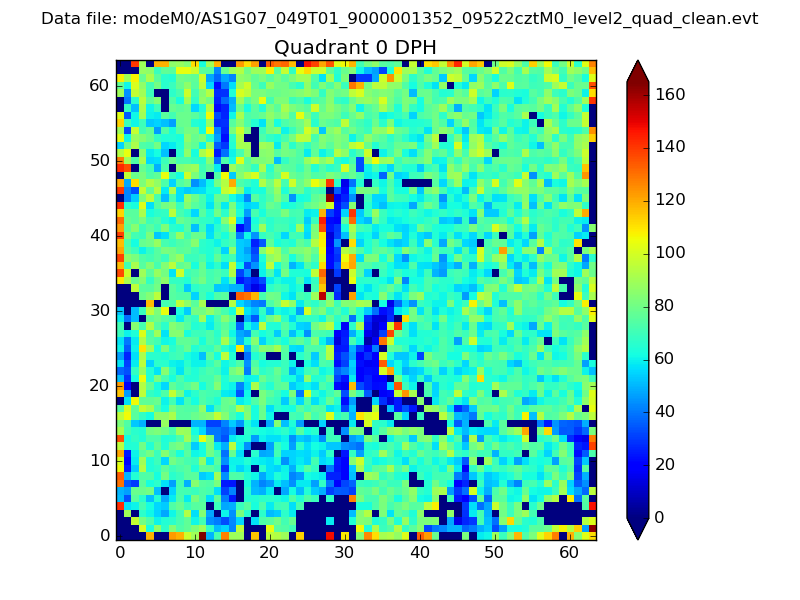 |
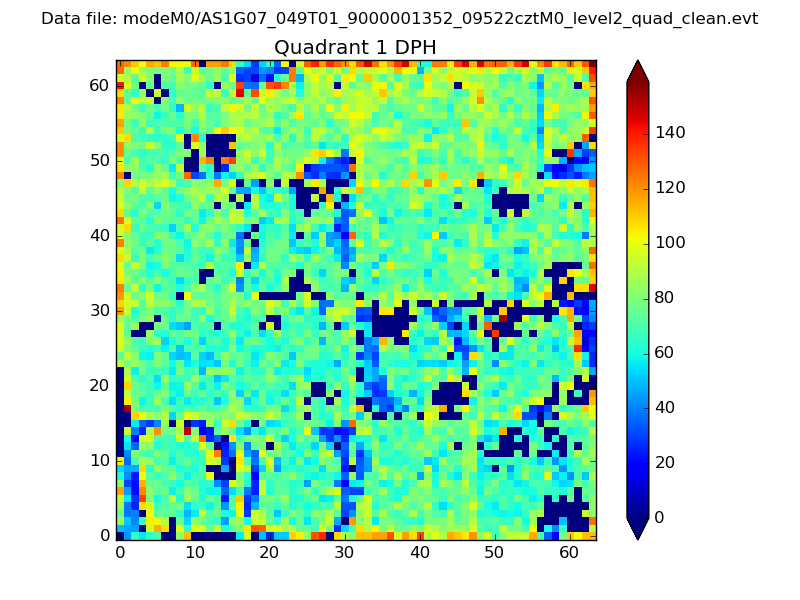 |
Quadrant B |
|---|---|---|---|
| Quadrant D | 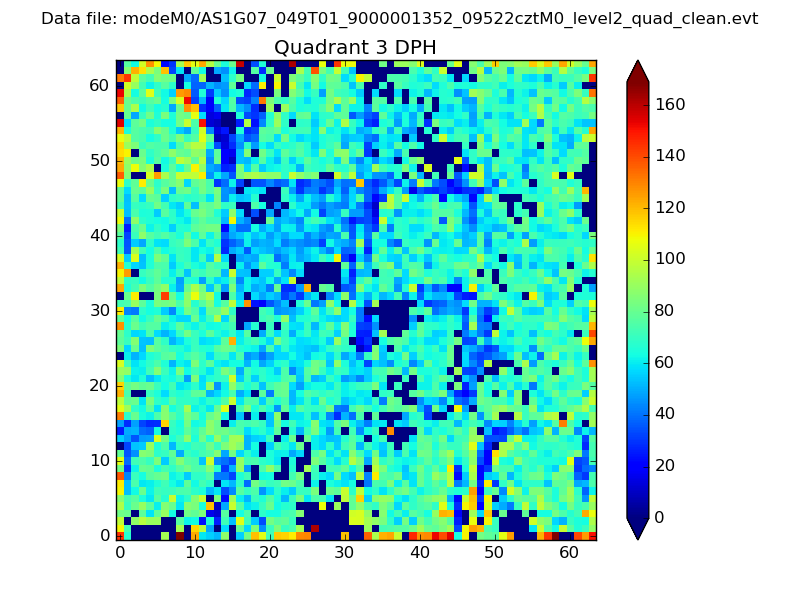 |
 |
Quadrant C |
| Plot type | Count rate plots | Images |
|---|---|---|
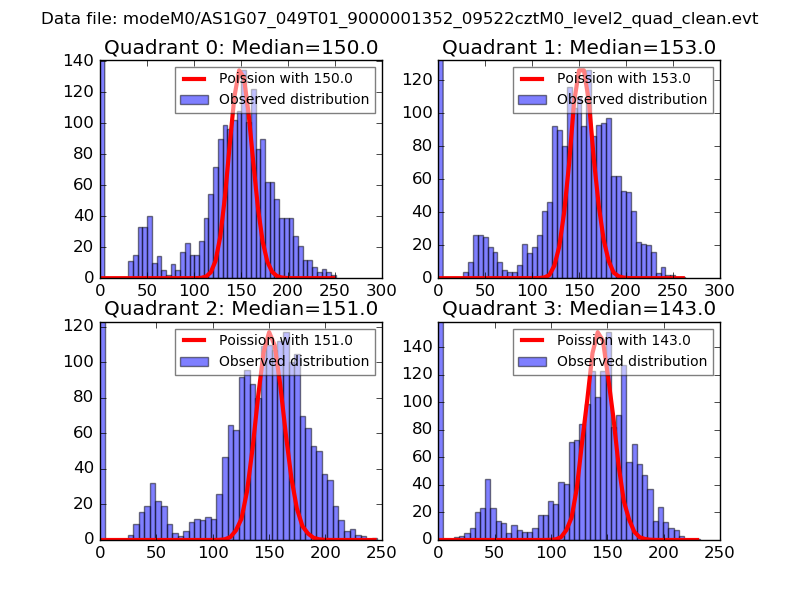
| Comparison with Poisson distribution Blue bars denote a histogram of data divided into 1 sec bins. Red curve is a Poisson curve with rate = median count rate of data. |
 |
 |
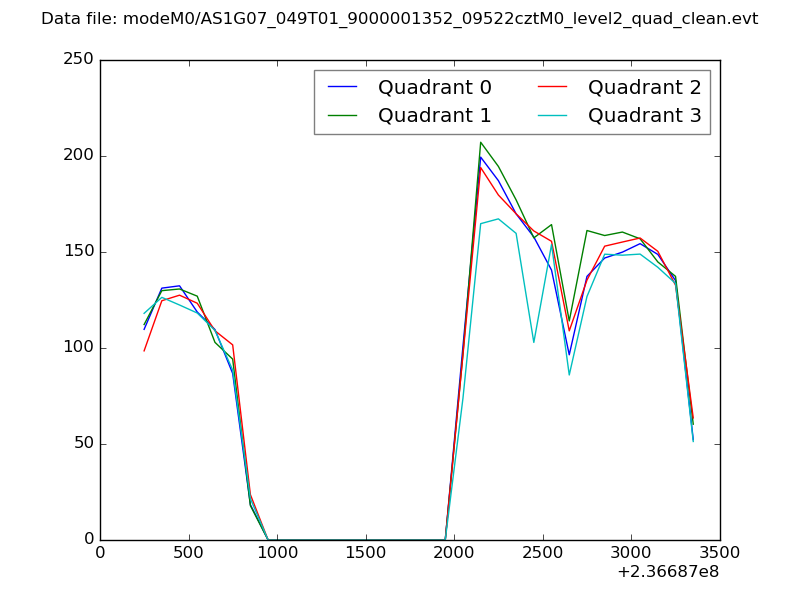
| Quadrant-wise count rates Data is divided into 100 sec bins |
 |
|
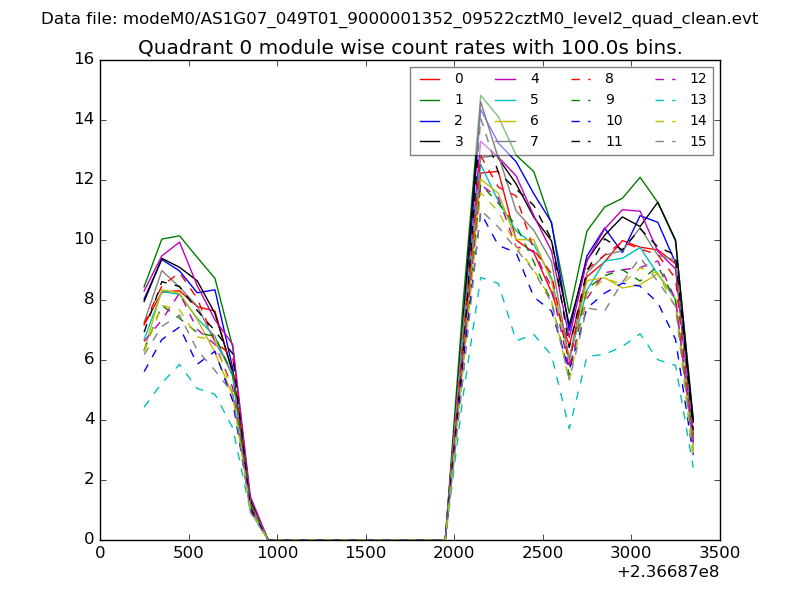
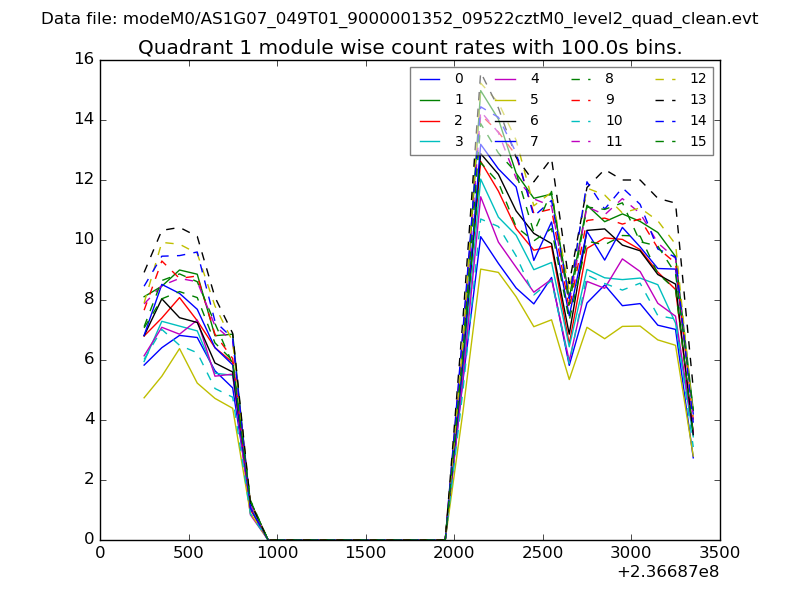
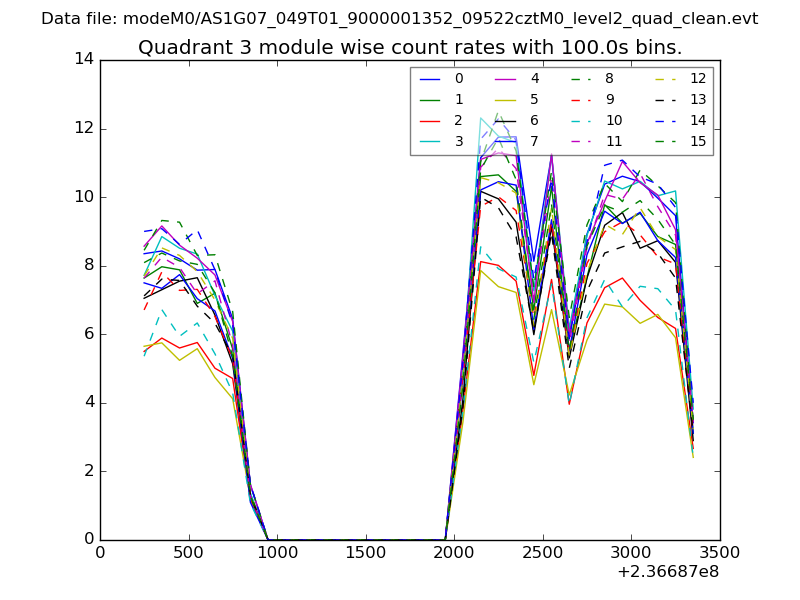
| Module-wise count rates for Quadrant A Data is divided into 100 sec bins |
 |
 |
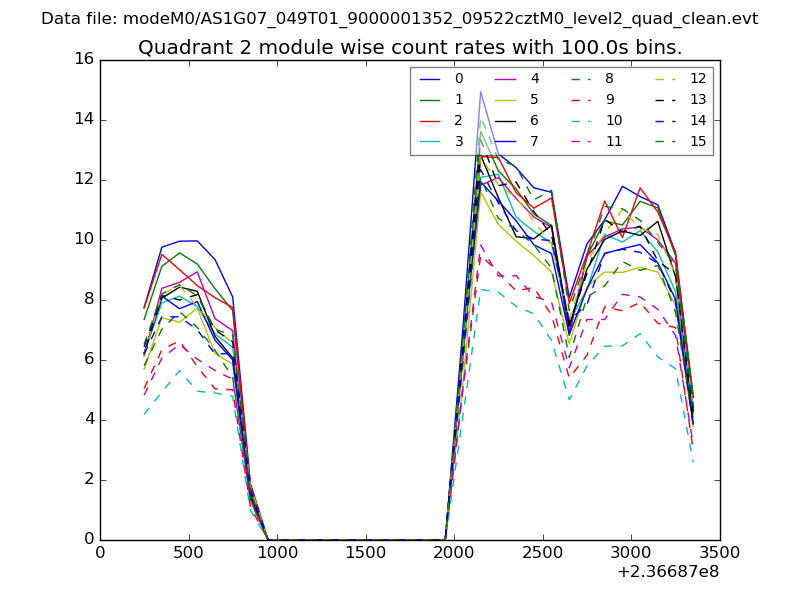
| Module-wise count rates for Quadrant B Data is divided into 100 sec bins |
 |
 |
| Module-wise count rates for Quadrant C Data is divided into 100 sec bins |
 |
 |
| Module-wise count rates for Quadrant D Data is divided into 100 sec bins |
 |
 |
| Parameter | Plot |
|---|---|
| CZT HV Monitor | 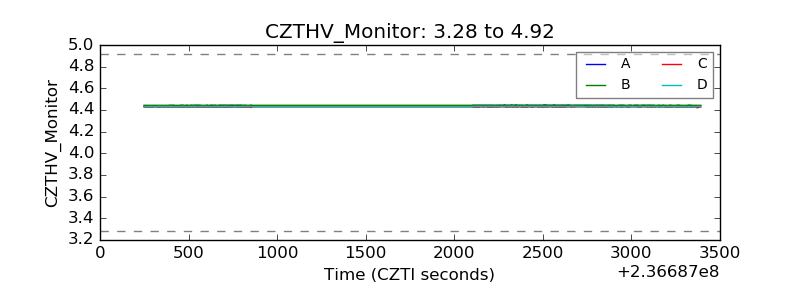 |
| D_VDD | 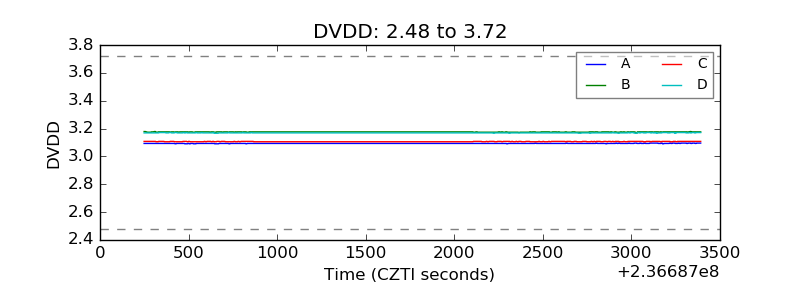 |
| Temperature 1 | 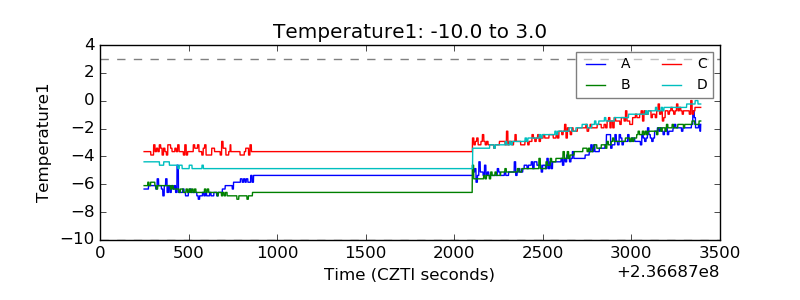 |
| Veto HV Monitor | 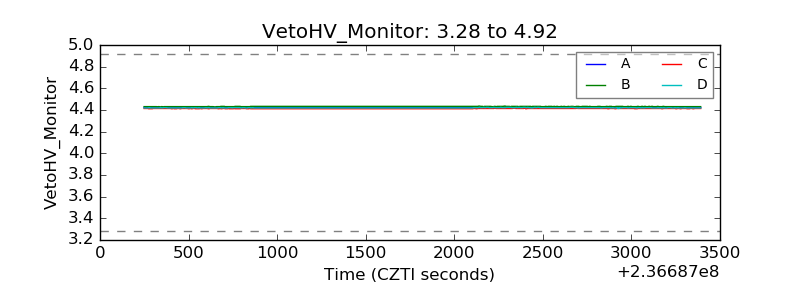 |
| Veto LLD | 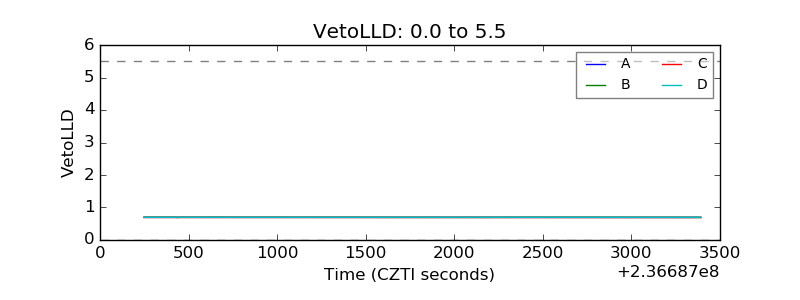 |
| Alpha Counter | 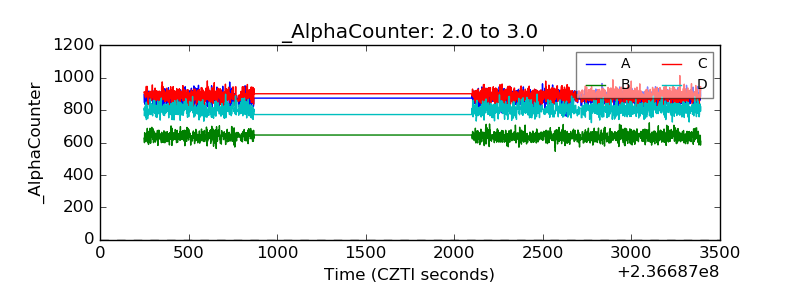 |
| _CPM_Rate | 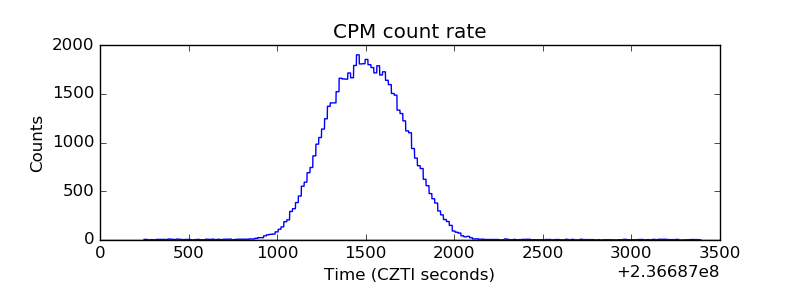 |
| CZT Counter | 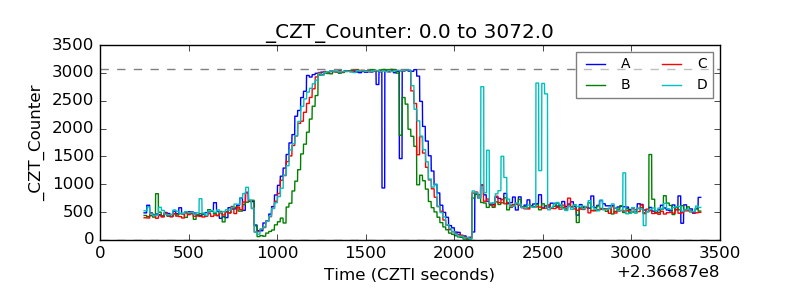 |
| +2.5 Volts monitor |  |
| +5 Volts monitor |  |
| _ROLL_ROT | 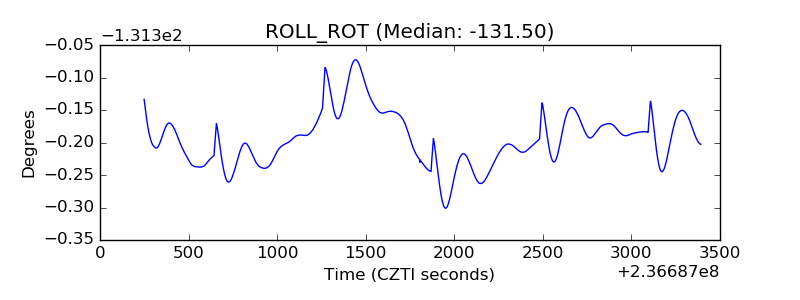 |
| _Roll_DEC | 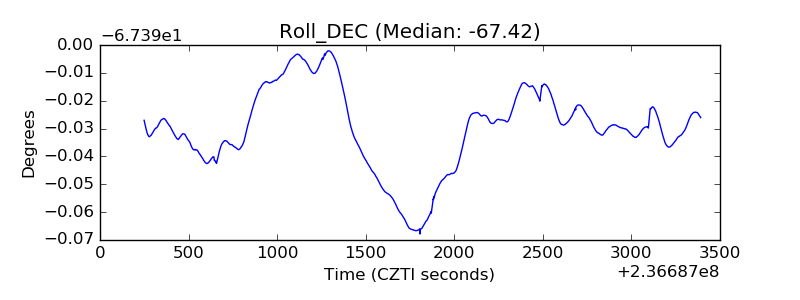 |
| _Roll_RA | 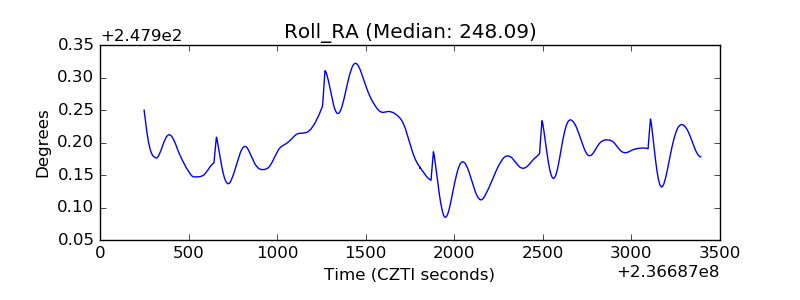 |
| Veto Counter | 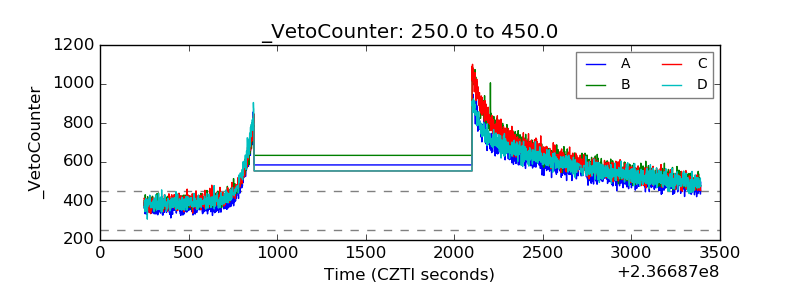 |