| Param | Original file | Final file |
|---|---|---|
| Filename | modeM0/AS1G07_049T01_9000001352_09525cztM0_level2.evt | modeM0/AS1G07_049T01_9000001352_09525cztM0_level2_quad_clean.evt |
| Size (bytes) | 452,119,680 | 129,974,400 |
| Size | 431.2 MB | 124.0 MB |
| Events in quadrant A | 3,313,589 | 890,771 |
| Events in quadrant B | 3,205,879 | 888,205 |
| Events in quadrant C | 3,239,486 | 859,933 |
| Events in quadrant D | 3,495,349 | 848,173 |
| Mode M9 | |||
|---|---|---|---|
| Quadrant | BADHDUFLAG | Total packets | Discarded packets |
| A | 0 | 12 | 0 |
| B | 0 | 12 | 0 |
| C | 0 | 12 | 0 |
| D | 0 | 12 | 0 |
| Mode M0 | |||
|---|---|---|---|
| Quadrant | BADHDUFLAG | Total packets | Discarded packets |
| A | 0 | 14046 | 3 |
| B | 0 | 13791 | 2 |
| C | 0 | 14115 | 2 |
| D | 0 | 14652 | 2 |
| Mode SS | |||
|---|---|---|---|
| Quadrant | BADHDUFLAG | Total packets | Discarded packets |
| A | 0 | 132 | 0 |
| B | 0 | 132 | 0 |
| C | 0 | 132 | 0 |
| D | 0 | 132 | 0 |
| Quadrant | Total seconds | Saturated seconds | Saturation percentage |
|---|---|---|---|
| A | 6442 | 79 | 1.226327% |
| B | 6442 | 73 | 1.133188% |
| C | 6442 | 136 | 2.111146% |
| D | 6442 | 63 | 0.977957% |
Noise dominated data is calculated using 1-second bins in cleaned event files. If a bin has >2000 counts, and if more than 50% of those come from <1% of pixels, then it is considered to be noise-dominated and hence unusable.
| Quadrant | # 1 sec bins | Bins with >0 counts | Bins with >2000 counts | High rate bins dominated by noise | Noise dominated (total time) | Noise dominated (detector-on time) | Marked lightcurve |
|---|---|---|---|---|---|---|---|
| A | 7677 | 6443 | 2 | 2 | 0.03% | 0.03% | 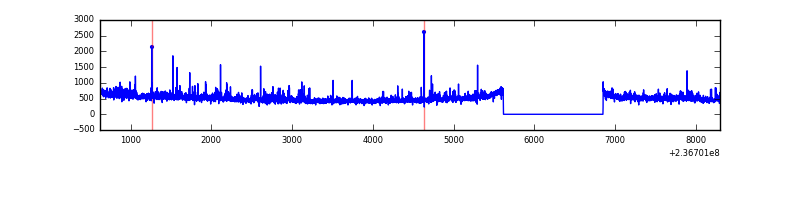 |
| B | 7677 | 6443 | 2 | 2 | 0.03% | 0.03% | 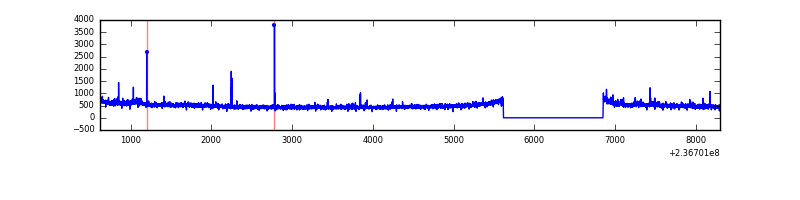 |
| C | 7677 | 6443 | 68 | 68 | 0.89% | 1.06% | 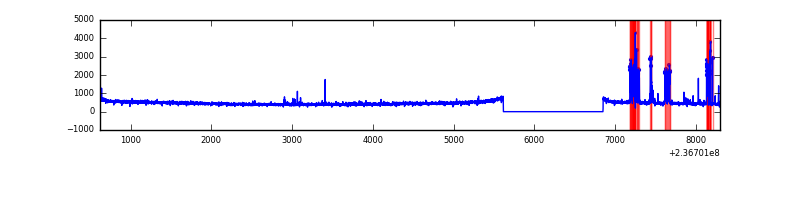 |
| D | 7677 | 6443 | 19 | 19 | 0.25% | 0.29% | 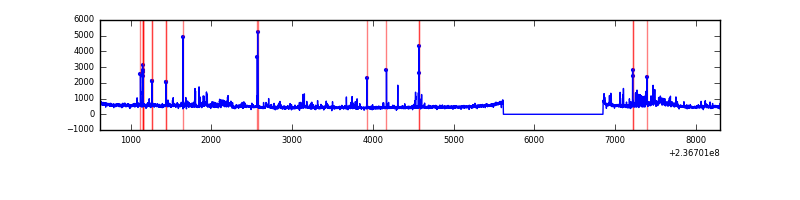 |
Top three noisy pixels from each quadrant. If the there are fewer than three noisy pixels in the level2.evt file, extra rows are filled as -1
| Pixel properties | Quadrant properties | ||||||
|---|---|---|---|---|---|---|---|
| Quadrant | DetID | PixID | Counts | Sigma | Mean | Median | Sigma |
| A | 1 | 162 | 119482 | 742.94 | 793 | 778 | 159.8 |
| A | 1 | 178 | 42730 | 262.57 | 793 | 778 | 159.8 |
| A | 1 | 161 | 40643 | 249.5 | 793 | 778 | 159.8 |
| B | 0 | 214 | 41274 | 274.17 | 790 | 771 | 147.7 |
| B | 0 | 219 | 33075 | 218.67 | 790 | 771 | 147.7 |
| B | 4 | 80 | 22290 | 145.67 | 790 | 771 | 147.7 |
| C | 4 | 254 | 295504 | 1724.69 | 750 | 754 | 170.9 |
| C | 12 | 4 | 12232 | 67.16 | 750 | 754 | 170.9 |
| C | 13 | 61 | 5580 | 28.24 | 750 | 754 | 170.9 |
| D | 8 | 195 | 205733 | 1038.32 | 750 | 734 | 197.4 |
| D | 2 | 16 | 114242 | 574.92 | 750 | 734 | 197.4 |
| D | 12 | 233 | 77162 | 387.11 | 750 | 734 | 197.4 |
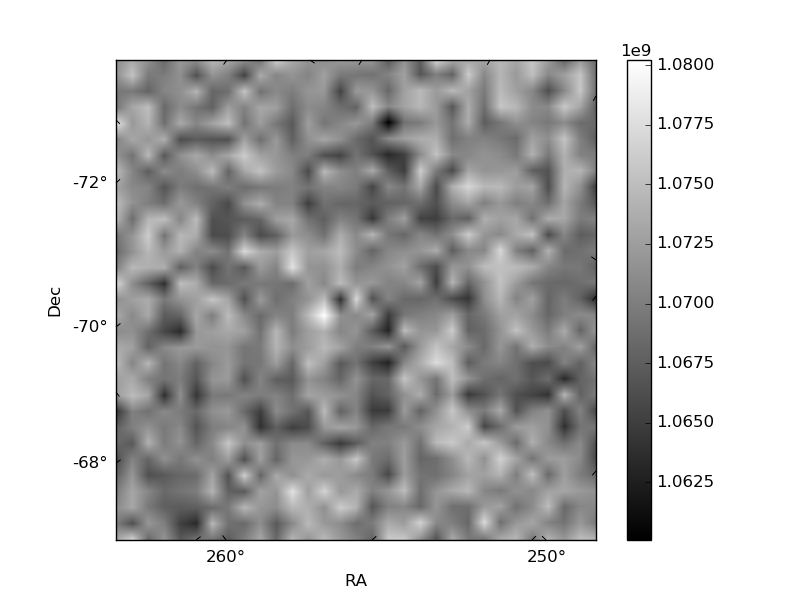
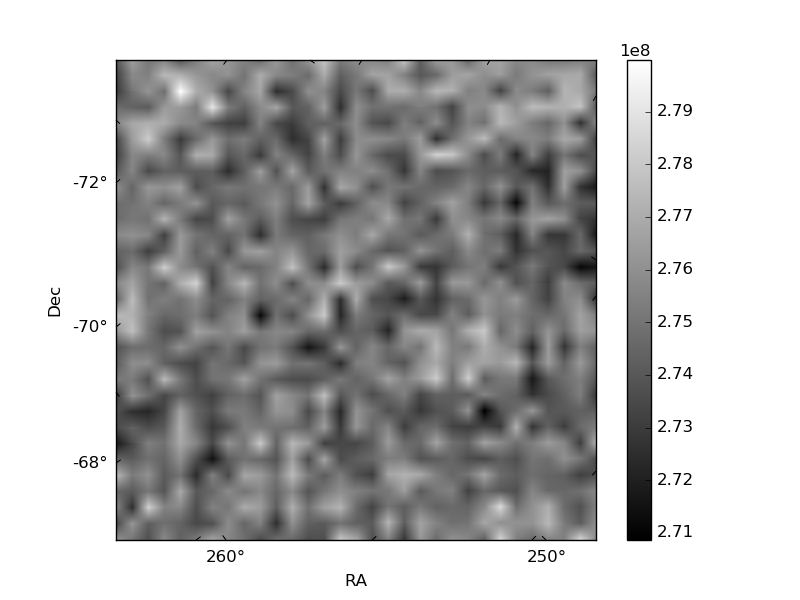
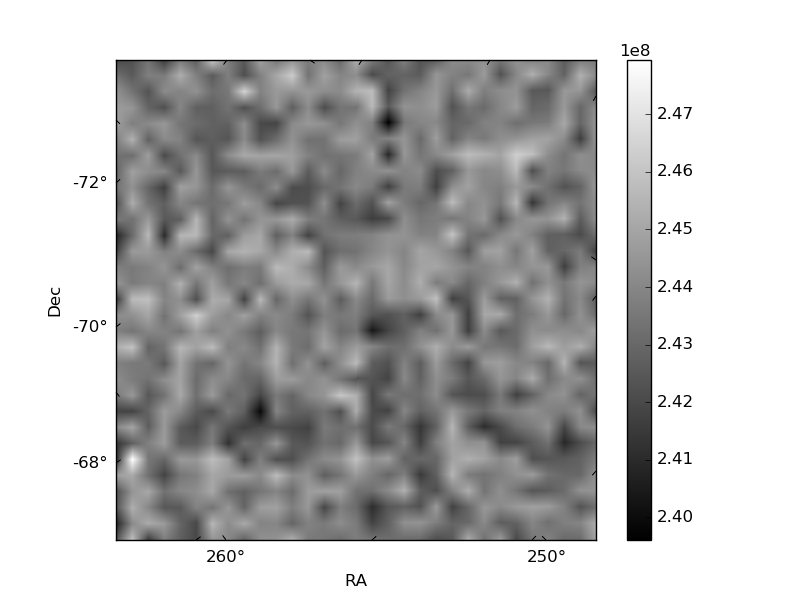
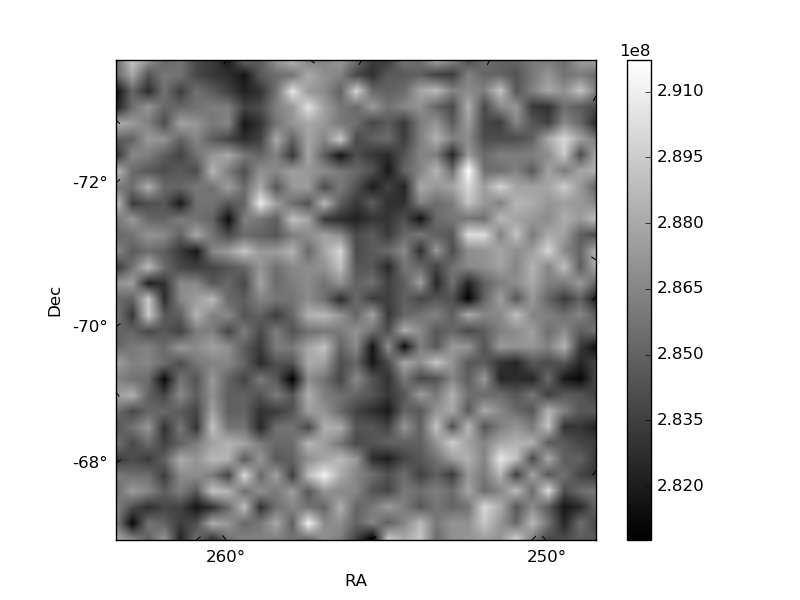
Histogram calculated using DETX and DETY for each event in the final _common_clean file
| Quadrant A | 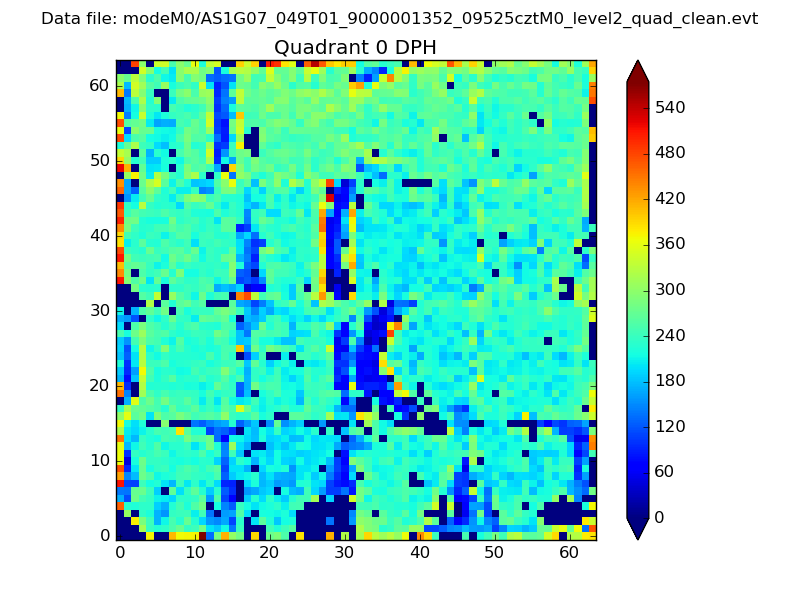 |
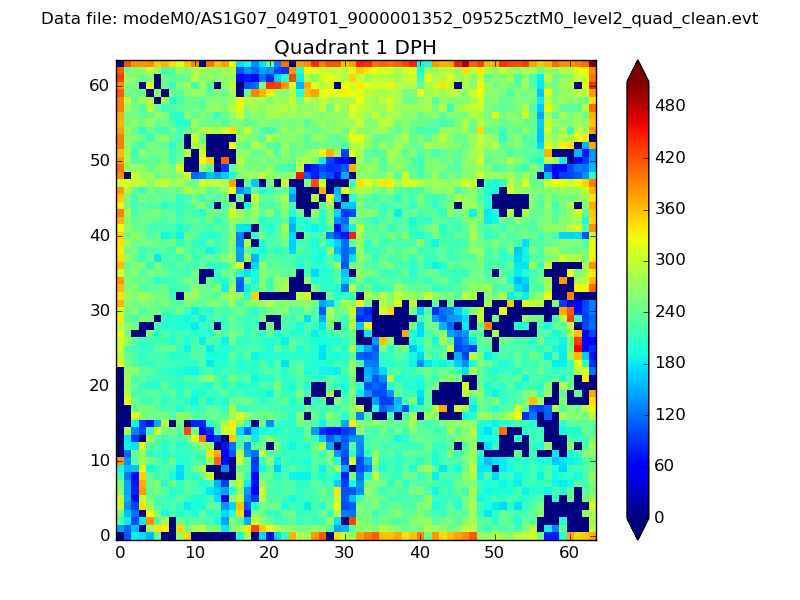 |
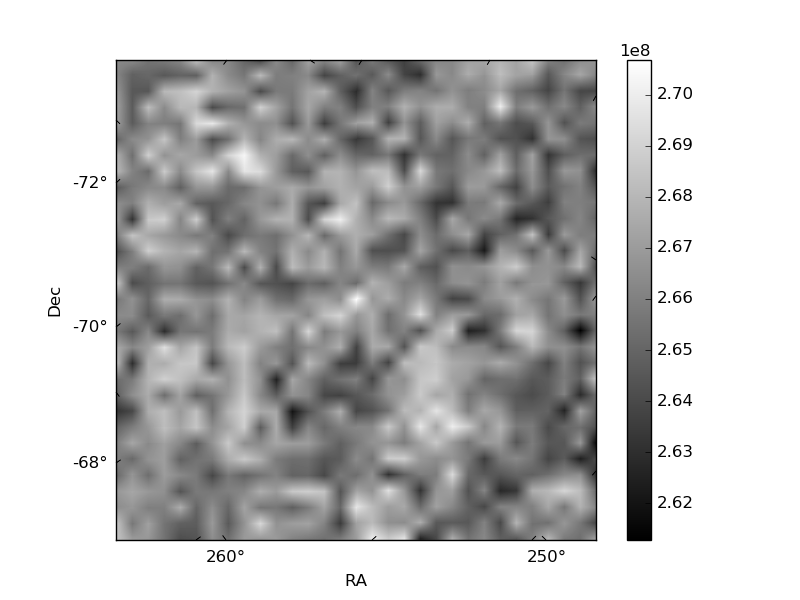
Quadrant B |
|---|---|---|---|
| Quadrant D | 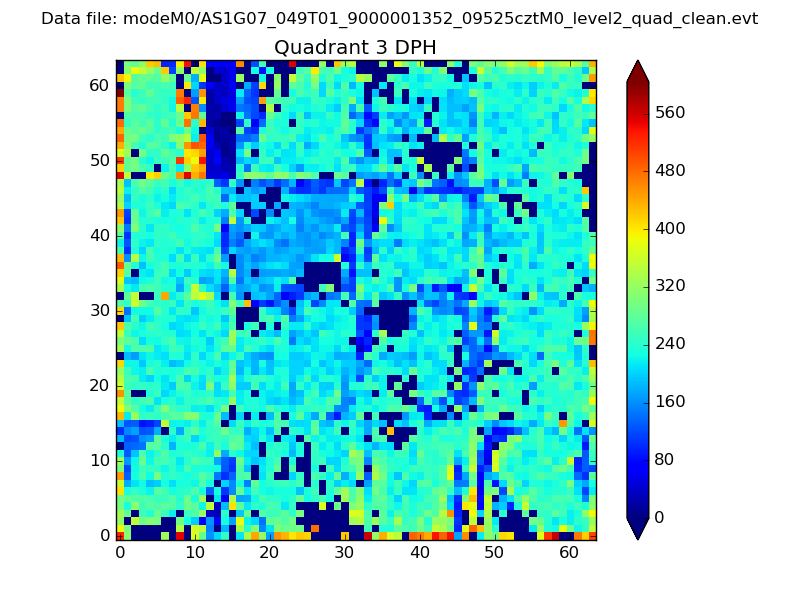 |
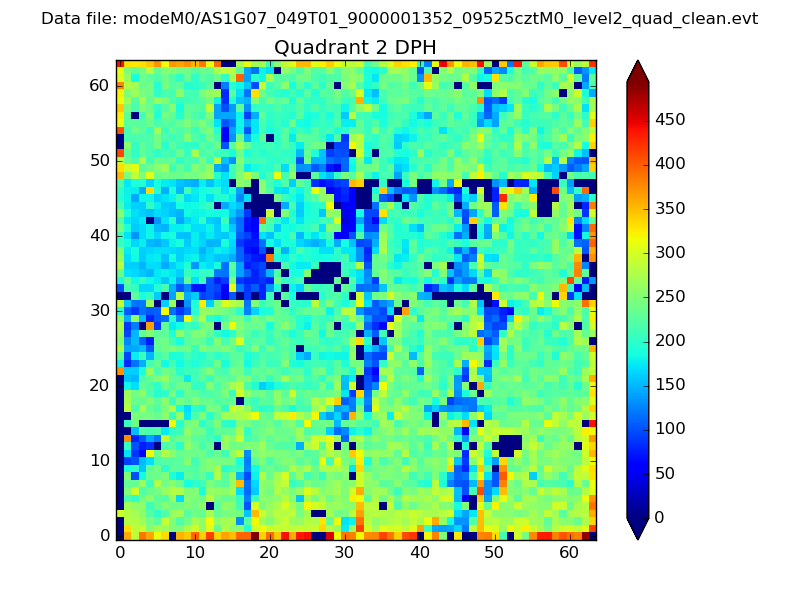 |
Quadrant C |
| Plot type | Count rate plots | Images |
|---|---|---|
| Comparison with Poisson distribution Blue bars denote a histogram of data divided into 1 sec bins. Red curve is a Poisson curve with rate = median count rate of data. |
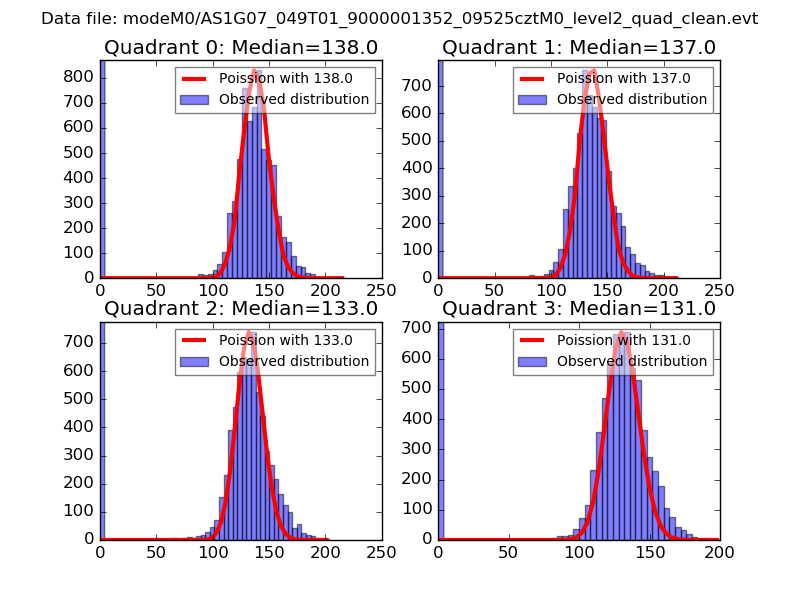 |
 |
| Quadrant-wise count rates Data is divided into 100 sec bins |
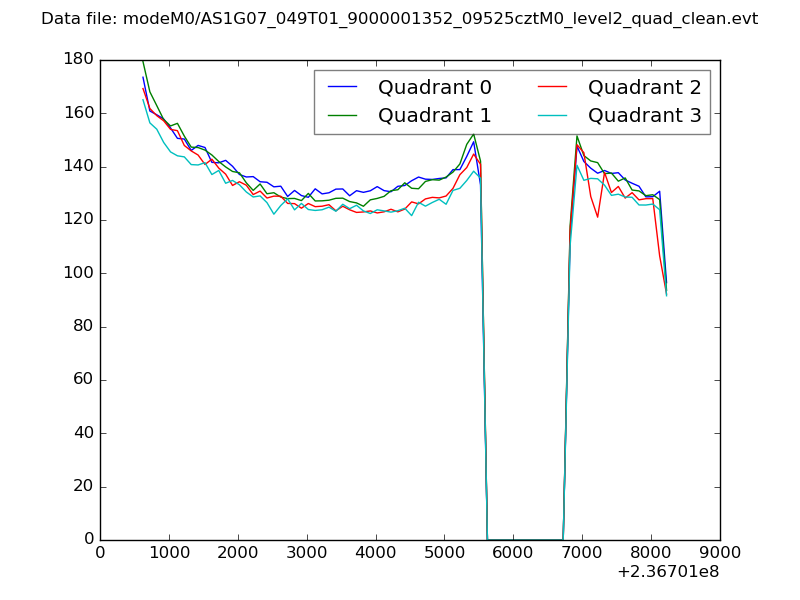 |
|
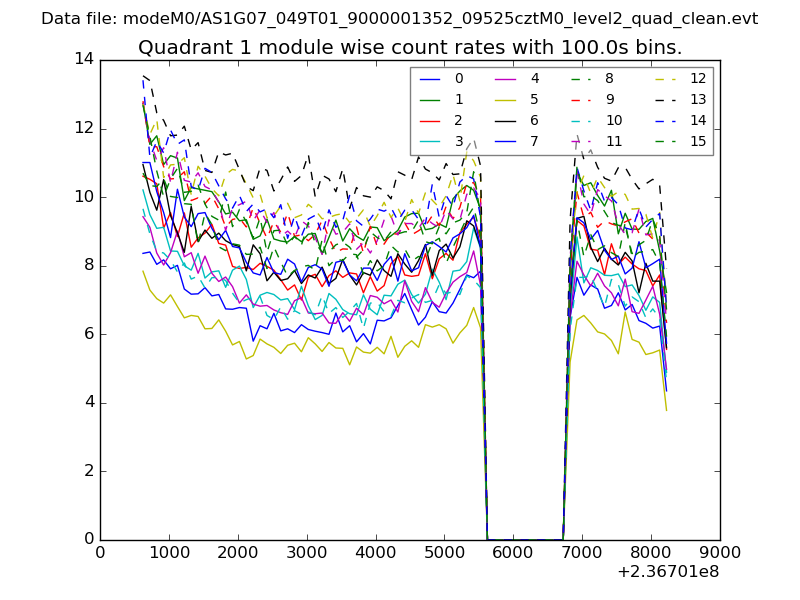
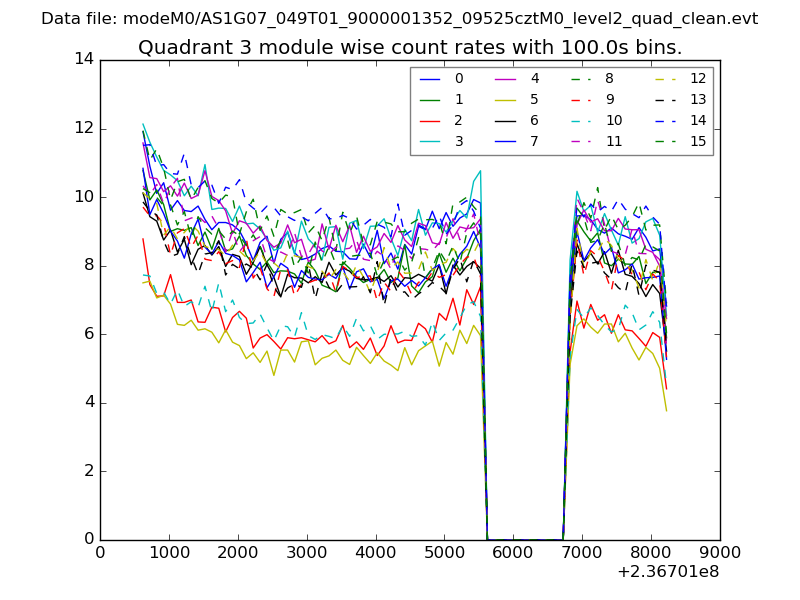
| Module-wise count rates for Quadrant A Data is divided into 100 sec bins |
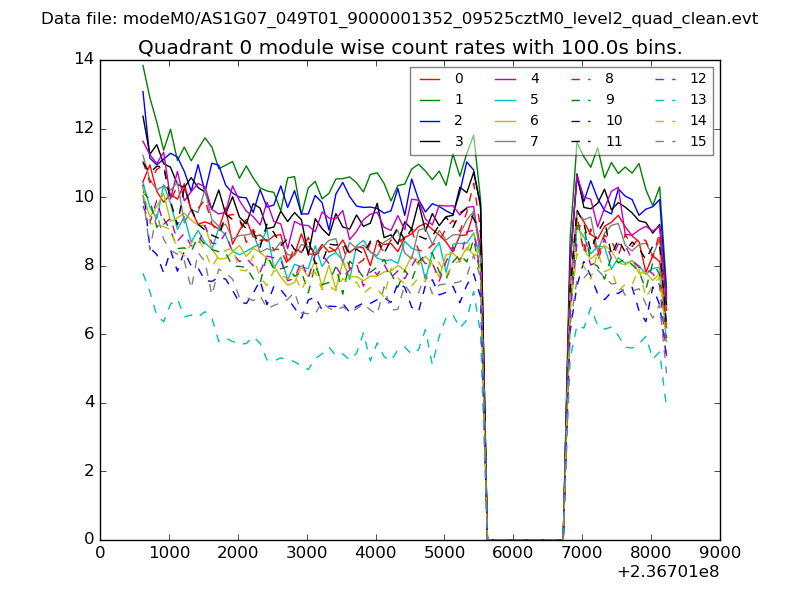 |
 |
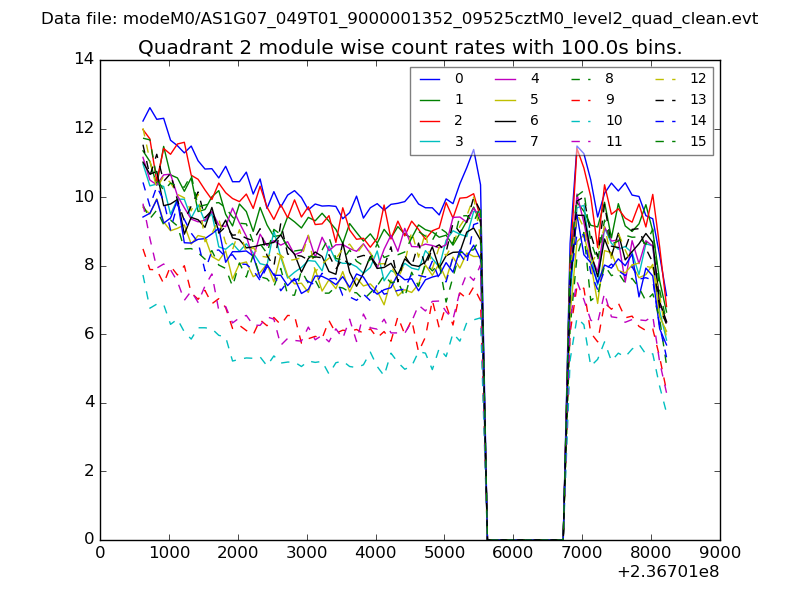
| Module-wise count rates for Quadrant B Data is divided into 100 sec bins |
 |
 |
| Module-wise count rates for Quadrant C Data is divided into 100 sec bins |
 |
 |
| Module-wise count rates for Quadrant D Data is divided into 100 sec bins |
 |
 |
| Parameter | Plot |
|---|---|
| CZT HV Monitor | 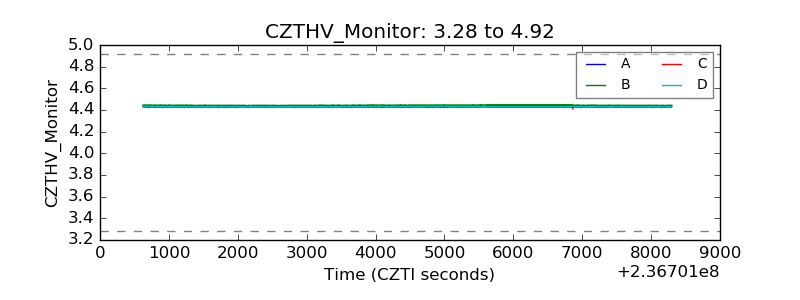 |
| D_VDD | 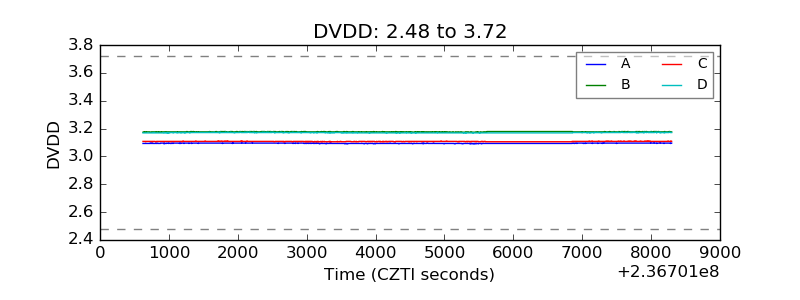 |
| Temperature 1 | 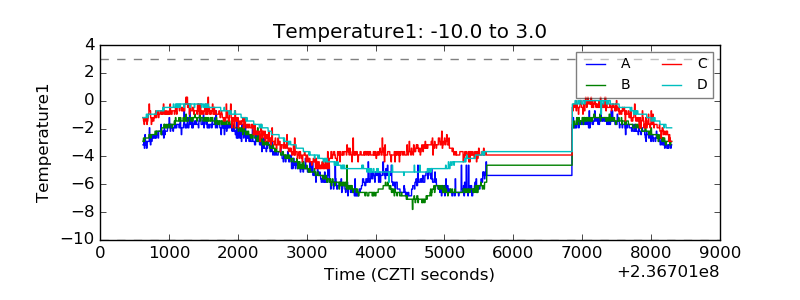 |
| Veto HV Monitor | 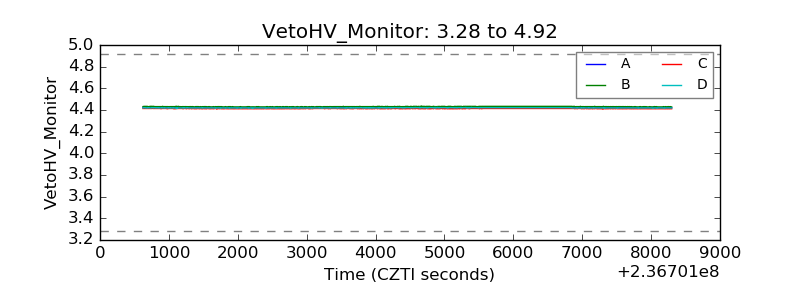 |
| Veto LLD | 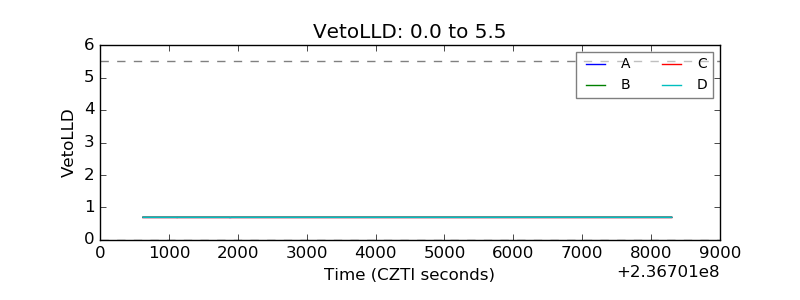 |
| Alpha Counter | 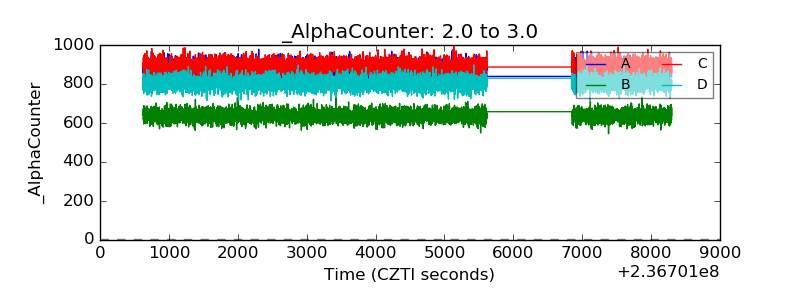 |
| _CPM_Rate | 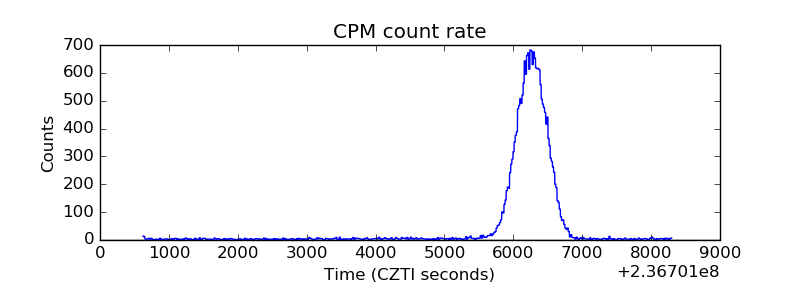 |
| CZT Counter | 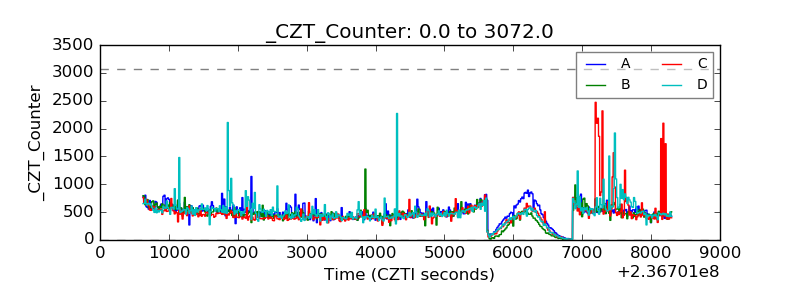 |
| +2.5 Volts monitor |  |
| +5 Volts monitor |  |
| _ROLL_ROT | 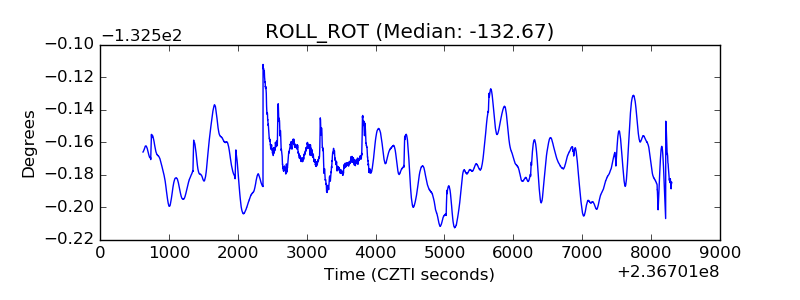 |
| _Roll_DEC | 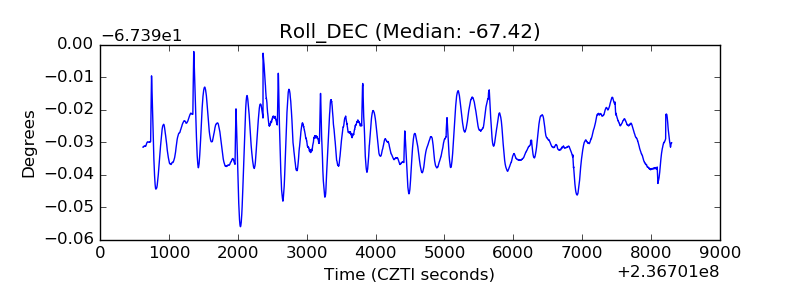 |
| _Roll_RA | 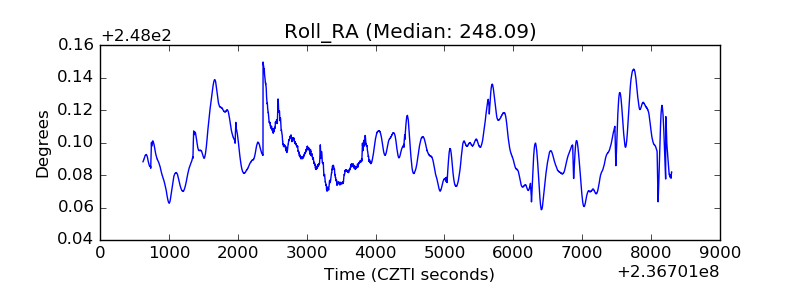 |
| Veto Counter | 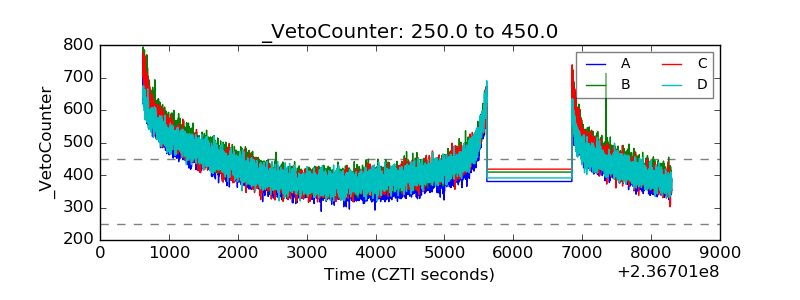 |