| Param | Original file | Final file |
|---|---|---|
| Filename | modeM0/AS1G07_049T01_9000001352_09527cztM0_level2.evt | modeM0/AS1G07_049T01_9000001352_09527cztM0_level2_quad_clean.evt |
| Size (bytes) | 410,944,320 | 115,784,640 |
| Size | 391.9 MB | 110.4 MB |
| Events in quadrant A | 2,899,130 | 781,157 |
| Events in quadrant B | 2,943,688 | 781,181 |
| Events in quadrant C | 2,890,798 | 760,040 |
| Events in quadrant D | 3,284,743 | 746,541 |
| Mode M9 | |||
|---|---|---|---|
| Quadrant | BADHDUFLAG | Total packets | Discarded packets |
| A | 0 | 6 | 0 |
| B | 0 | 6 | 0 |
| C | 0 | 6 | 0 |
| D | 0 | 6 | 0 |
| Mode M0 | |||
|---|---|---|---|
| Quadrant | BADHDUFLAG | Total packets | Discarded packets |
| A | 0 | 14132 | 1248 |
| B | 0 | 14310 | 1212 |
| C | 0 | 14534 | 1377 |
| D | 0 | 15185 | 1381 |
| Mode SS | |||
|---|---|---|---|
| Quadrant | BADHDUFLAG | Total packets | Discarded packets |
| A | 0 | 140 | 12 |
| B | 0 | 140 | 12 |
| C | 0 | 140 | 14 |
| D | 0 | 140 | 10 |
| Quadrant | Total seconds | Saturated seconds | Saturation percentage |
|---|---|---|---|
| A | 6273 | 25 | 0.398533% |
| B | 6290 | 34 | 0.540541% |
| C | 6234 | 52 | 0.834135% |
| D | 6248 | 18 | 0.288092% |
Noise dominated data is calculated using 1-second bins in cleaned event files. If a bin has >2000 counts, and if more than 50% of those come from <1% of pixels, then it is considered to be noise-dominated and hence unusable.
| Quadrant | # 1 sec bins | Bins with >0 counts | Bins with >2000 counts | High rate bins dominated by noise | Noise dominated (total time) | Noise dominated (detector-on time) | Marked lightcurve |
|---|---|---|---|---|---|---|---|
| A | 7419 | 6575 | 2 | 2 | 0.03% | 0.03% | 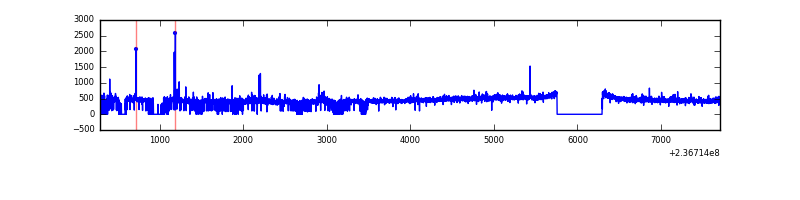 |
| B | 7419 | 6598 | 1 | 1 | 0.01% | 0.02% | 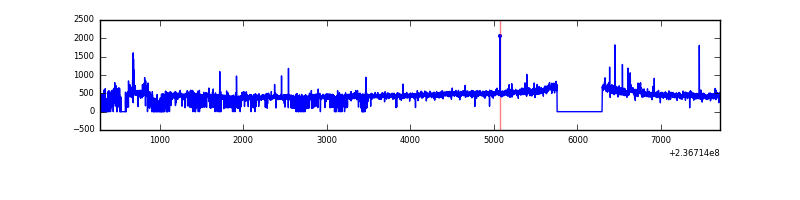 |
| C | 7419 | 6546 | 32 | 32 | 0.43% | 0.49% | 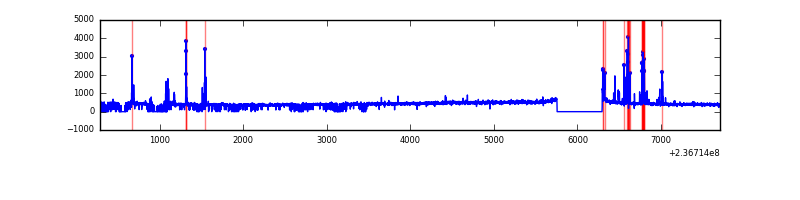 |
| D | 7419 | 6562 | 10 | 10 | 0.13% | 0.15% | 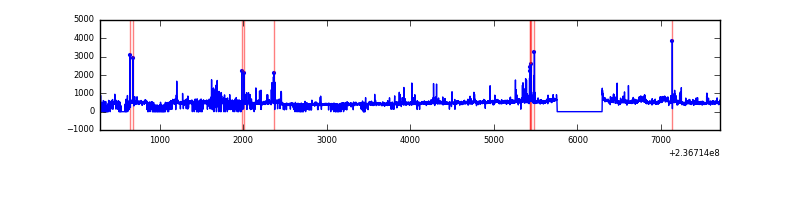 |
Top three noisy pixels from each quadrant. If the there are fewer than three noisy pixels in the level2.evt file, extra rows are filled as -1
| Pixel properties | Quadrant properties | ||||||
|---|---|---|---|---|---|---|---|
| Quadrant | DetID | PixID | Counts | Sigma | Mean | Median | Sigma |
| A | 1 | 162 | 49803 | 333.94 | 724 | 709 | 147.0 |
| A | 1 | 178 | 17018 | 110.93 | 724 | 709 | 147.0 |
| A | 1 | 161 | 15611 | 101.36 | 724 | 709 | 147.0 |
| B | 0 | 219 | 70889 | 508.92 | 723 | 706 | 137.9 |
| B | 12 | 111 | 13891 | 95.61 | 723 | 706 | 137.9 |
| B | 11 | 111 | 11199 | 76.09 | 723 | 706 | 137.9 |
| C | 4 | 254 | 194872 | 1221.07 | 688 | 691 | 159.0 |
| C | 14 | 234 | 8916 | 51.72 | 688 | 691 | 159.0 |
| C | 13 | 61 | 5189 | 28.28 | 688 | 691 | 159.0 |
| D | 8 | 195 | 282791 | 1520.63 | 685 | 670 | 185.5 |
| D | 13 | 137 | 148470 | 796.64 | 685 | 670 | 185.5 |
| D | 1 | 52 | 73563 | 392.89 | 685 | 670 | 185.5 |
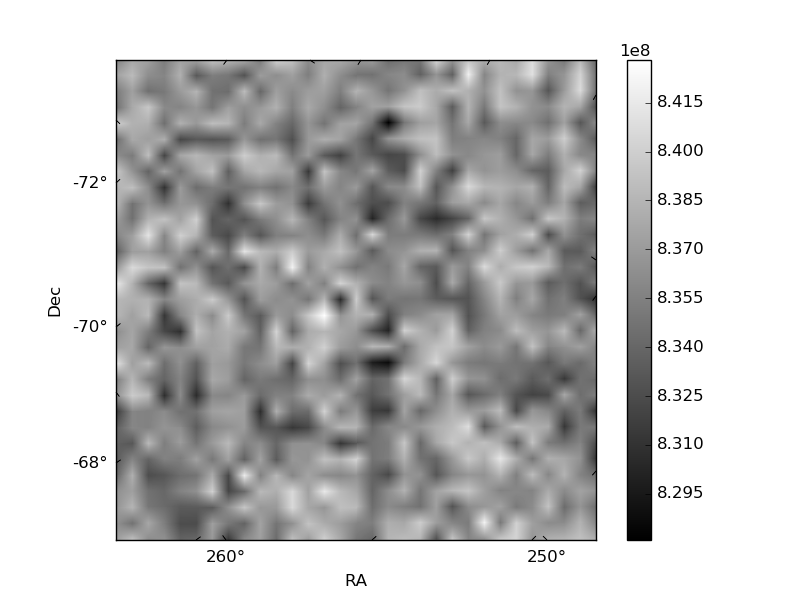
Histogram calculated using DETX and DETY for each event in the final _common_clean file
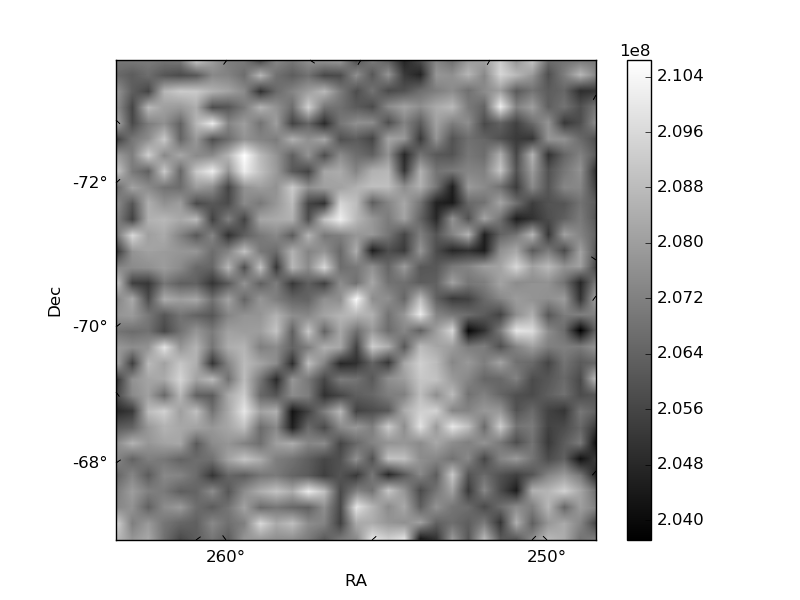
| Quadrant A | 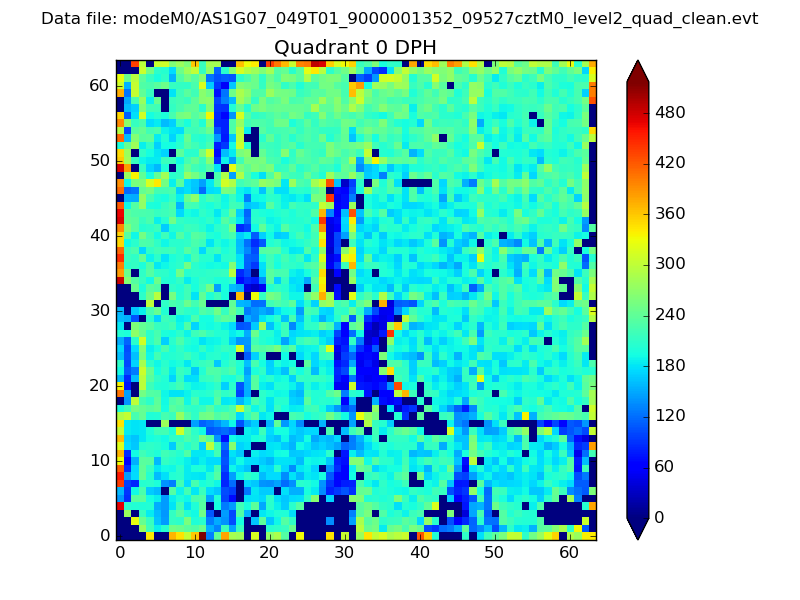 |
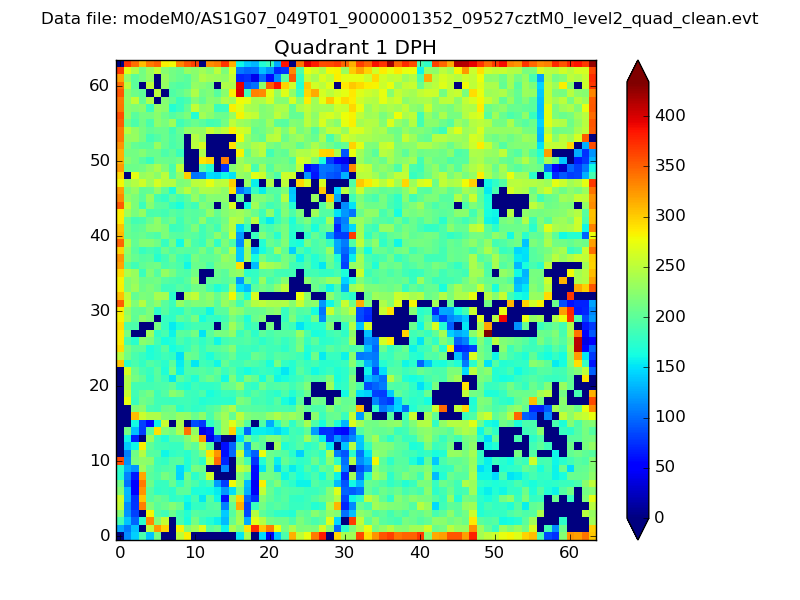 |
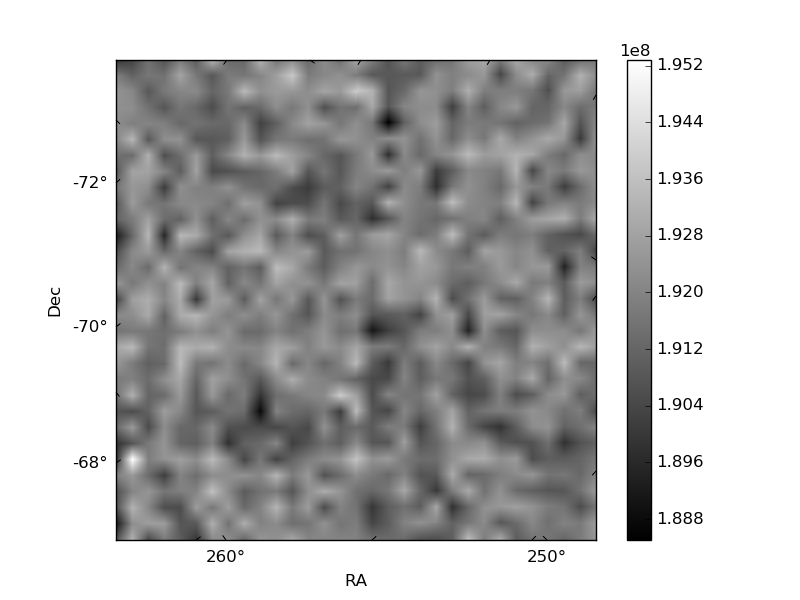
Quadrant B |
|---|---|---|---|
| Quadrant D | 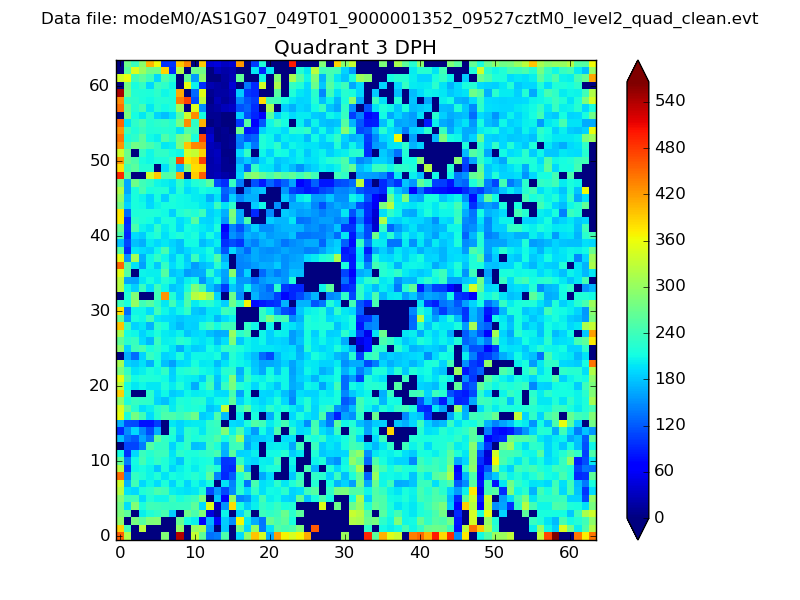 |
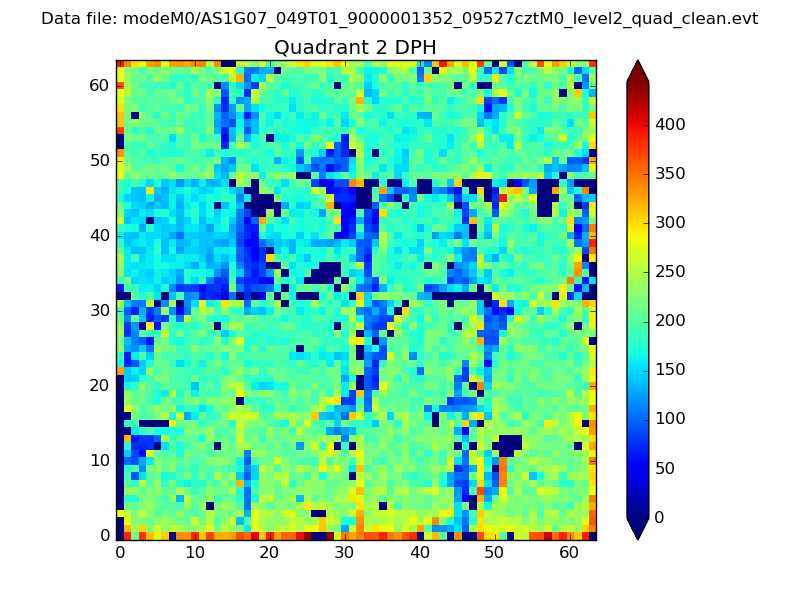 |
Quadrant C |
| Plot type | Count rate plots | Images |
|---|---|---|
| Comparison with Poisson distribution Blue bars denote a histogram of data divided into 1 sec bins. Red curve is a Poisson curve with rate = median count rate of data. |
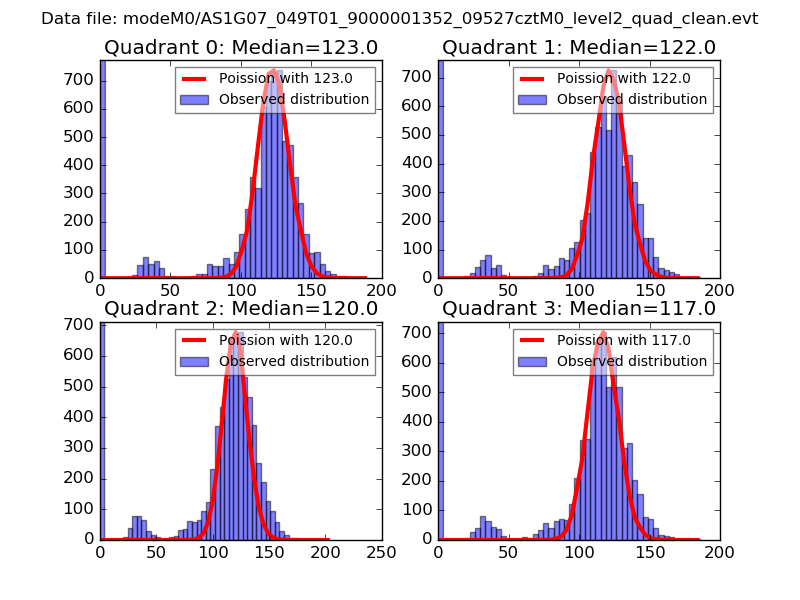 |
 |
| Quadrant-wise count rates Data is divided into 100 sec bins |
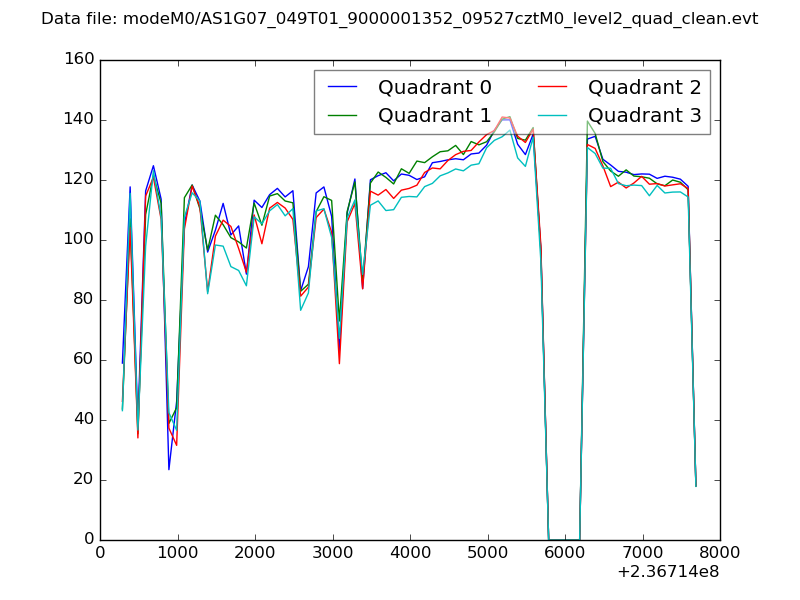 |
|
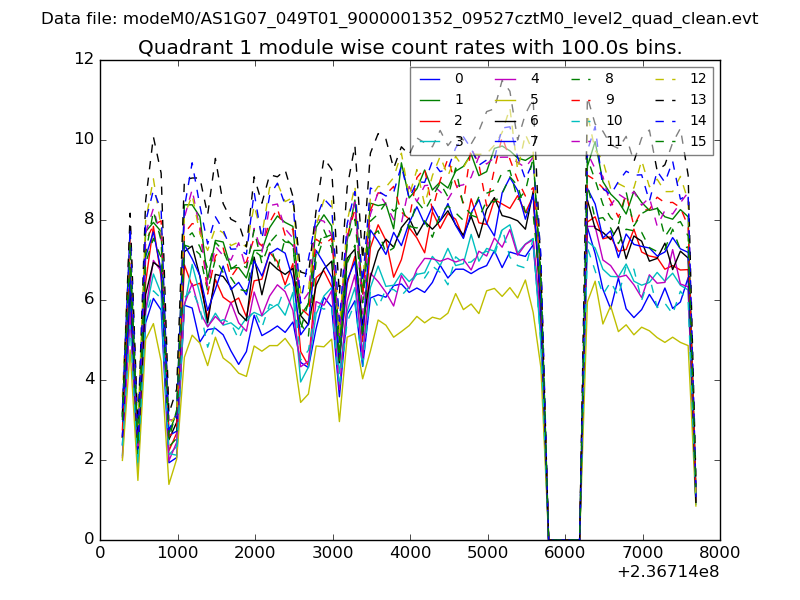
| Module-wise count rates for Quadrant A Data is divided into 100 sec bins |
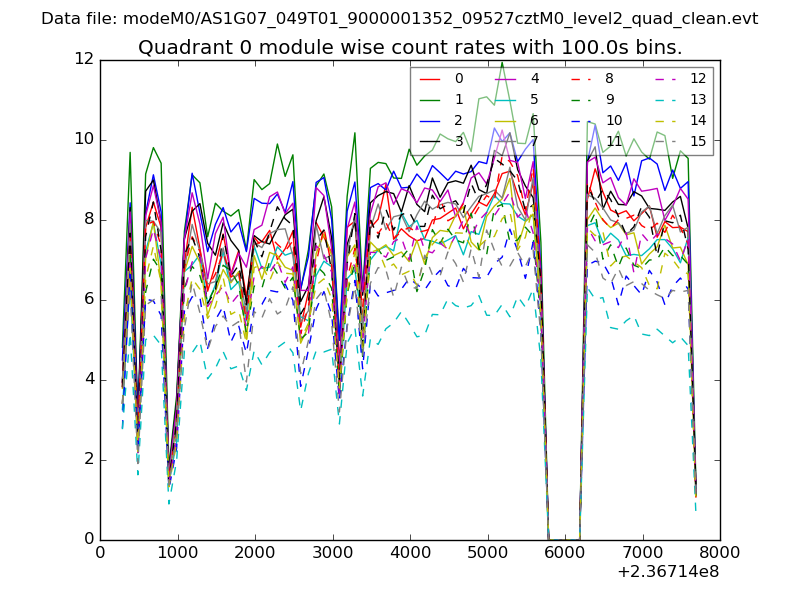 |
 |
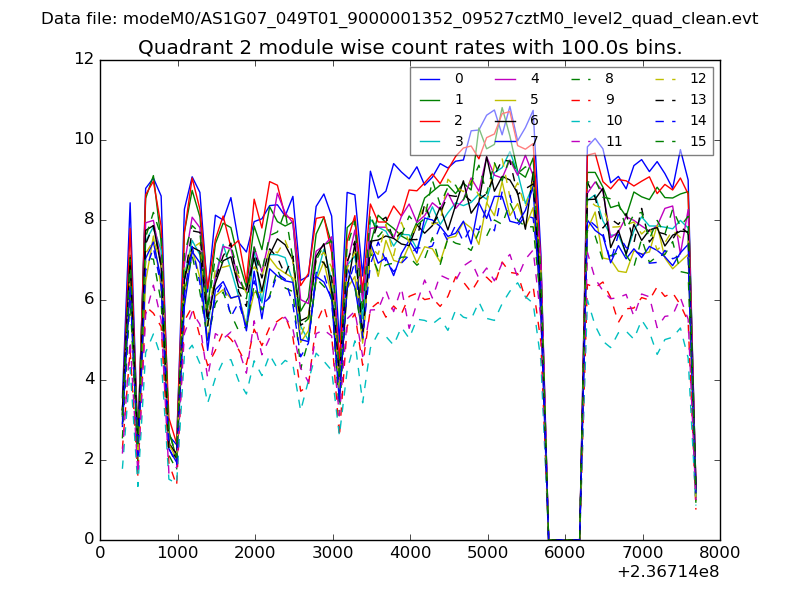
| Module-wise count rates for Quadrant B Data is divided into 100 sec bins |
 |
 |
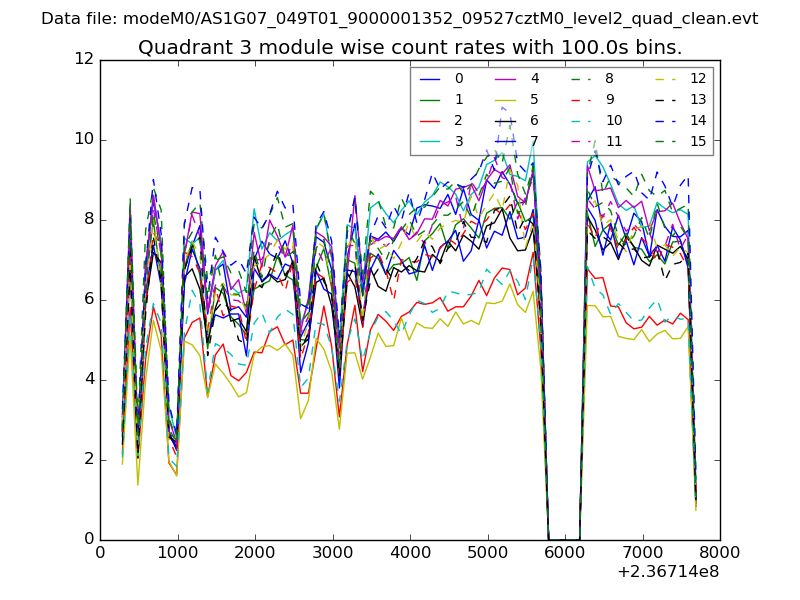
| Module-wise count rates for Quadrant C Data is divided into 100 sec bins |
 |
 |
| Module-wise count rates for Quadrant D Data is divided into 100 sec bins |
 |
 |
| Parameter | Plot |
|---|---|
| CZT HV Monitor | 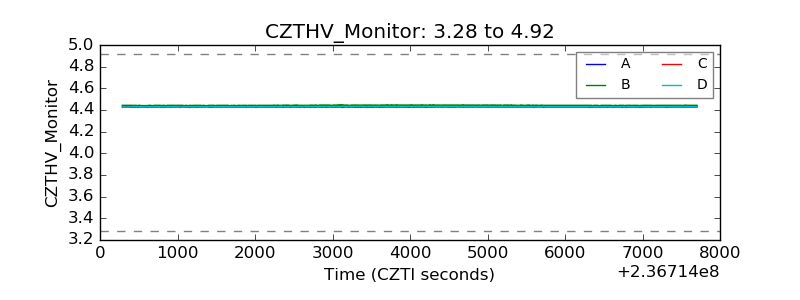 |
| D_VDD |  |
| Temperature 1 | 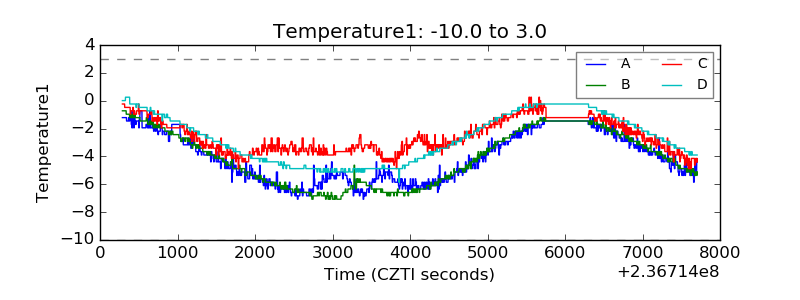 |
| Veto HV Monitor | 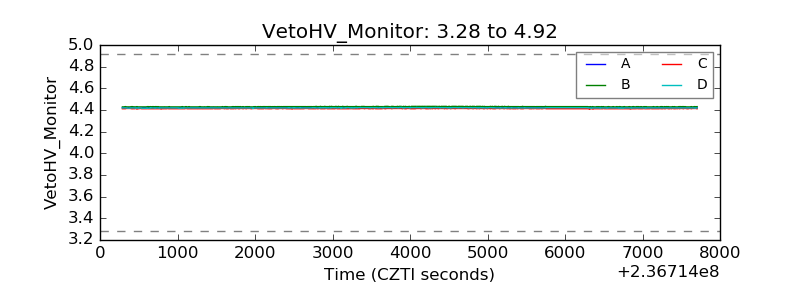 |
| Veto LLD | 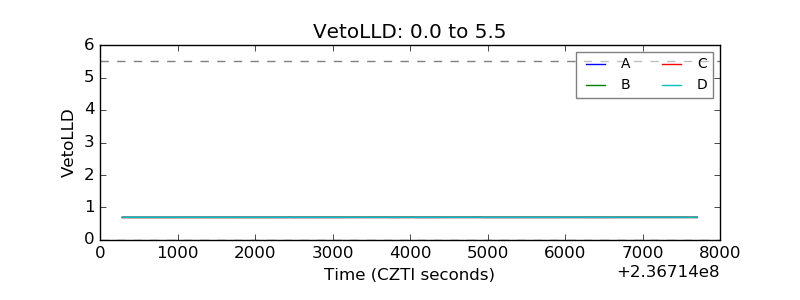 |
| Alpha Counter | 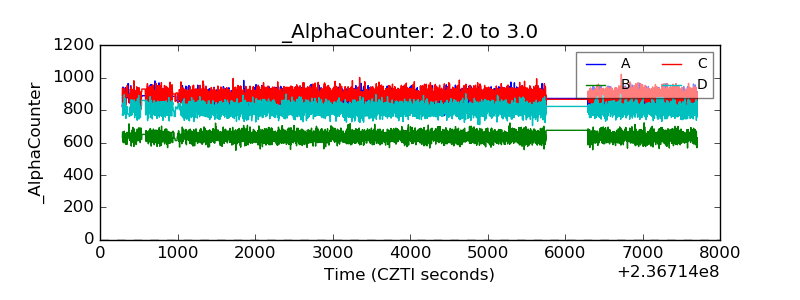 |
| _CPM_Rate | 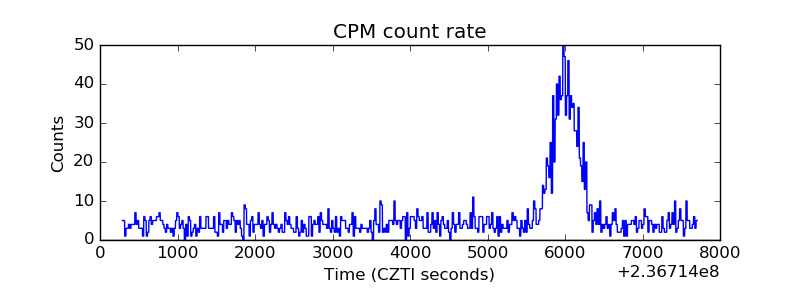 |
| CZT Counter | 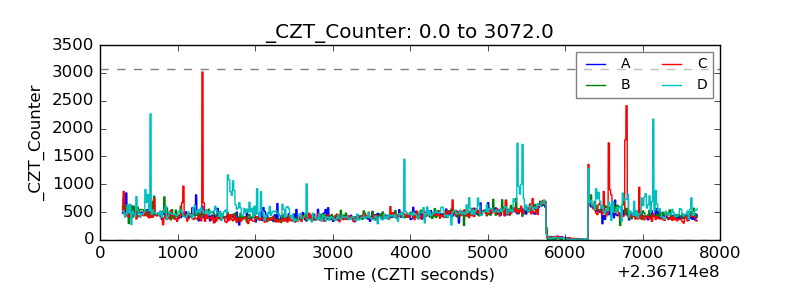 |
| +2.5 Volts monitor |  |
| +5 Volts monitor |  |
| _ROLL_ROT | 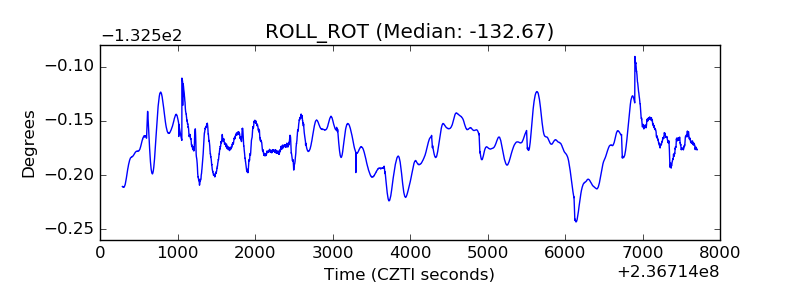 |
| _Roll_DEC | 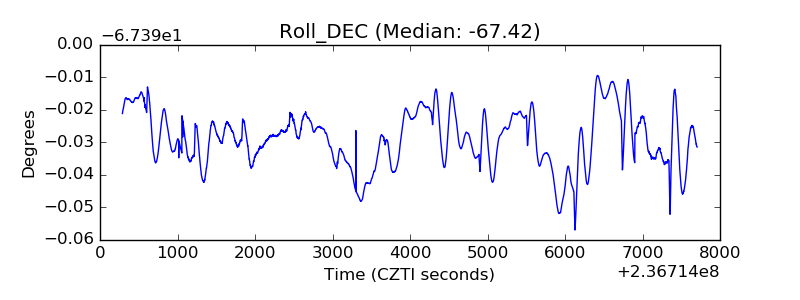 |
| _Roll_RA | 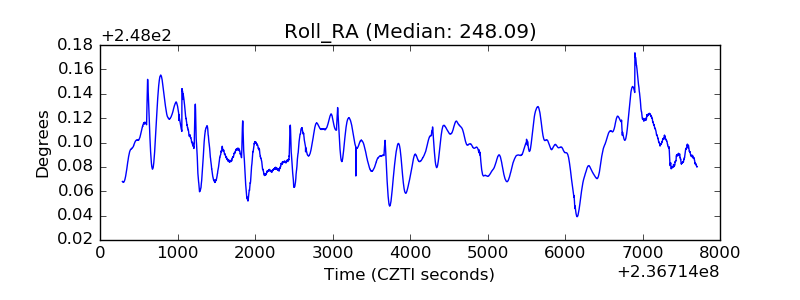 |
| Veto Counter | 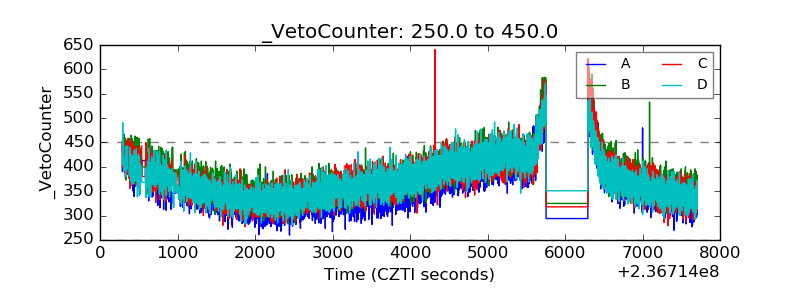 |