| Param | Original file | Final file |
|---|---|---|
| Filename | modeM0/AS1G07_049T01_9000001352_09528cztM0_level2.evt | modeM0/AS1G07_049T01_9000001352_09528cztM0_level2_quad_clean.evt |
| Size (bytes) | 532,503,360 | 143,236,800 |
| Size | 507.8 MB | 136.6 MB |
| Events in quadrant A | 3,761,024 | 963,108 |
| Events in quadrant B | 3,859,310 | 963,366 |
| Events in quadrant C | 3,937,071 | 941,214 |
| Events in quadrant D | 4,037,666 | 926,304 |
| Mode M9 | |||
|---|---|---|---|
| Quadrant | BADHDUFLAG | Total packets | Discarded packets |
| A | 0 | 6 | 0 |
| B | 0 | 6 | 0 |
| C | 0 | 6 | 0 |
| D | 0 | 6 | 0 |
| Mode M0 | |||
|---|---|---|---|
| Quadrant | BADHDUFLAG | Total packets | Discarded packets |
| A | 0 | 16640 | 23 |
| B | 0 | 16990 | 25 |
| C | 0 | 17563 | 19 |
| D | 0 | 17389 | 32 |
| Mode SS | |||
|---|---|---|---|
| Quadrant | BADHDUFLAG | Total packets | Discarded packets |
| A | 0 | 158 | 0 |
| B | 0 | 158 | 0 |
| C | 0 | 158 | 0 |
| D | 0 | 158 | 0 |
| Quadrant | Total seconds | Saturated seconds | Saturation percentage |
|---|---|---|---|
| A | 7833 | 107 | 1.366016% |
| B | 7831 | 140 | 1.787767% |
| C | 7834 | 186 | 2.374266% |
| D | 7829 | 60 | 0.766381% |
Noise dominated data is calculated using 1-second bins in cleaned event files. If a bin has >2000 counts, and if more than 50% of those come from <1% of pixels, then it is considered to be noise-dominated and hence unusable.
| Quadrant | # 1 sec bins | Bins with >0 counts | Bins with >2000 counts | High rate bins dominated by noise | Noise dominated (total time) | Noise dominated (detector-on time) | Marked lightcurve |
|---|---|---|---|---|---|---|---|
| A | 8443 | 7845 | 1 | 1 | 0.01% | 0.01% | 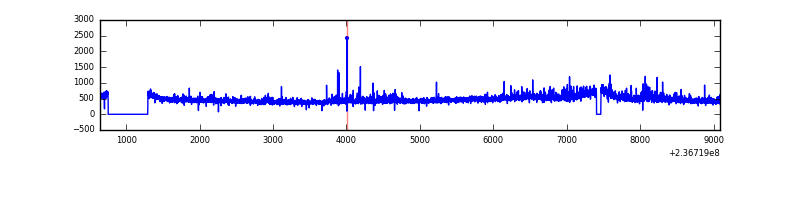 |
| B | 8443 | 7845 | 18 | 18 | 0.21% | 0.23% | 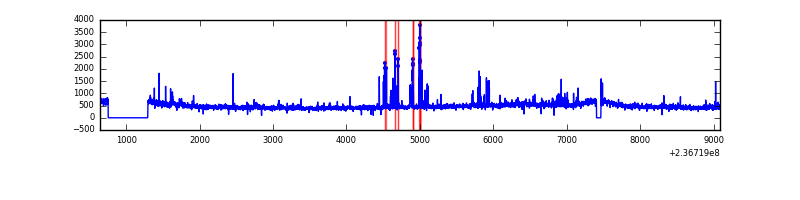 |
| C | 8443 | 7845 | 86 | 86 | 1.02% | 1.10% | 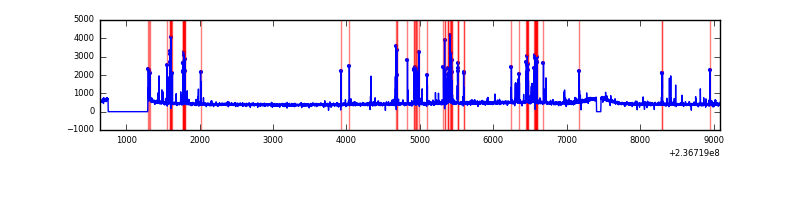 |
| D | 8443 | 7845 | 21 | 21 | 0.25% | 0.27% | 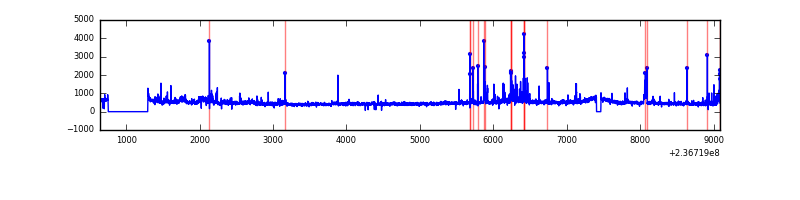 |
Top three noisy pixels from each quadrant. If the there are fewer than three noisy pixels in the level2.evt file, extra rows are filled as -1
| Pixel properties | Quadrant properties | ||||||
|---|---|---|---|---|---|---|---|
| Quadrant | DetID | PixID | Counts | Sigma | Mean | Median | Sigma |
| A | 1 | 162 | 109127 | 582.87 | 911 | 890 | 185.7 |
| A | 1 | 178 | 40199 | 211.69 | 911 | 890 | 185.7 |
| A | 1 | 161 | 38893 | 204.65 | 911 | 890 | 185.7 |
| B | 0 | 214 | 186390 | 1066.82 | 913 | 890 | 173.9 |
| B | 0 | 219 | 65412 | 371.07 | 913 | 890 | 173.9 |
| B | 4 | 80 | 28301 | 157.64 | 913 | 890 | 173.9 |
| C | 4 | 254 | 512820 | 2548.71 | 870 | 873 | 200.9 |
| C | 14 | 234 | 21637 | 103.37 | 870 | 873 | 200.9 |
| C | 13 | 61 | 6568 | 28.35 | 870 | 873 | 200.9 |
| D | 8 | 195 | 262794 | 1128.48 | 868 | 846 | 232.1 |
| D | 13 | 137 | 130503 | 558.56 | 868 | 846 | 232.1 |
| D | 12 | 233 | 123363 | 527.81 | 868 | 846 | 232.1 |
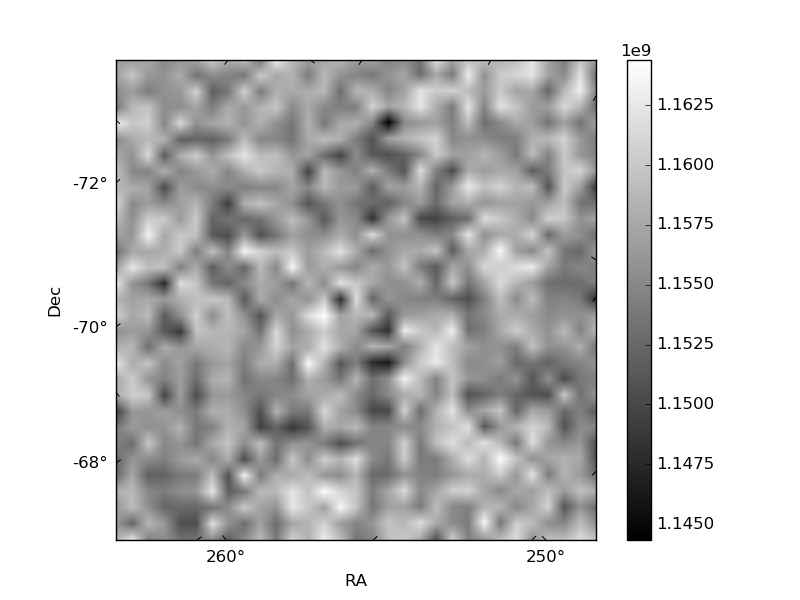
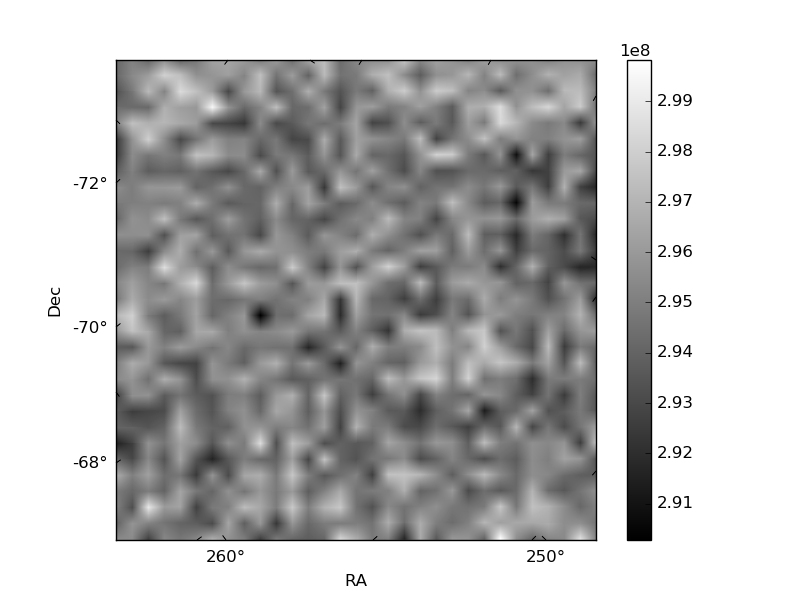
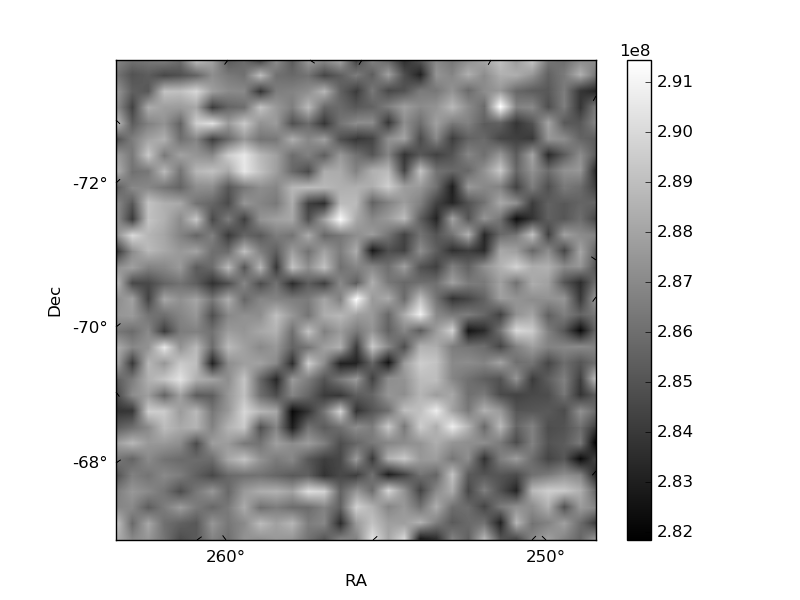
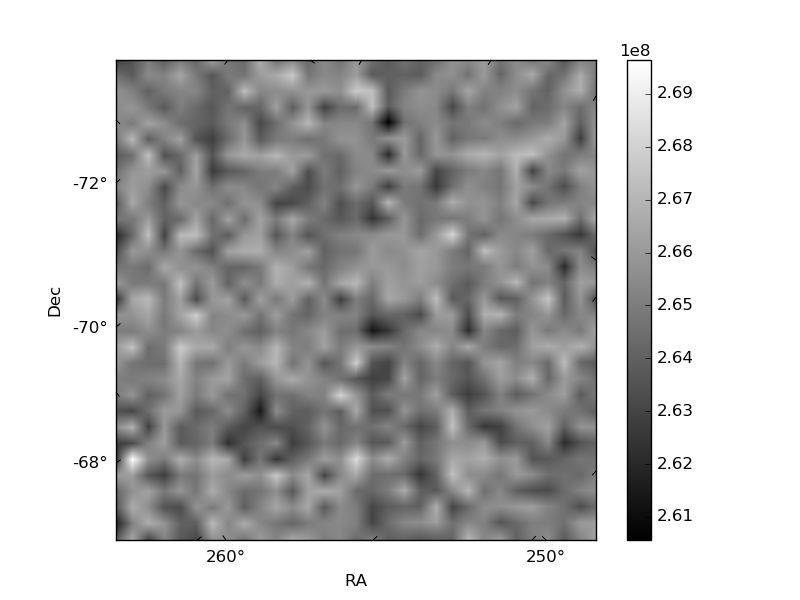
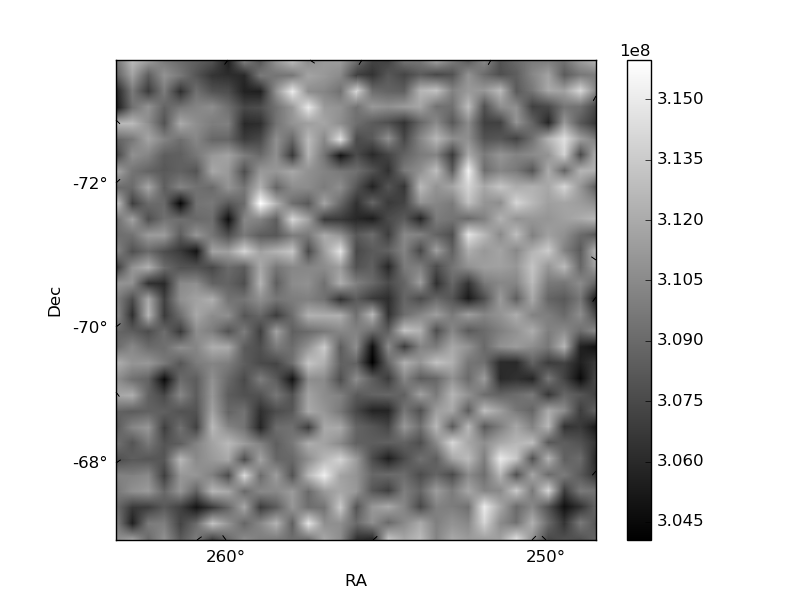
Histogram calculated using DETX and DETY for each event in the final _common_clean file
| Quadrant A | 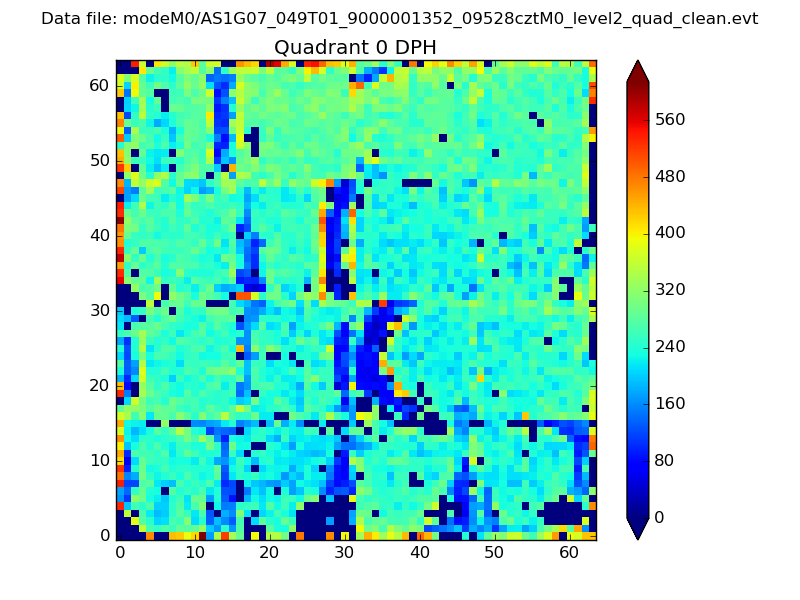 |
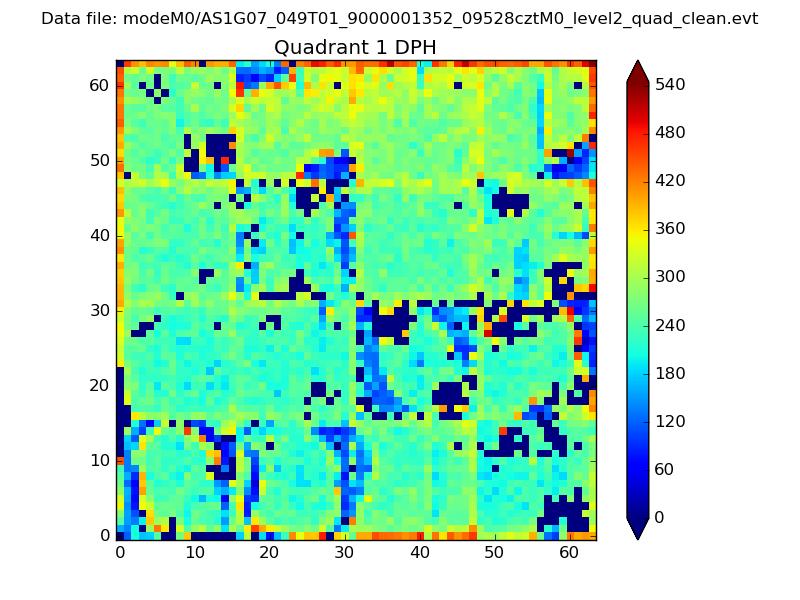 |
Quadrant B |
|---|---|---|---|
| Quadrant D | 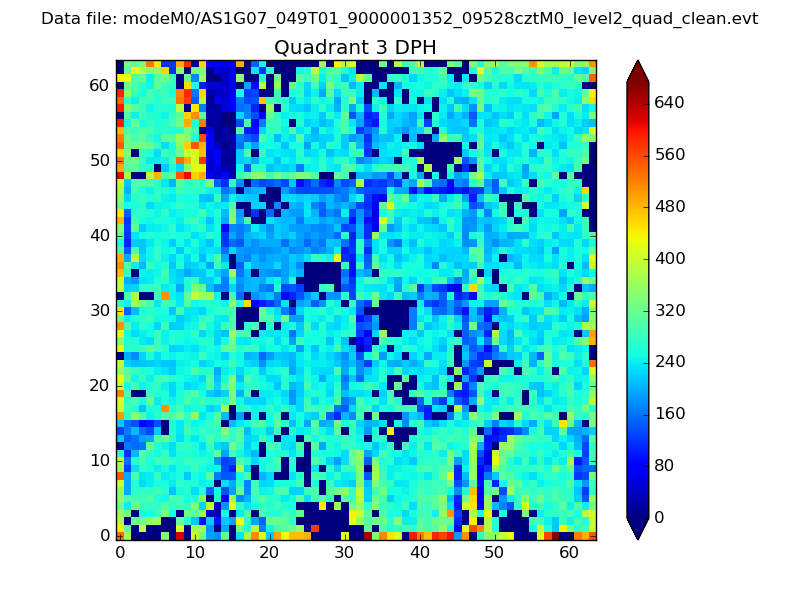 |
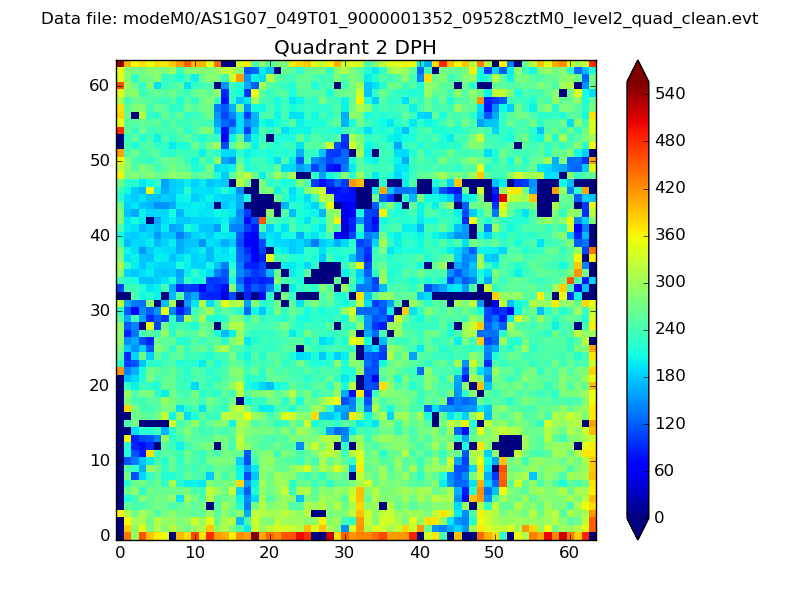 |
Quadrant C |
| Plot type | Count rate plots | Images |
|---|---|---|
| Comparison with Poisson distribution Blue bars denote a histogram of data divided into 1 sec bins. Red curve is a Poisson curve with rate = median count rate of data. |
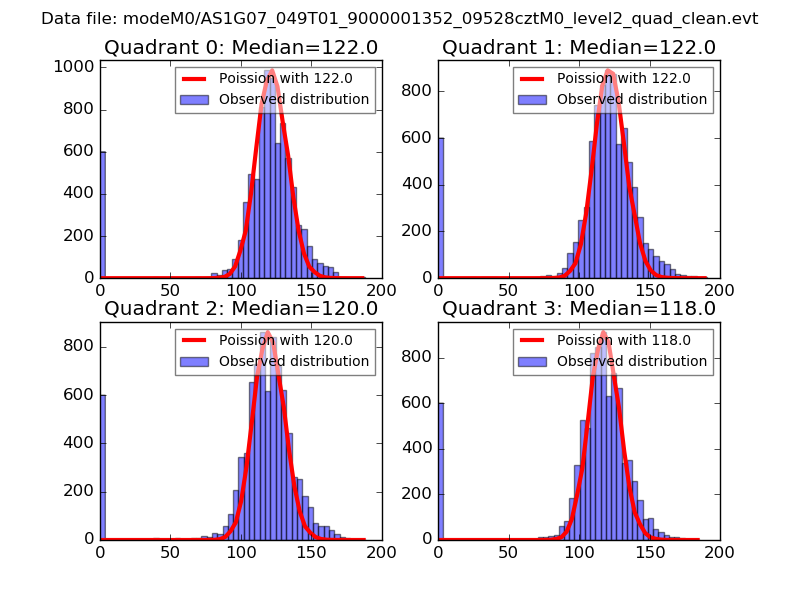 |
 |
| Quadrant-wise count rates Data is divided into 100 sec bins |
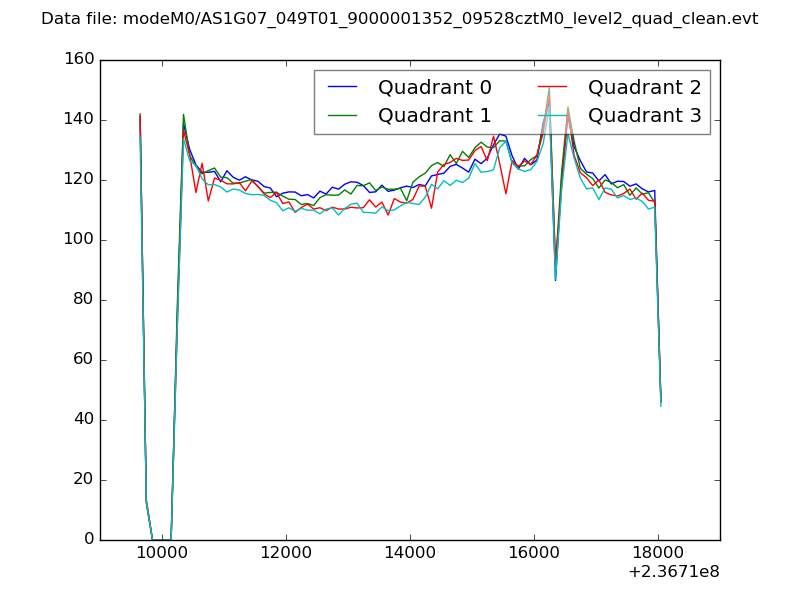 |
|
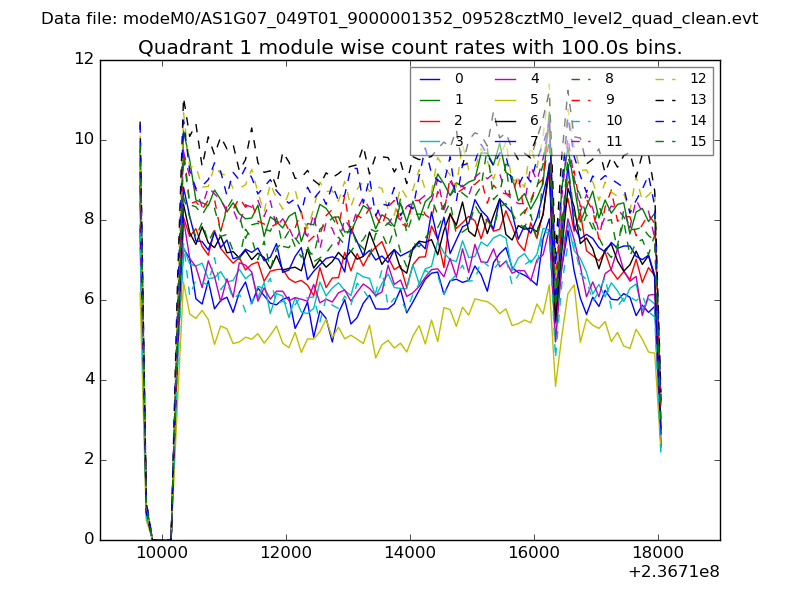
| Module-wise count rates for Quadrant A Data is divided into 100 sec bins |
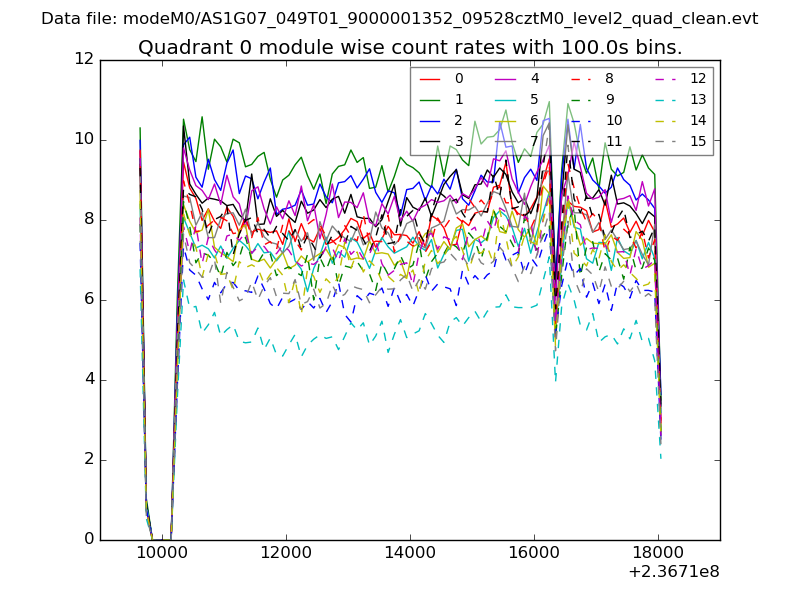 |
 |
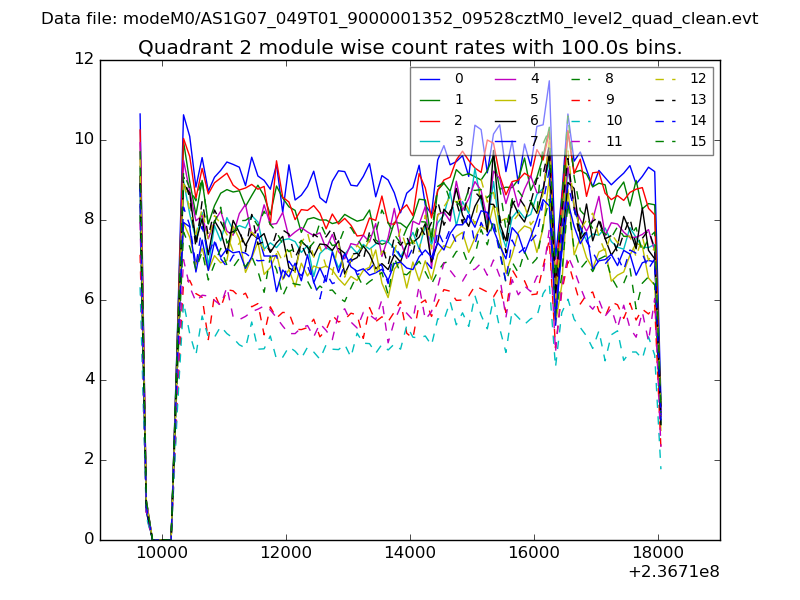
| Module-wise count rates for Quadrant B Data is divided into 100 sec bins |
 |
 |
| Module-wise count rates for Quadrant C Data is divided into 100 sec bins |
 |
 |
| Module-wise count rates for Quadrant D Data is divided into 100 sec bins |
 |
 |
| Parameter | Plot |
|---|---|
| CZT HV Monitor | 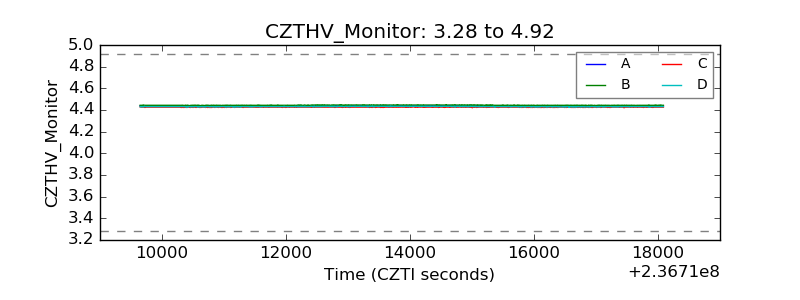 |
| D_VDD | 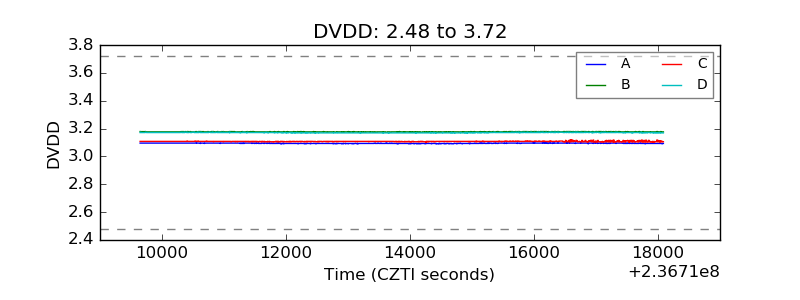 |
| Temperature 1 |  |
| Veto HV Monitor | 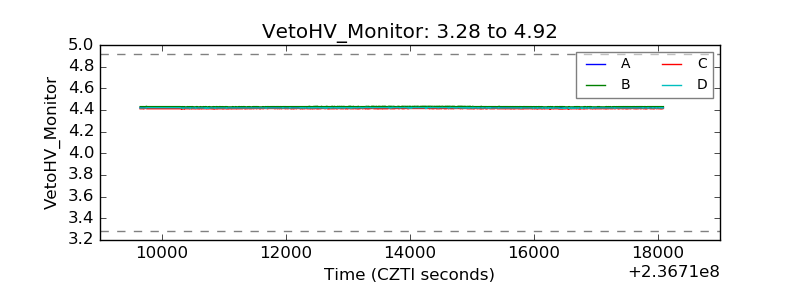 |
| Veto LLD | 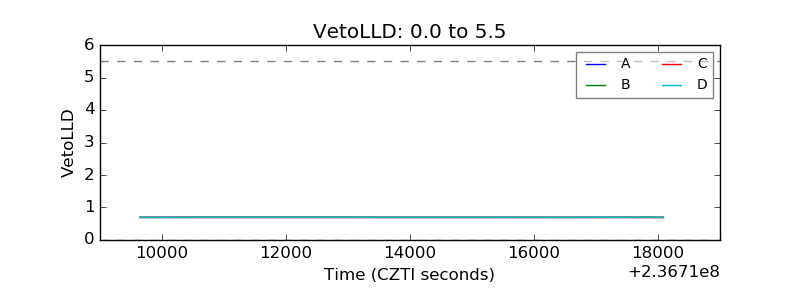 |
| Alpha Counter | 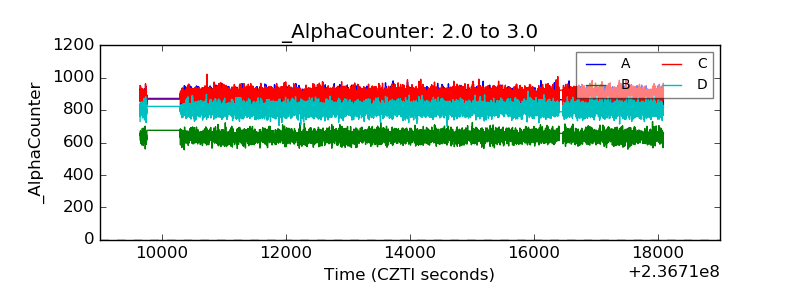 |
| _CPM_Rate | 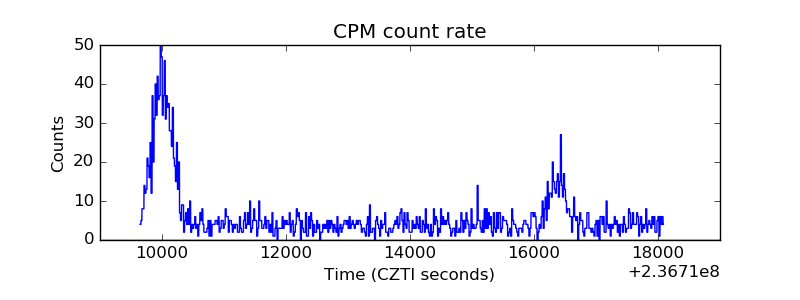 |
| CZT Counter | 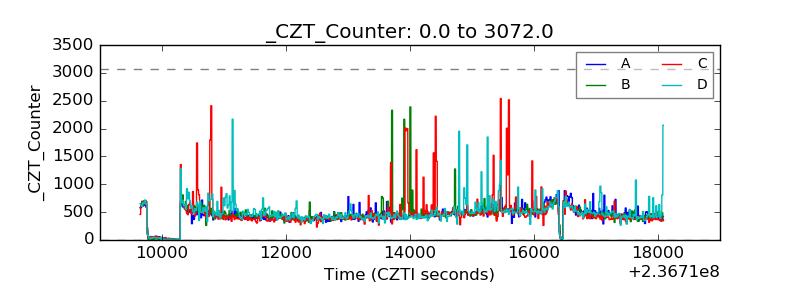 |
| +2.5 Volts monitor |  |
| +5 Volts monitor |  |
| _ROLL_ROT | 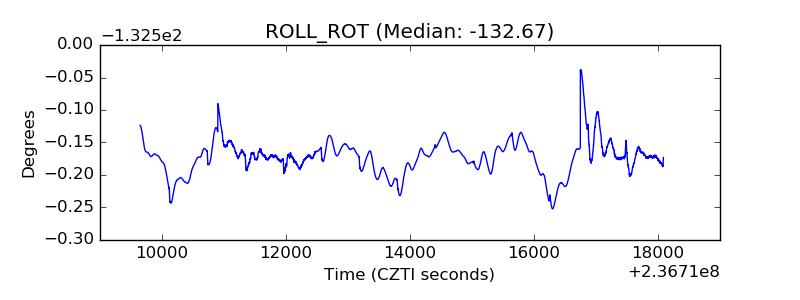 |
| _Roll_DEC |  |
| _Roll_RA | 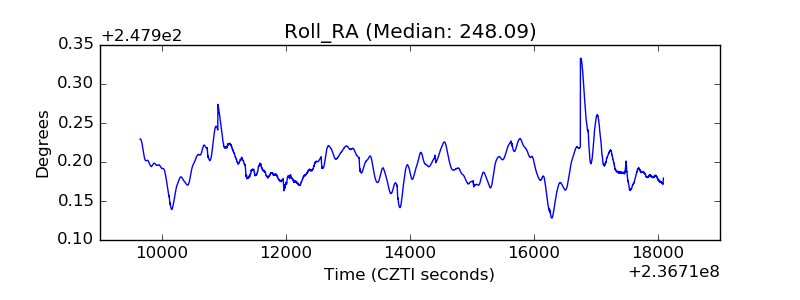 |
| Veto Counter | 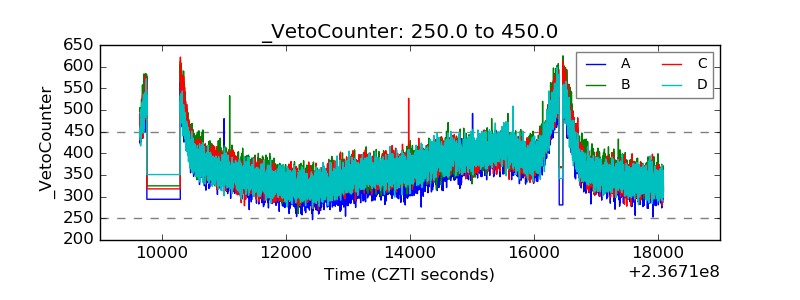 |