| Param | Original file | Final file |
|---|---|---|
| Filename | modeM0/AS1G07_049T01_9000001352_09529cztM0_level2.evt | modeM0/AS1G07_049T01_9000001352_09529cztM0_level2_quad_clean.evt |
| Size (bytes) | 558,852,480 | 146,828,160 |
| Size | 533.0 MB | 140.0 MB |
| Events in quadrant A | 4,058,263 | 985,038 |
| Events in quadrant B | 3,810,963 | 989,521 |
| Events in quadrant C | 4,400,273 | 960,073 |
| Events in quadrant D | 4,103,943 | 948,149 |
| Mode M9 | |||
|---|---|---|---|
| Quadrant | BADHDUFLAG | Total packets | Discarded packets |
| A | 0 | 3 | 0 |
| B | 0 | 3 | 0 |
| C | 0 | 3 | 0 |
| D | 0 | 3 | 0 |
| Mode M0 | |||
|---|---|---|---|
| Quadrant | BADHDUFLAG | Total packets | Discarded packets |
| A | 0 | 18059 | 420 |
| B | 0 | 17505 | 407 |
| C | 0 | 19404 | 444 |
| D | 0 | 18316 | 430 |
| Mode SS | |||
|---|---|---|---|
| Quadrant | BADHDUFLAG | Total packets | Discarded packets |
| A | 0 | 168 | 6 |
| B | 0 | 168 | 4 |
| C | 0 | 168 | 2 |
| D | 0 | 168 | 2 |
| Quadrant | Total seconds | Saturated seconds | Saturation percentage |
|---|---|---|---|
| A | 8118 | 126 | 1.552106% |
| B | 8119 | 128 | 1.576549% |
| C | 8116 | 264 | 3.252834% |
| D | 8118 | 92 | 1.133284% |
Noise dominated data is calculated using 1-second bins in cleaned event files. If a bin has >2000 counts, and if more than 50% of those come from <1% of pixels, then it is considered to be noise-dominated and hence unusable.
| Quadrant | # 1 sec bins | Bins with >0 counts | Bins with >2000 counts | High rate bins dominated by noise | Noise dominated (total time) | Noise dominated (detector-on time) | Marked lightcurve |
|---|---|---|---|---|---|---|---|
| A | 8627 | 8271 | 0 | 0 | 0.00% | 0.00% | 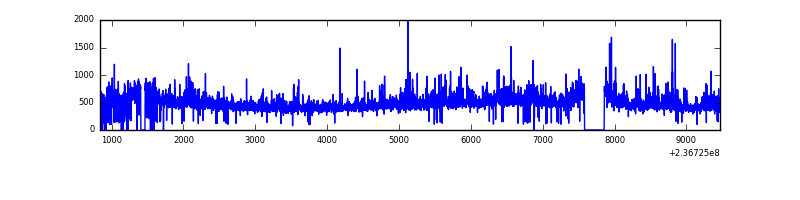 |
| B | 8628 | 8263 | 2 | 2 | 0.02% | 0.02% | 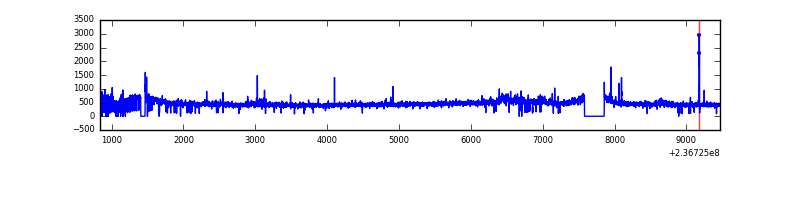 |
| C | 8627 | 8272 | 106 | 106 | 1.23% | 1.28% | 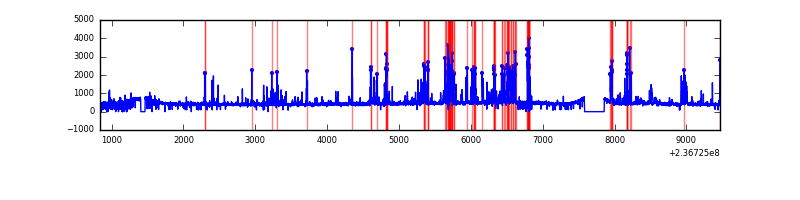 |
| D | 8627 | 8263 | 29 | 29 | 0.34% | 0.35% | 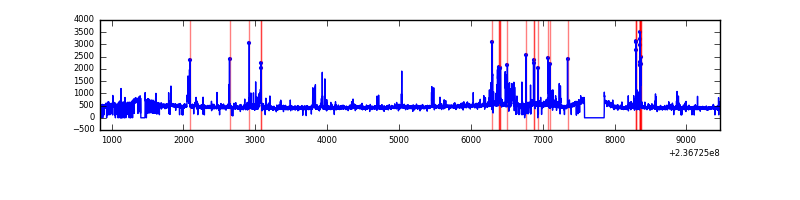 |
Top three noisy pixels from each quadrant. If the there are fewer than three noisy pixels in the level2.evt file, extra rows are filled as -1
| Pixel properties | Quadrant properties | ||||||
|---|---|---|---|---|---|---|---|
| Quadrant | DetID | PixID | Counts | Sigma | Mean | Median | Sigma |
| A | 1 | 162 | 197553 | 1032.86 | 937 | 916 | 190.4 |
| A | 1 | 178 | 79843 | 414.57 | 937 | 916 | 190.4 |
| A | 1 | 161 | 78366 | 406.81 | 937 | 916 | 190.4 |
| B | 0 | 214 | 62498 | 343.3 | 942 | 918 | 179.4 |
| B | 4 | 80 | 27063 | 145.75 | 942 | 918 | 179.4 |
| B | 0 | 219 | 21191 | 113.02 | 942 | 918 | 179.4 |
| C | 4 | 254 | 822119 | 3973.68 | 894 | 898 | 206.7 |
| C | 14 | 234 | 58279 | 277.65 | 894 | 898 | 206.7 |
| C | 8 | 128 | 10863 | 48.22 | 894 | 898 | 206.7 |
| D | 1 | 52 | 228236 | 1030.07 | 905 | 875 | 220.7 |
| D | 8 | 195 | 185687 | 837.3 | 905 | 875 | 220.7 |
| D | 7 | 71 | 116619 | 524.38 | 905 | 875 | 220.7 |
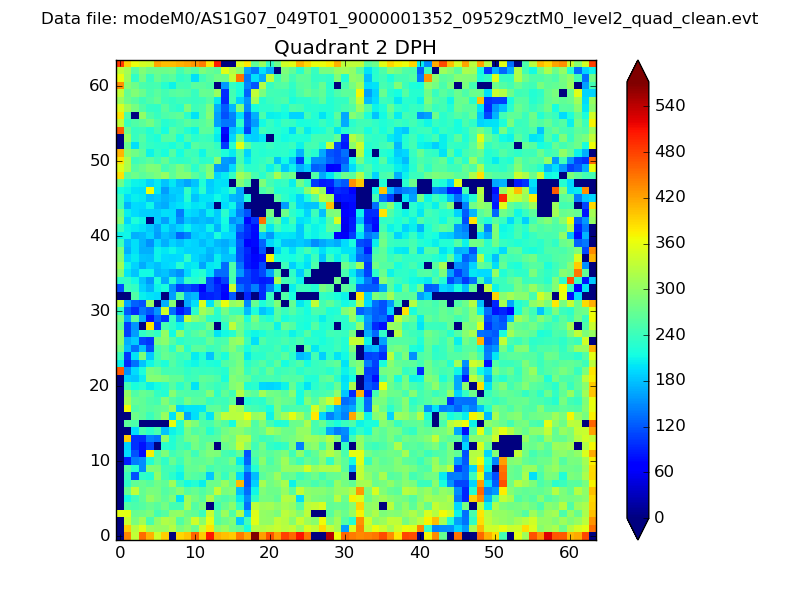
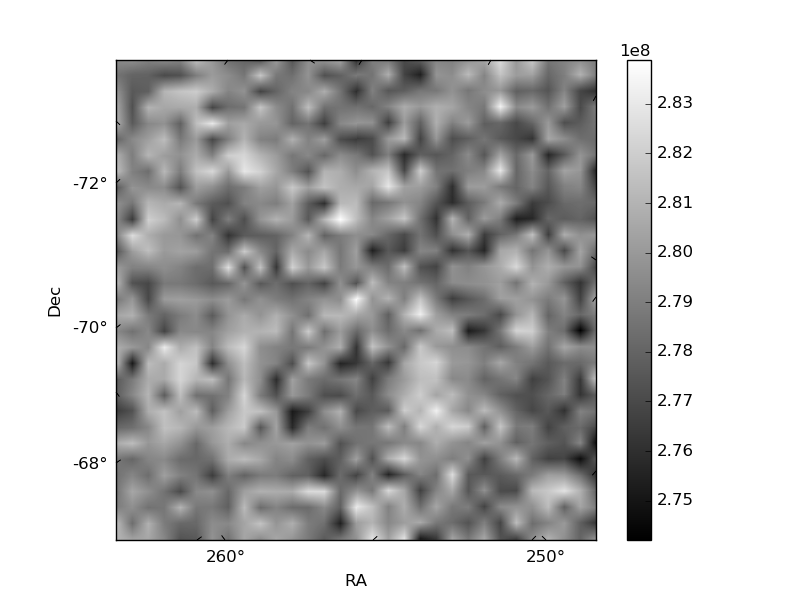
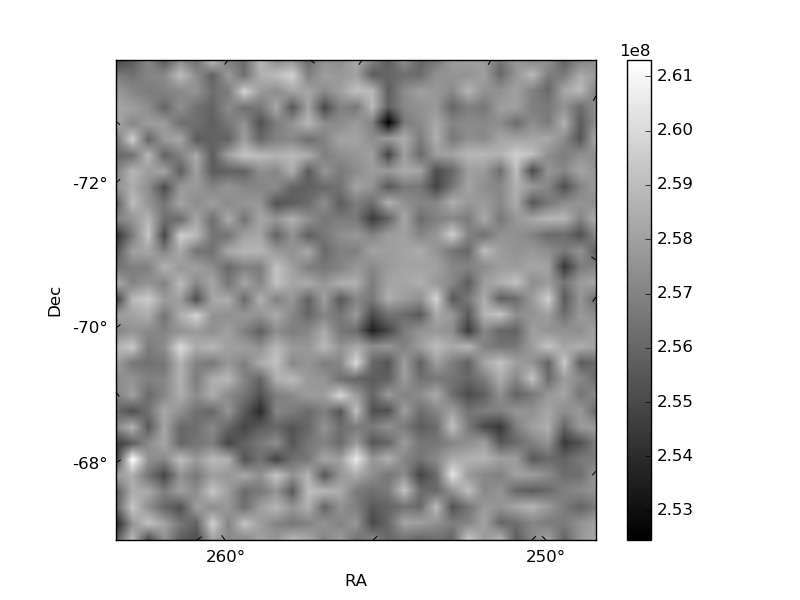
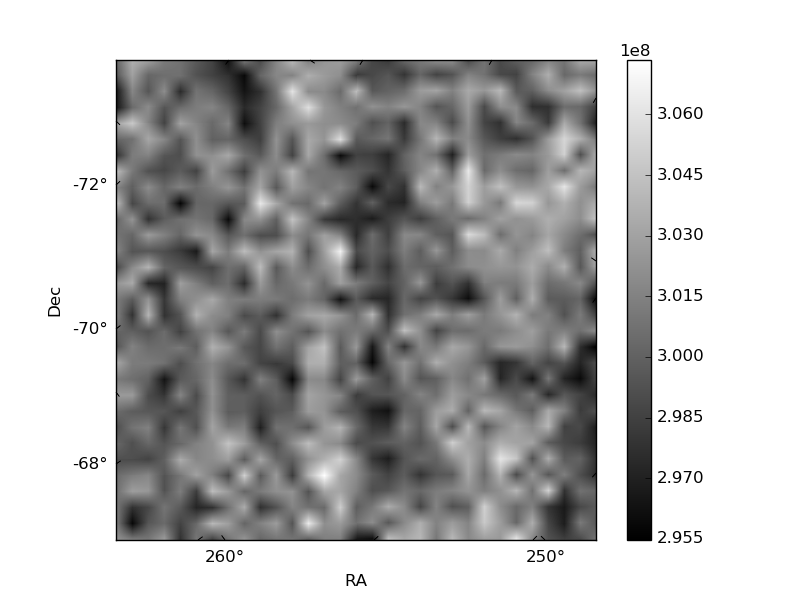
Histogram calculated using DETX and DETY for each event in the final _common_clean file
| Quadrant A |  |
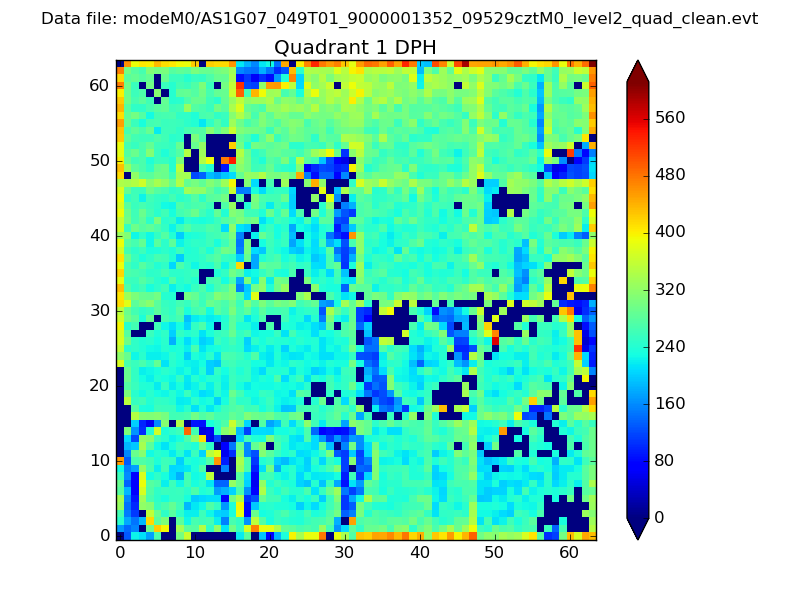 |
Quadrant B |
|---|---|---|---|
| Quadrant D |  |
 |
Quadrant C |
| Plot type | Count rate plots | Images |
|---|---|---|
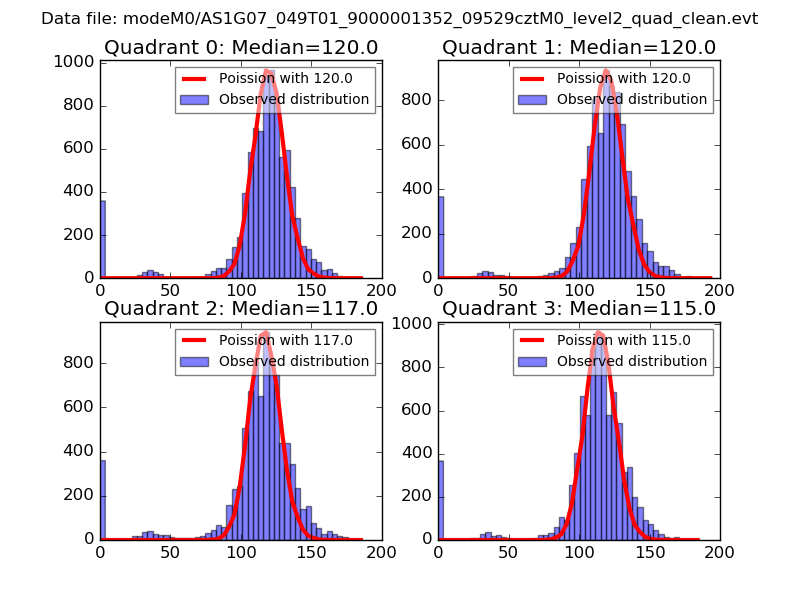
| Comparison with Poisson distribution Blue bars denote a histogram of data divided into 1 sec bins. Red curve is a Poisson curve with rate = median count rate of data. |
 |
 |
| Quadrant-wise count rates Data is divided into 100 sec bins |
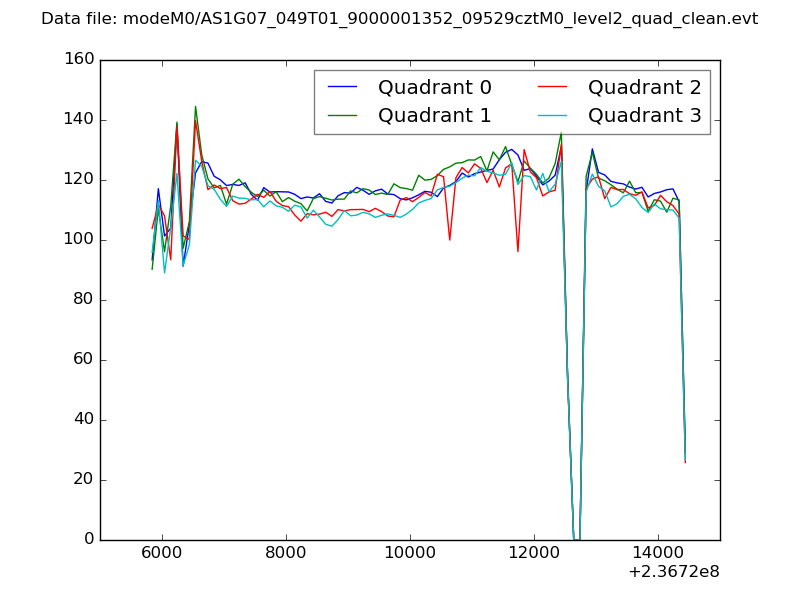 |
|
| Module-wise count rates for Quadrant A Data is divided into 100 sec bins |
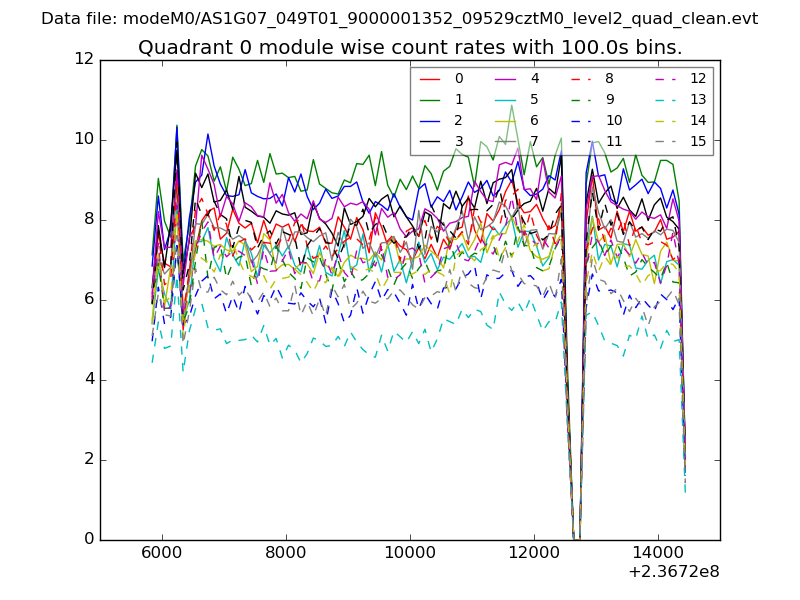 |
 |
| Module-wise count rates for Quadrant B Data is divided into 100 sec bins |
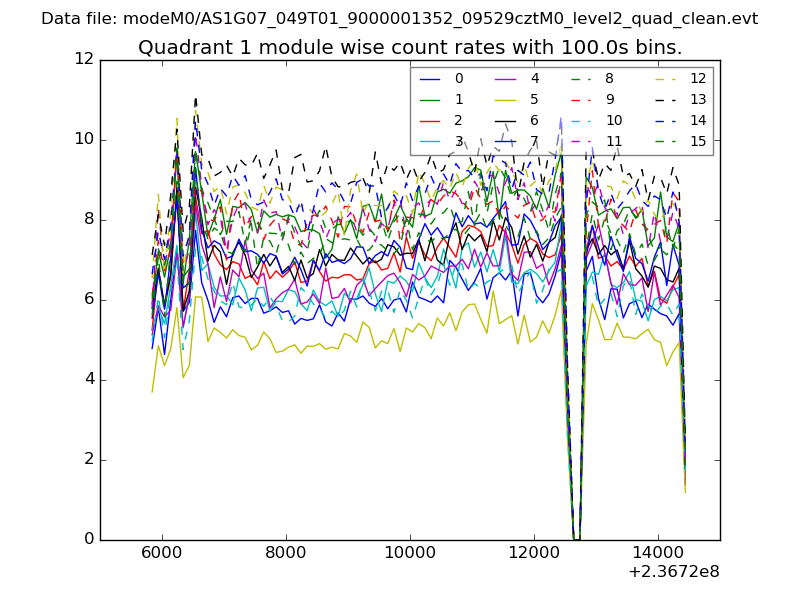 |
 |
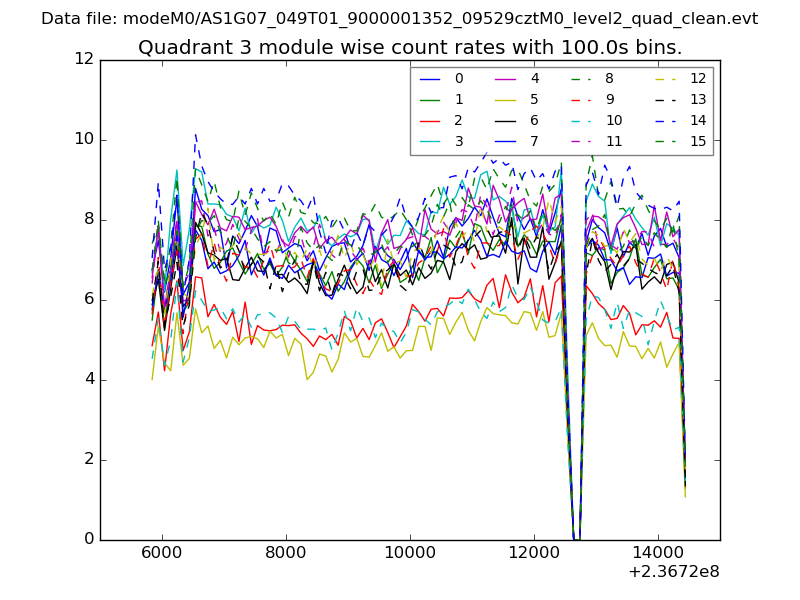
| Module-wise count rates for Quadrant C Data is divided into 100 sec bins |
 |
 |
| Module-wise count rates for Quadrant D Data is divided into 100 sec bins |
 |
 |
| Parameter | Plot |
|---|---|
| CZT HV Monitor | 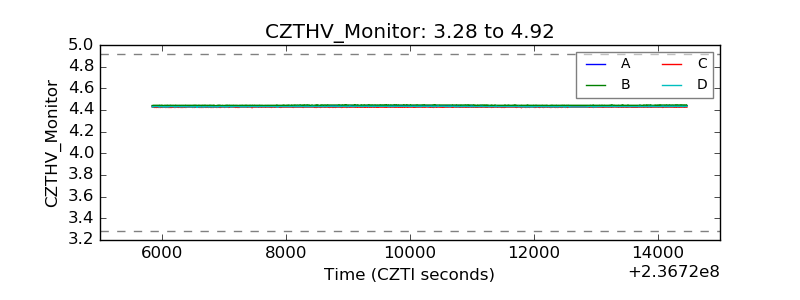 |
| D_VDD | 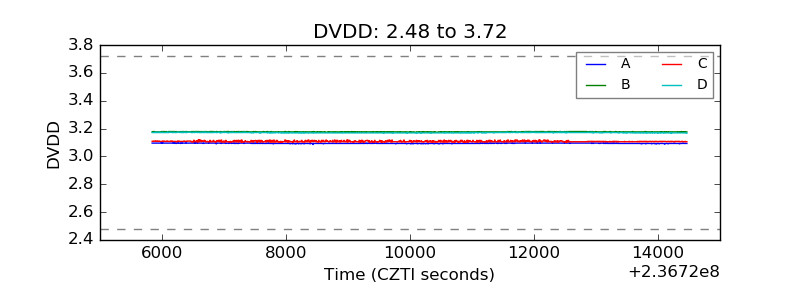 |
| Temperature 1 | 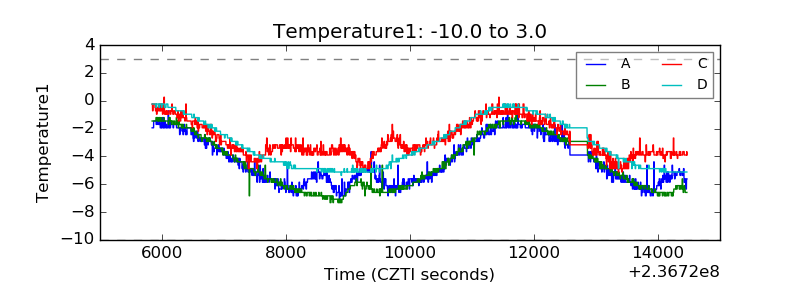 |
| Veto HV Monitor | 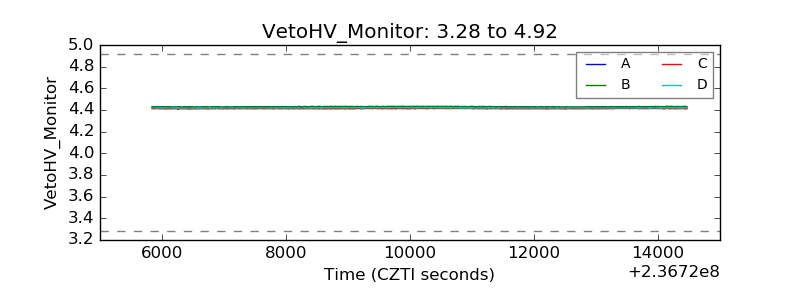 |
| Veto LLD | 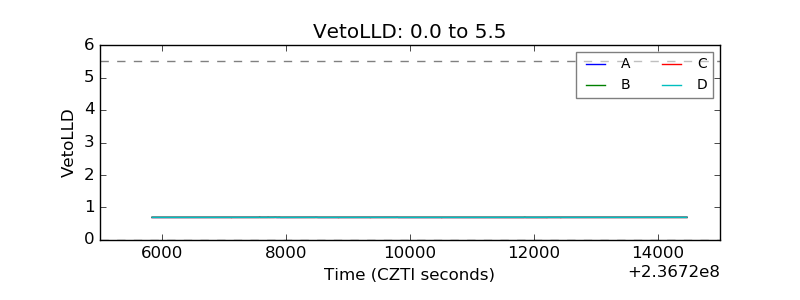 |
| Alpha Counter | 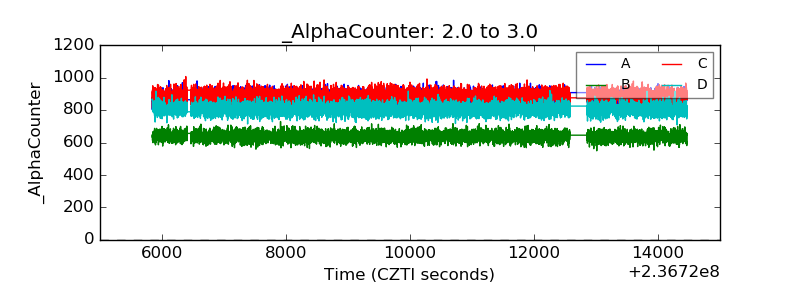 |
| _CPM_Rate | 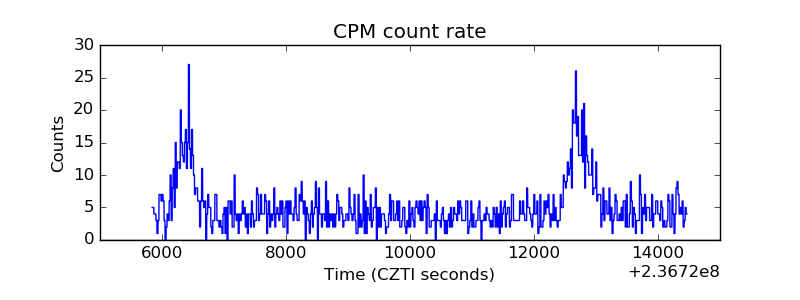 |
| CZT Counter | 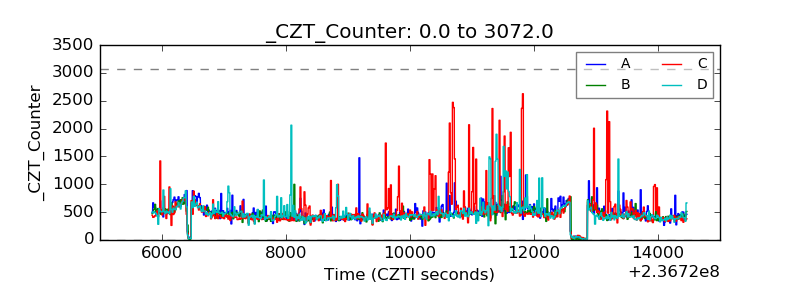 |
| +2.5 Volts monitor |  |
| +5 Volts monitor | 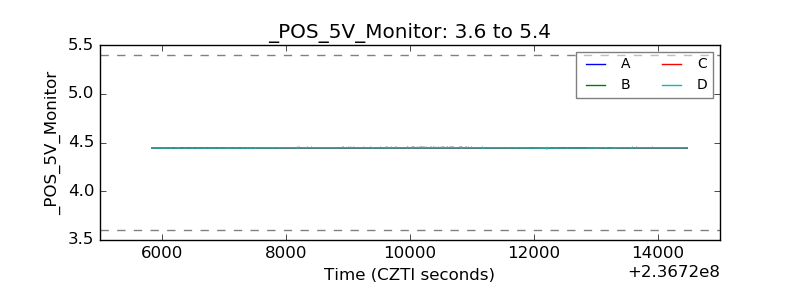 |
| _ROLL_ROT | 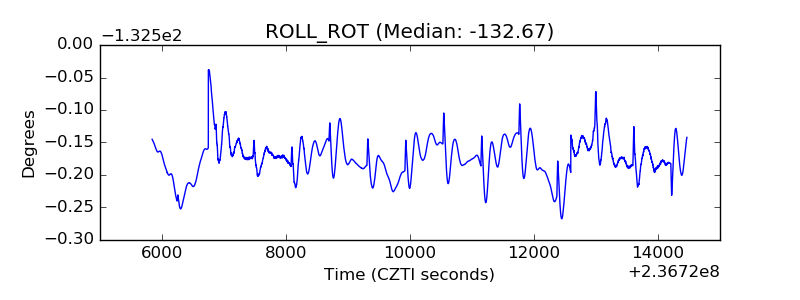 |
| _Roll_DEC | 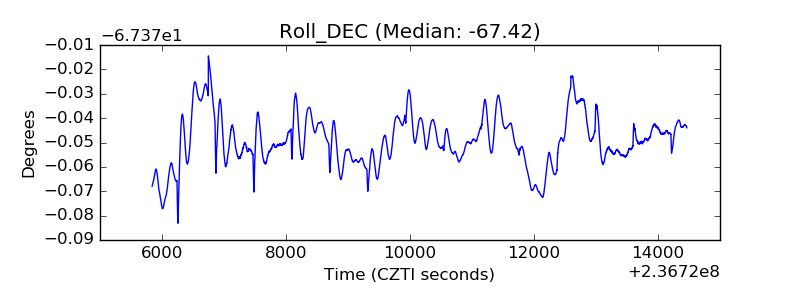 |
| _Roll_RA | 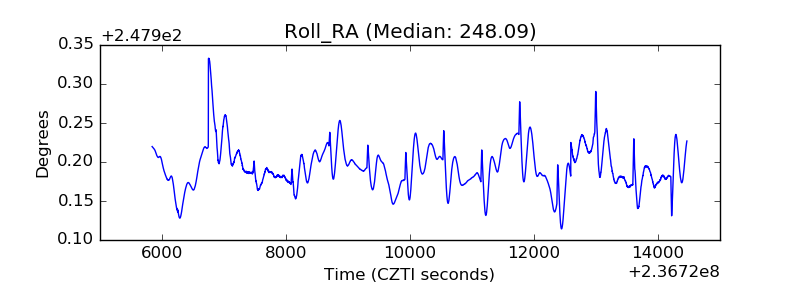 |
| Veto Counter | 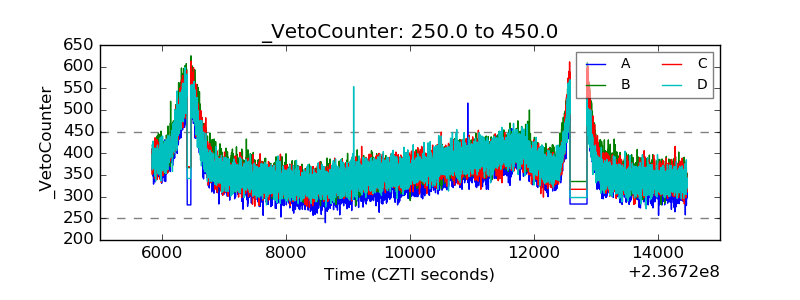 |