| Param | Original file | Final file |
|---|---|---|
| Filename | modeM0/AS1G07_049T01_9000001352_09533cztM0_level2.evt | modeM0/AS1G07_049T01_9000001352_09533cztM0_level2_quad_clean.evt |
| Size (bytes) | 457,712,640 | 123,019,200 |
| Size | 436.5 MB | 117.3 MB |
| Events in quadrant A | 3,442,722 | 823,226 |
| Events in quadrant B | 3,186,259 | 829,365 |
| Events in quadrant C | 3,290,694 | 815,502 |
| Events in quadrant D | 3,491,210 | 795,268 |
| Mode M9 | |||
|---|---|---|---|
| Quadrant | BADHDUFLAG | Total packets | Discarded packets |
| A | 0 | 15 | 0 |
| B | 0 | 15 | 0 |
| C | 0 | 15 | 0 |
| D | 0 | 16 | 0 |
| Mode M0 | |||
|---|---|---|---|
| Quadrant | BADHDUFLAG | Total packets | Discarded packets |
| A | 0 | 14615 | 63 |
| B | 0 | 13768 | 38 |
| C | 0 | 14403 | 62 |
| D | 0 | 14925 | 85 |
| Mode SS | |||
|---|---|---|---|
| Quadrant | BADHDUFLAG | Total packets | Discarded packets |
| A | 0 | 134 | 0 |
| B | 0 | 134 | 0 |
| C | 0 | 134 | 6 |
| D | 0 | 134 | 0 |
| Quadrant | Total seconds | Saturated seconds | Saturation percentage |
|---|---|---|---|
| A | 6641 | 66 | 0.993826% |
| B | 6651 | 68 | 1.022403% |
| C | 6641 | 113 | 1.701551% |
| D | 6638 | 84 | 1.265441% |
Noise dominated data is calculated using 1-second bins in cleaned event files. If a bin has >2000 counts, and if more than 50% of those come from <1% of pixels, then it is considered to be noise-dominated and hence unusable.
| Quadrant | # 1 sec bins | Bins with >0 counts | Bins with >2000 counts | High rate bins dominated by noise | Noise dominated (total time) | Noise dominated (detector-on time) | Marked lightcurve |
|---|---|---|---|---|---|---|---|
| A | 7639 | 6670 | 1 | 1 | 0.01% | 0.01% | 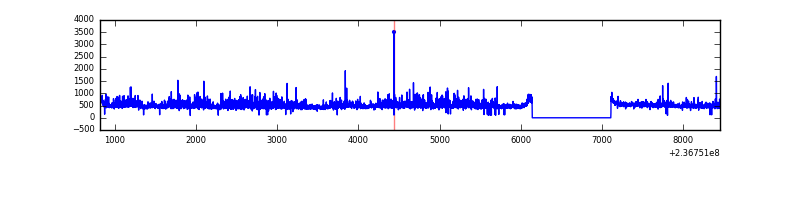 |
| B | 7639 | 6670 | 9 | 9 | 0.12% | 0.13% | 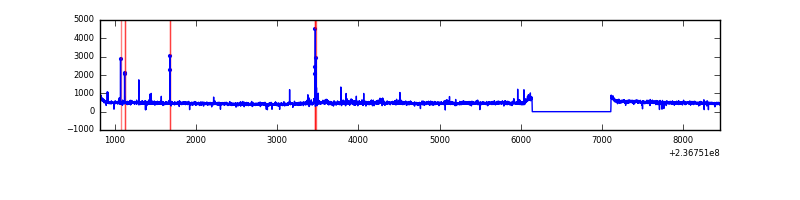 |
| C | 7639 | 6666 | 38 | 38 | 0.50% | 0.57% | 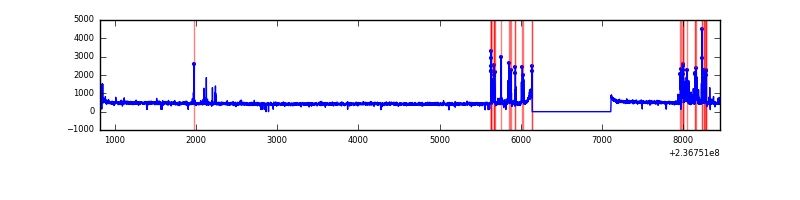 |
| D | 7639 | 6668 | 29 | 29 | 0.38% | 0.43% | 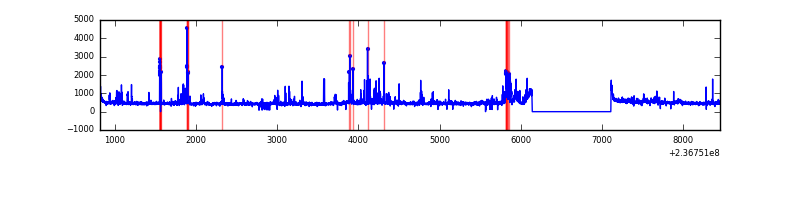 |
Top three noisy pixels from each quadrant. If the there are fewer than three noisy pixels in the level2.evt file, extra rows are filled as -1
| Pixel properties | Quadrant properties | ||||||
|---|---|---|---|---|---|---|---|
| Quadrant | DetID | PixID | Counts | Sigma | Mean | Median | Sigma |
| A | 1 | 162 | 199667 | 1254.52 | 776 | 760 | 158.6 |
| A | 1 | 178 | 91423 | 571.82 | 776 | 760 | 158.6 |
| A | 1 | 161 | 86911 | 543.36 | 776 | 760 | 158.6 |
| B | 0 | 214 | 74608 | 499.95 | 779 | 759 | 147.7 |
| B | 0 | 187 | 24203 | 158.71 | 779 | 759 | 147.7 |
| B | 4 | 80 | 18335 | 118.99 | 779 | 759 | 147.7 |
| C | 4 | 254 | 284291 | 1613.31 | 758 | 761 | 175.7 |
| C | 14 | 234 | 25133 | 138.68 | 758 | 761 | 175.7 |
| C | 8 | 128 | 11754 | 62.55 | 758 | 761 | 175.7 |
| D | 1 | 52 | 299940 | 1617.59 | 750 | 727 | 185.0 |
| D | 8 | 195 | 102350 | 549.39 | 750 | 727 | 185.0 |
| D | 13 | 104 | 86463 | 463.5 | 750 | 727 | 185.0 |
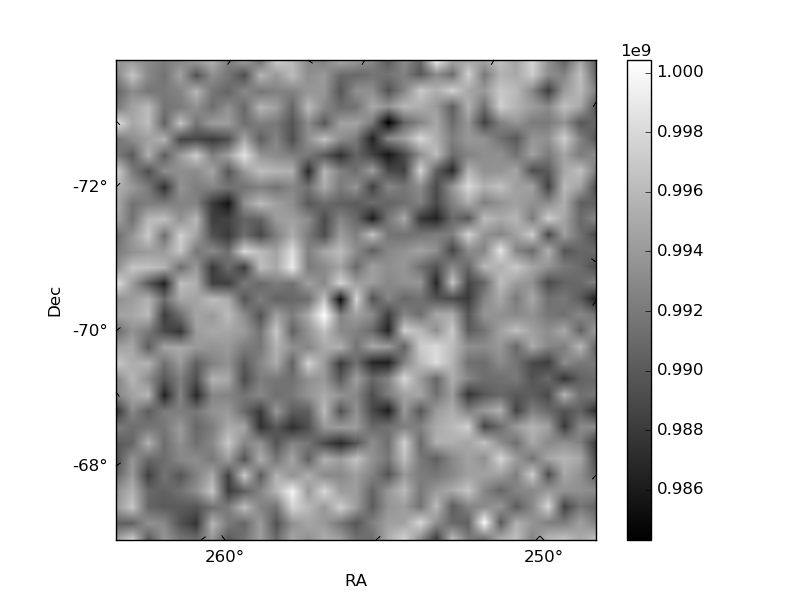
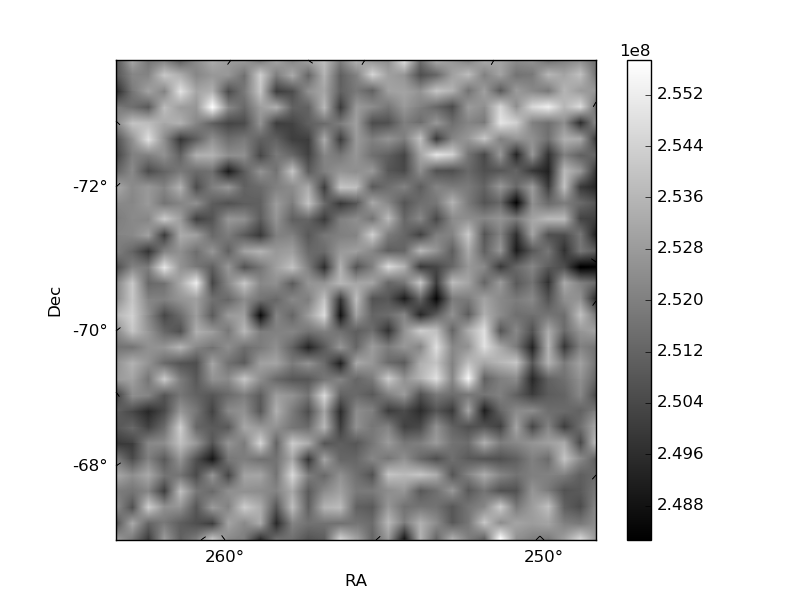
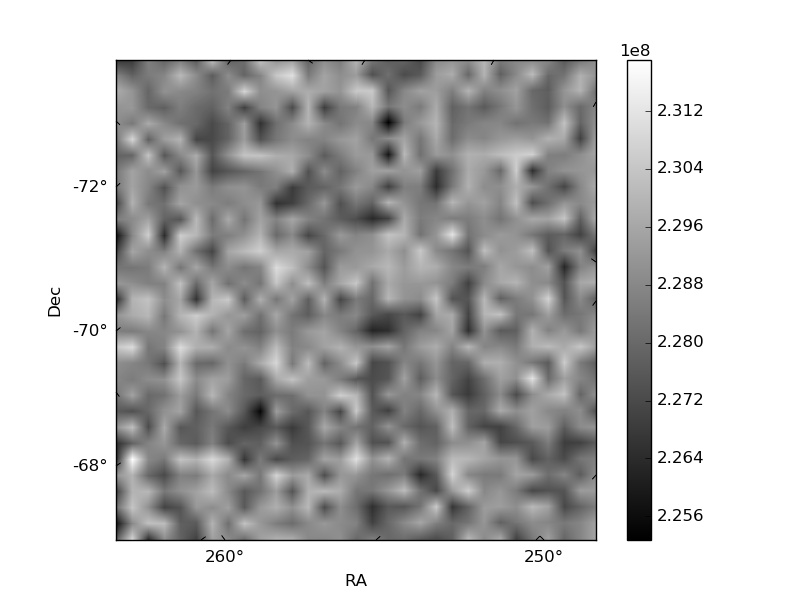
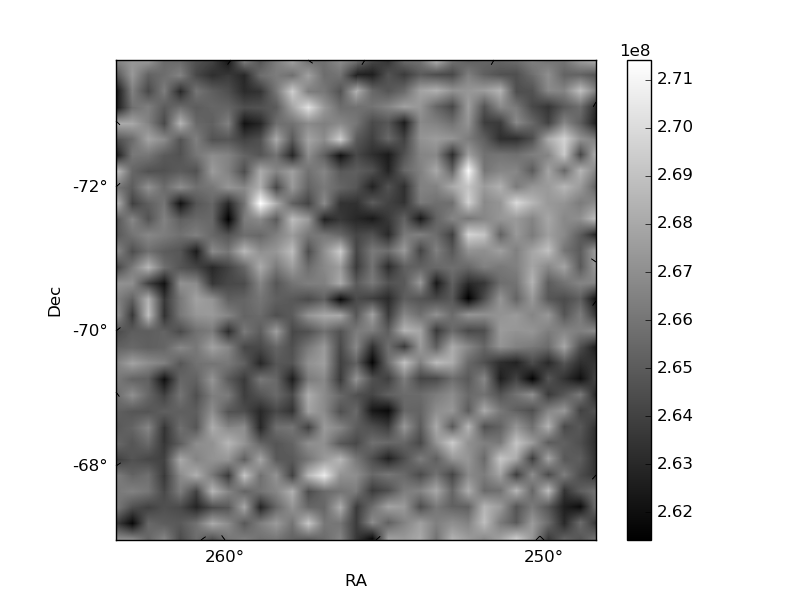
Histogram calculated using DETX and DETY for each event in the final _common_clean file
| Quadrant A | 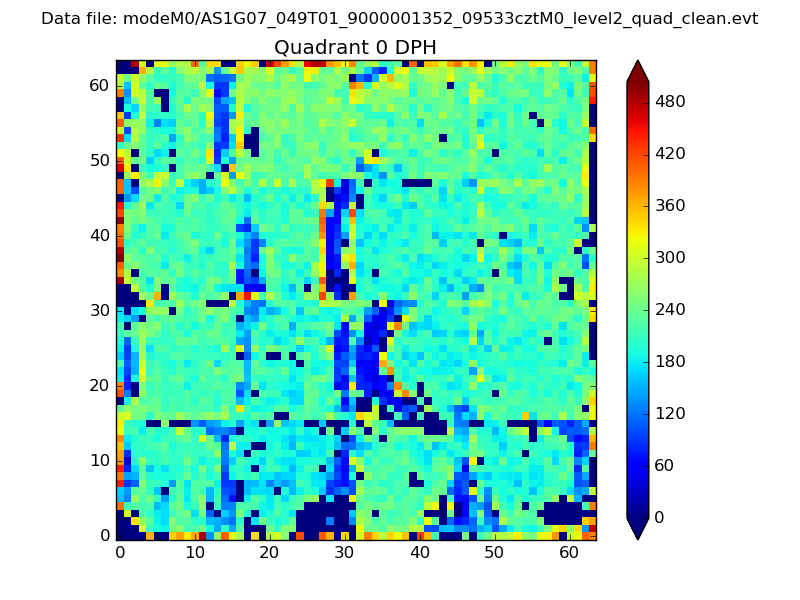 |
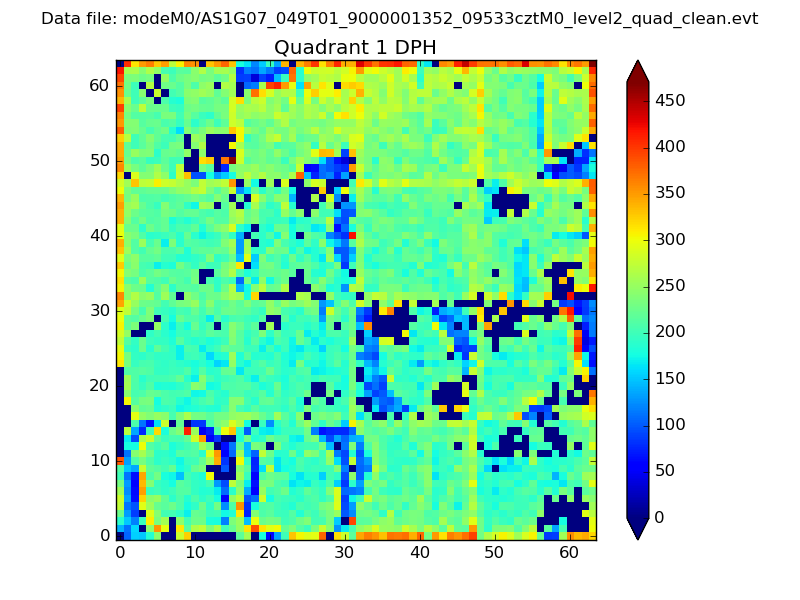 |
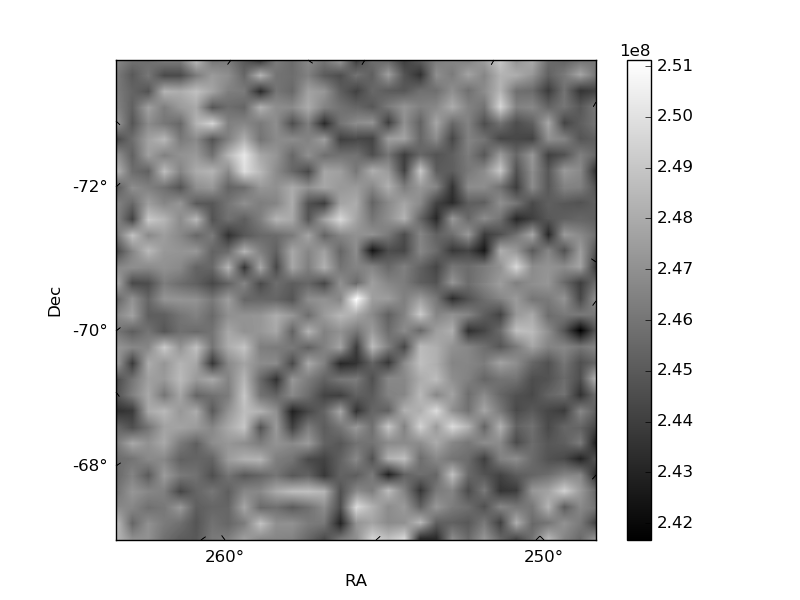
Quadrant B |
|---|---|---|---|
| Quadrant D | 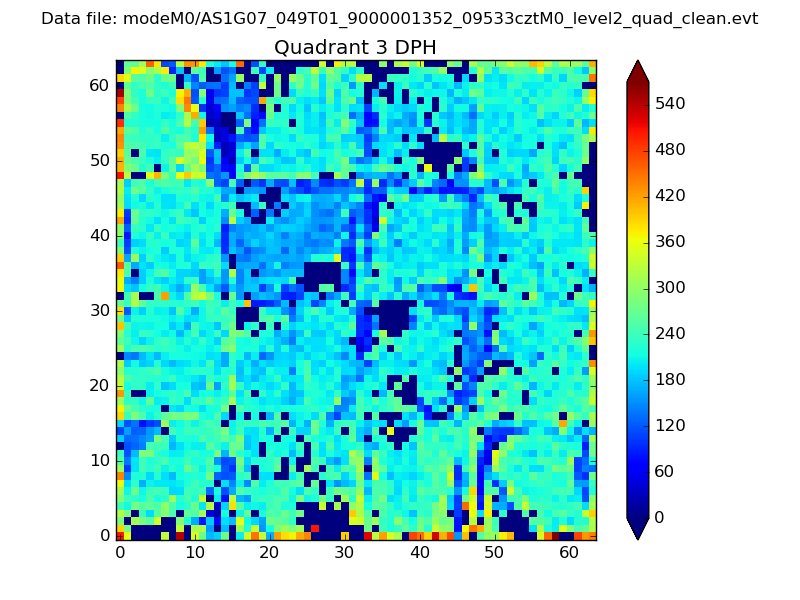 |
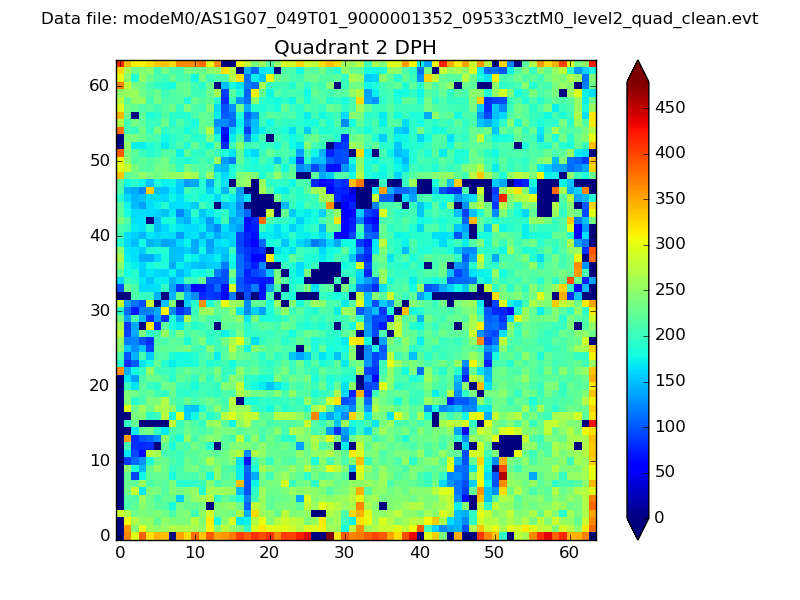 |
Quadrant C |
| Plot type | Count rate plots | Images |
|---|---|---|
| Comparison with Poisson distribution Blue bars denote a histogram of data divided into 1 sec bins. Red curve is a Poisson curve with rate = median count rate of data. |
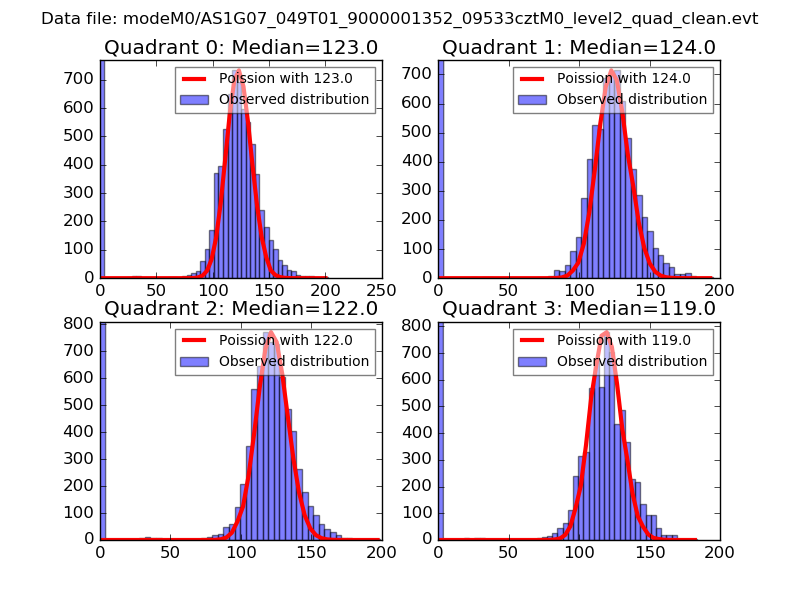 |
 |
| Quadrant-wise count rates Data is divided into 100 sec bins |
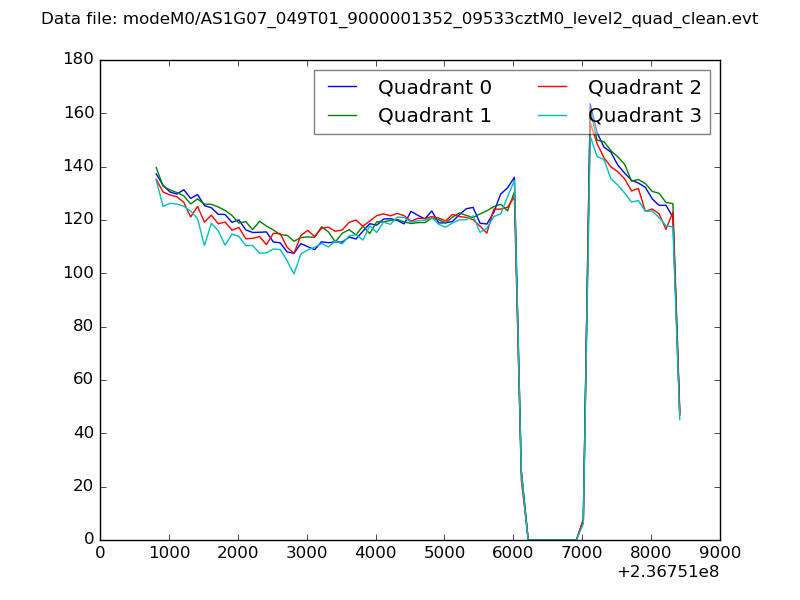 |
|
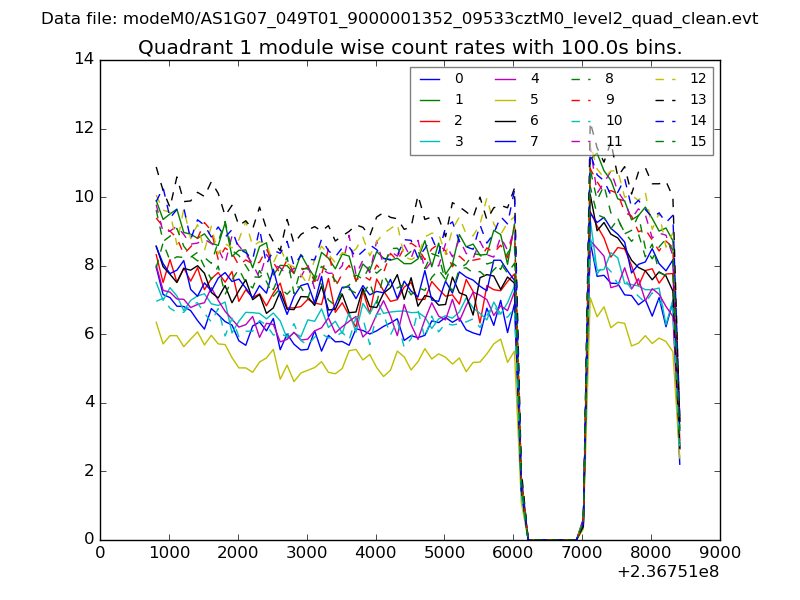
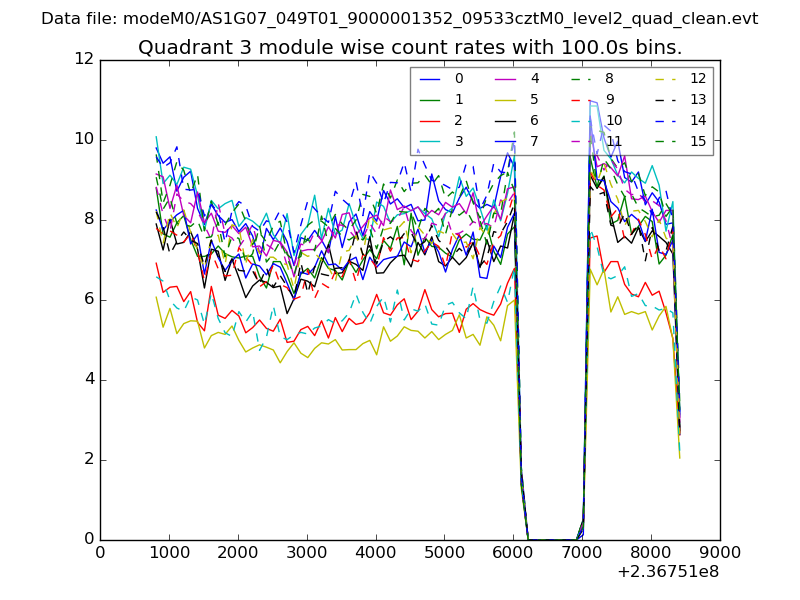
| Module-wise count rates for Quadrant A Data is divided into 100 sec bins |
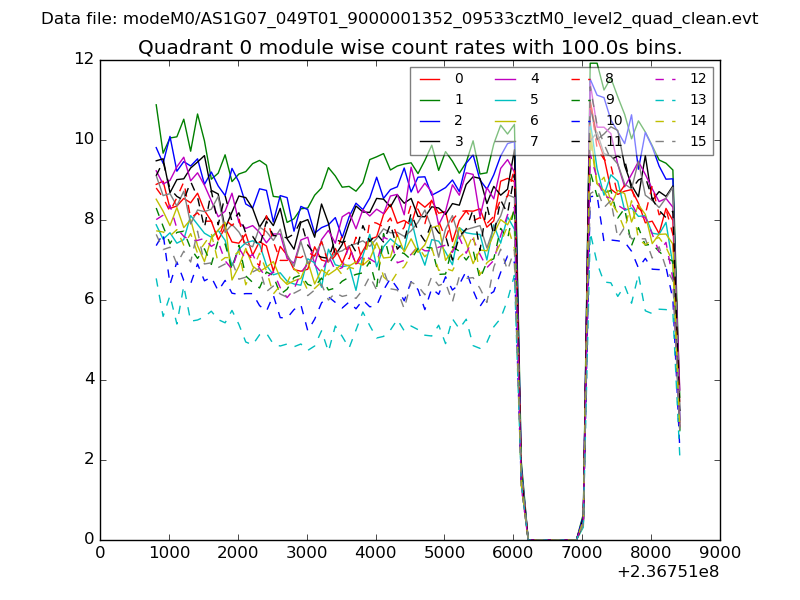 |
 |
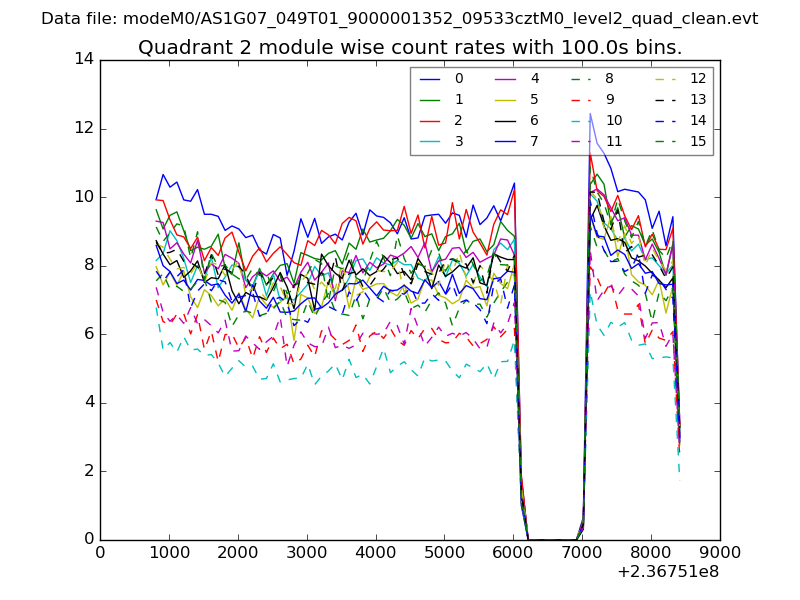
| Module-wise count rates for Quadrant B Data is divided into 100 sec bins |
 |
 |
| Module-wise count rates for Quadrant C Data is divided into 100 sec bins |
 |
 |
| Module-wise count rates for Quadrant D Data is divided into 100 sec bins |
 |
 |
| Parameter | Plot |
|---|---|
| CZT HV Monitor | 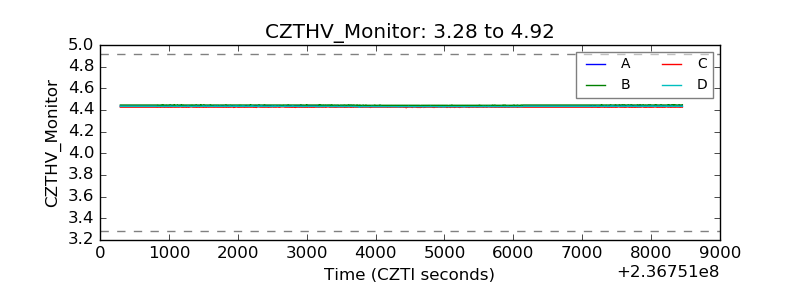 |
| D_VDD | 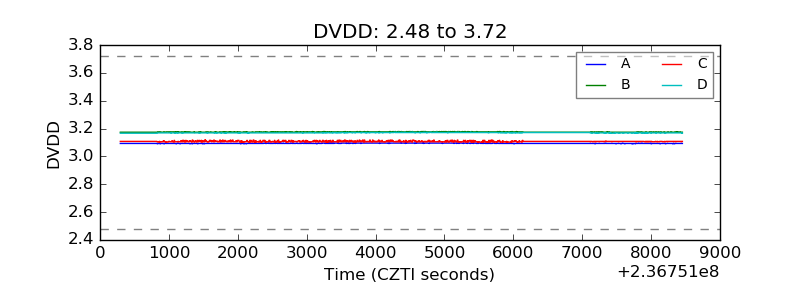 |
| Temperature 1 | 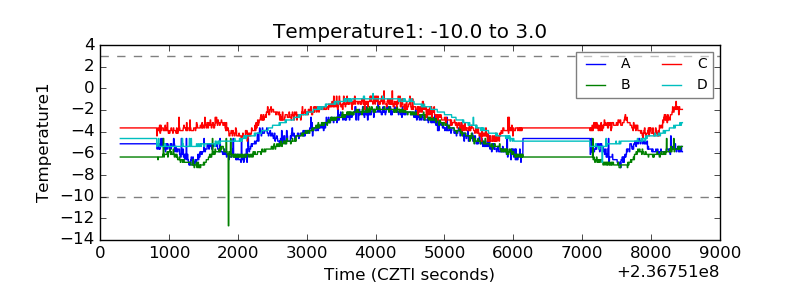 |
| Veto HV Monitor | 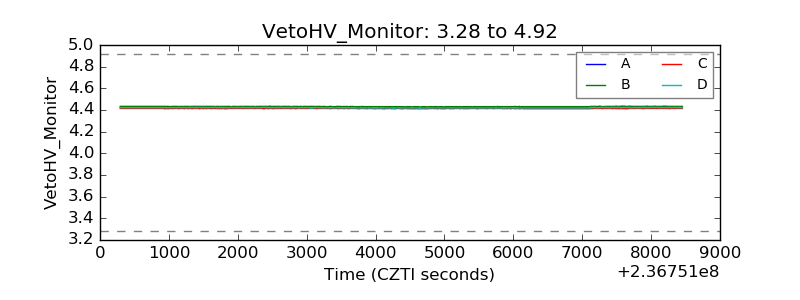 |
| Veto LLD | 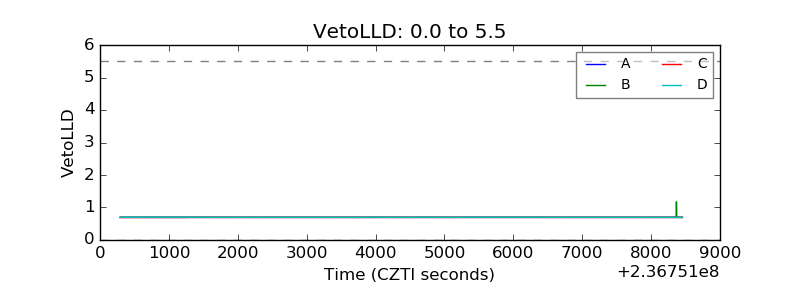 |
| Alpha Counter | 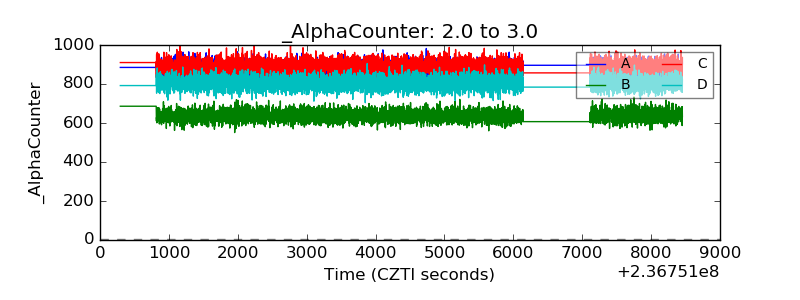 |
| _CPM_Rate | 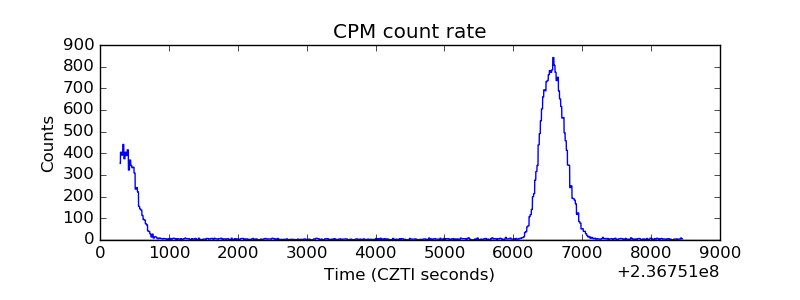 |
| CZT Counter | 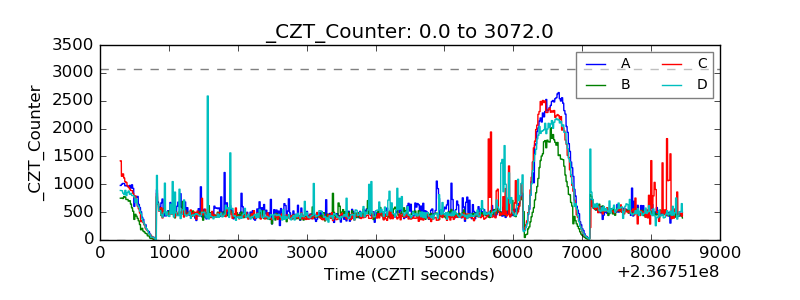 |
| +2.5 Volts monitor |  |
| +5 Volts monitor |  |
| _ROLL_ROT | 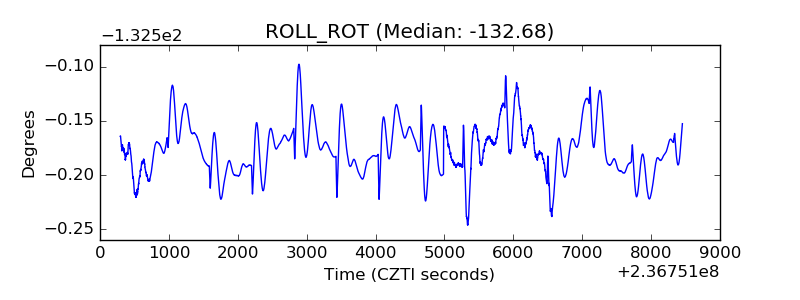 |
| _Roll_DEC | 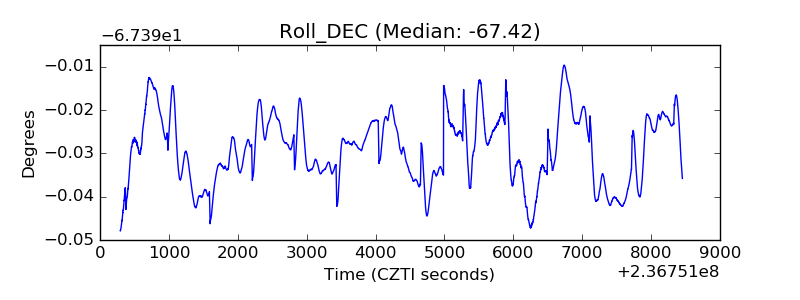 |
| _Roll_RA | 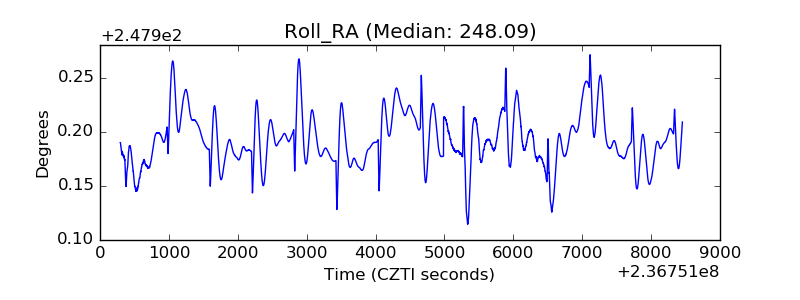 |
| Veto Counter |  |