| Param | Original file | Final file |
|---|---|---|
| Filename | modeM0/AS1G07_049T01_9000001352_09535cztM0_level2.evt | modeM0/AS1G07_049T01_9000001352_09535cztM0_level2_quad_clean.evt |
| Size (bytes) | 478,946,880 | 126,296,640 |
| Size | 456.8 MB | 120.4 MB |
| Events in quadrant A | 3,611,413 | 849,770 |
| Events in quadrant B | 3,180,500 | 859,960 |
| Events in quadrant C | 3,415,250 | 844,359 |
| Events in quadrant D | 3,856,125 | 817,728 |
| Mode M9 | |||
|---|---|---|---|
| Quadrant | BADHDUFLAG | Total packets | Discarded packets |
| A | 0 | 14 | 0 |
| B | 0 | 14 | 0 |
| C | 0 | 14 | 0 |
| D | 0 | 15 | 0 |
| Mode M0 | |||
|---|---|---|---|
| Quadrant | BADHDUFLAG | Total packets | Discarded packets |
| A | 0 | 15019 | 24 |
| B | 0 | 13644 | 17 |
| C | 0 | 14577 | 48 |
| D | 0 | 15803 | 9 |
| Mode SS | |||
|---|---|---|---|
| Quadrant | BADHDUFLAG | Total packets | Discarded packets |
| A | 0 | 130 | 0 |
| B | 0 | 130 | 0 |
| C | 0 | 130 | 0 |
| D | 0 | 130 | 0 |
| Quadrant | Total seconds | Saturated seconds | Saturation percentage |
|---|---|---|---|
| A | 6509 | 98 | 1.505608% |
| B | 6511 | 64 | 0.982952% |
| C | 6501 | 124 | 1.907399% |
| D | 6515 | 211 | 3.238680% |
Noise dominated data is calculated using 1-second bins in cleaned event files. If a bin has >2000 counts, and if more than 50% of those come from <1% of pixels, then it is considered to be noise-dominated and hence unusable.
| Quadrant | # 1 sec bins | Bins with >0 counts | Bins with >2000 counts | High rate bins dominated by noise | Noise dominated (total time) | Noise dominated (detector-on time) | Marked lightcurve |
|---|---|---|---|---|---|---|---|
| A | 7628 | 6519 | 2 | 2 | 0.03% | 0.03% | 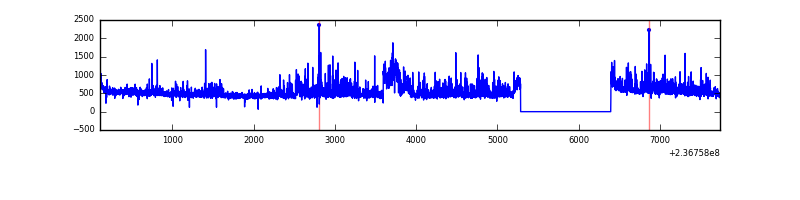 |
| B | 7628 | 6519 | 8 | 8 | 0.10% | 0.12% | 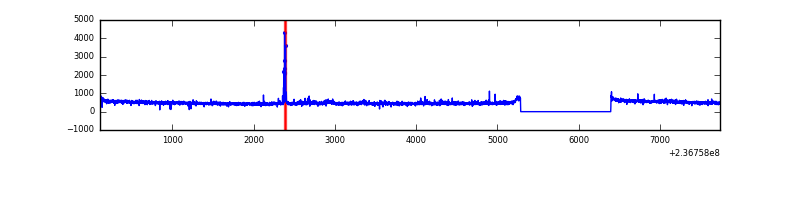 |
| C | 7628 | 6517 | 43 | 43 | 0.56% | 0.66% | 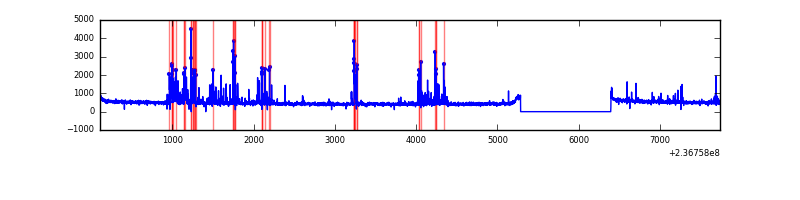 |
| D | 7628 | 6519 | 150 | 150 | 1.97% | 2.30% | 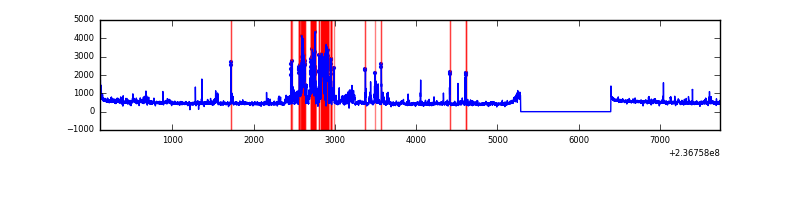 |
Top three noisy pixels from each quadrant. If the there are fewer than three noisy pixels in the level2.evt file, extra rows are filled as -1
| Pixel properties | Quadrant properties | ||||||
|---|---|---|---|---|---|---|---|
| Quadrant | DetID | PixID | Counts | Sigma | Mean | Median | Sigma |
| A | 1 | 162 | 192894 | 1223.74 | 785 | 770 | 157.0 |
| A | 15 | 223 | 127359 | 806.31 | 785 | 770 | 157.0 |
| A | 1 | 178 | 91555 | 578.25 | 785 | 770 | 157.0 |
| B | 0 | 214 | 70543 | 477.16 | 784 | 765 | 146.2 |
| B | 0 | 219 | 40196 | 269.64 | 784 | 765 | 146.2 |
| B | 12 | 111 | 15837 | 103.06 | 784 | 765 | 146.2 |
| C | 4 | 254 | 375668 | 2142.55 | 766 | 768 | 175.0 |
| C | 14 | 234 | 45617 | 256.31 | 766 | 768 | 175.0 |
| C | 13 | 61 | 5879 | 29.21 | 766 | 768 | 175.0 |
| D | 1 | 52 | 782352 | 4314.83 | 757 | 738 | 181.1 |
| D | 8 | 195 | 82609 | 451.96 | 757 | 738 | 181.1 |
| D | 12 | 233 | 37875 | 205.01 | 757 | 738 | 181.1 |
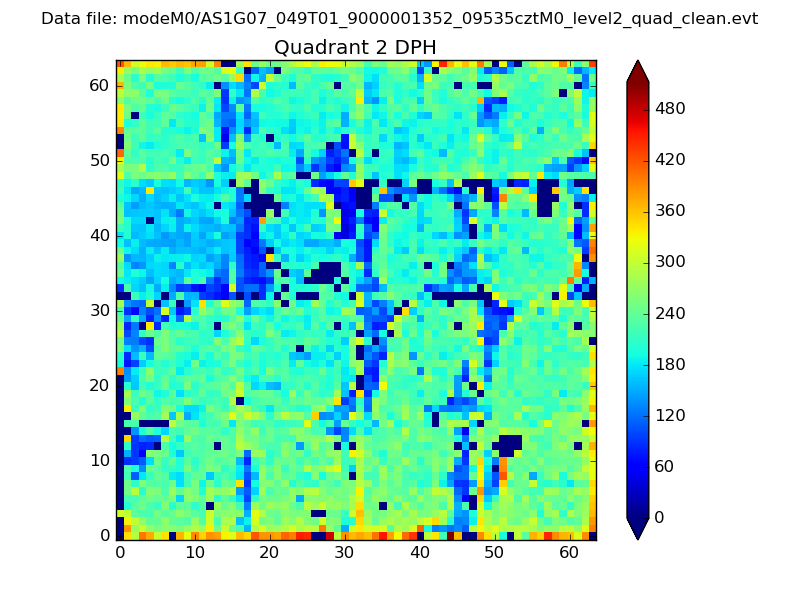
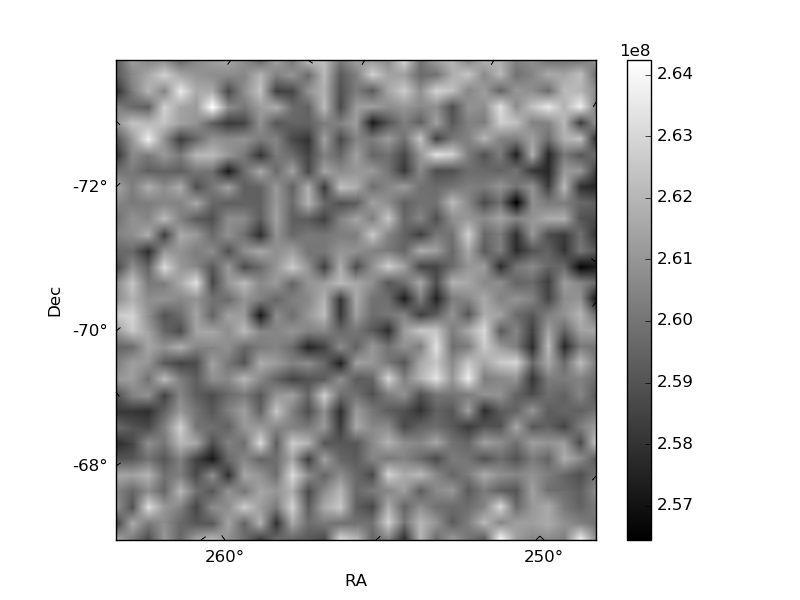
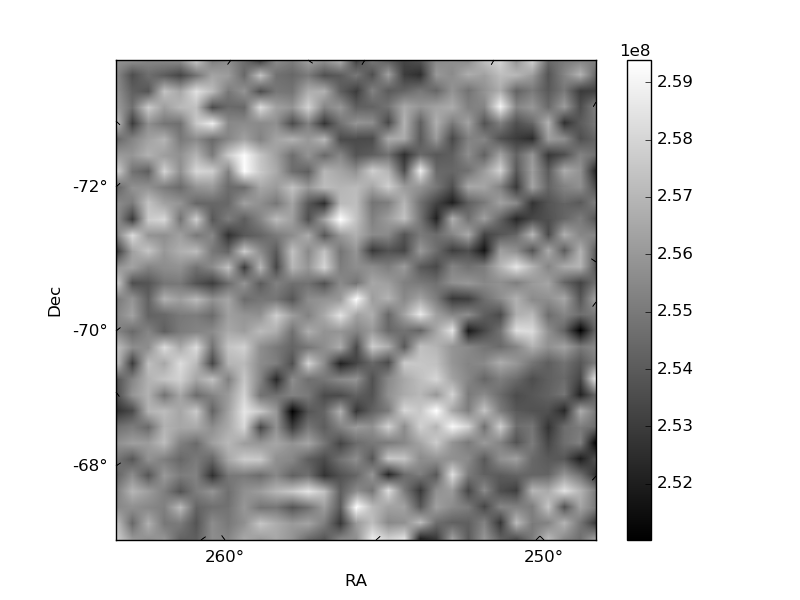
Histogram calculated using DETX and DETY for each event in the final _common_clean file
| Quadrant A | 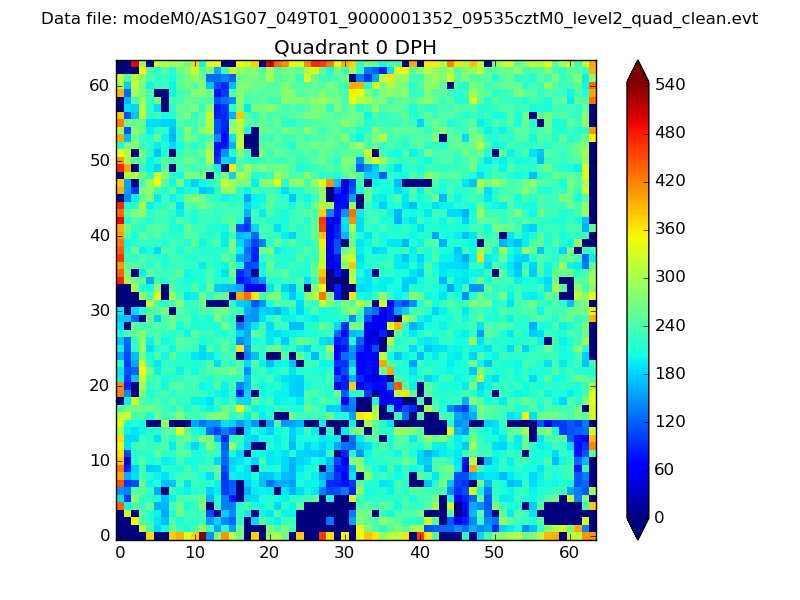 |
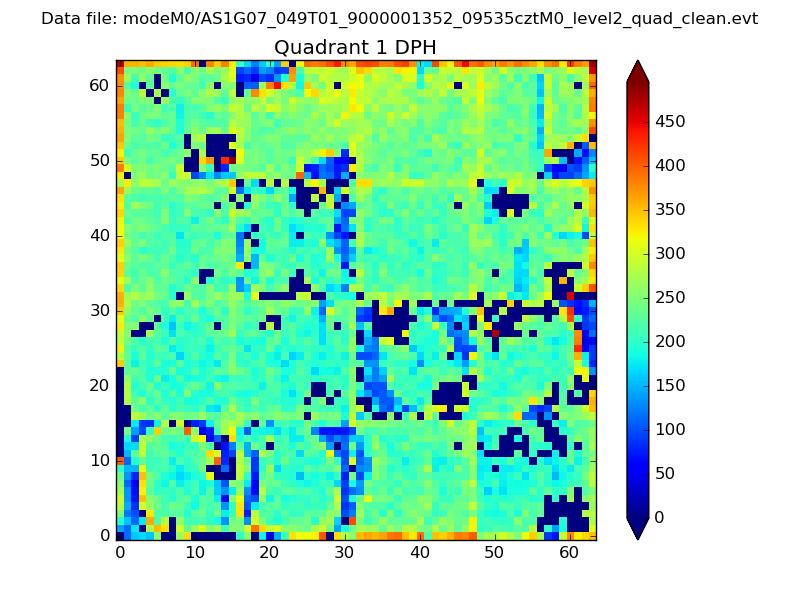 |
Quadrant B |
|---|---|---|---|
| Quadrant D | 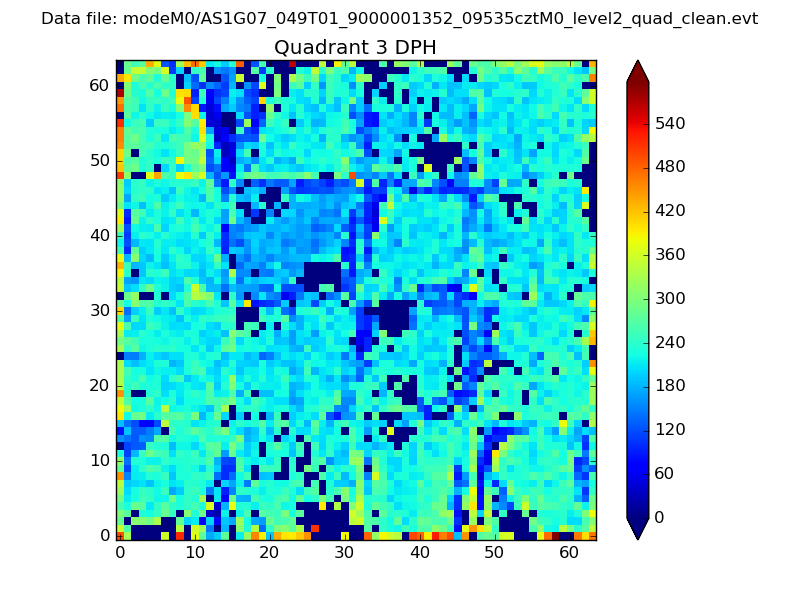 |
 |
Quadrant C |
| Plot type | Count rate plots | Images |
|---|---|---|
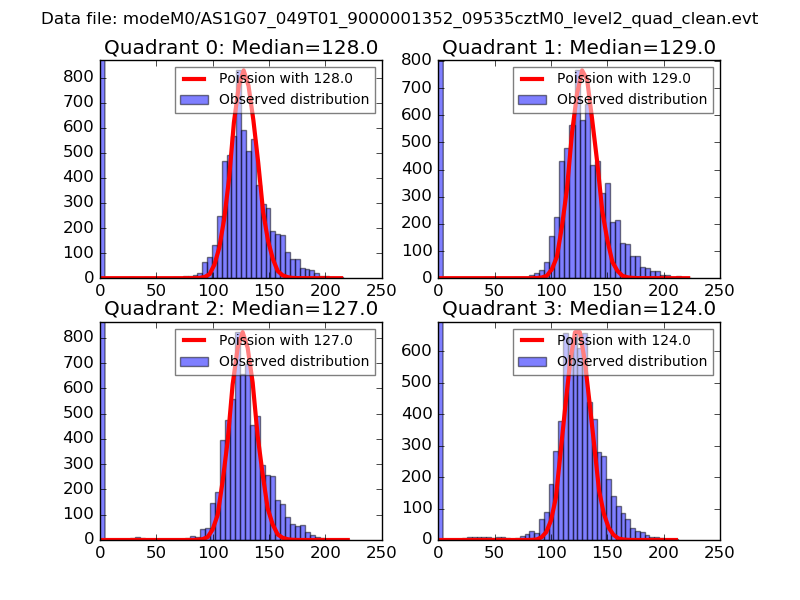
| Comparison with Poisson distribution Blue bars denote a histogram of data divided into 1 sec bins. Red curve is a Poisson curve with rate = median count rate of data. |
 |
 |
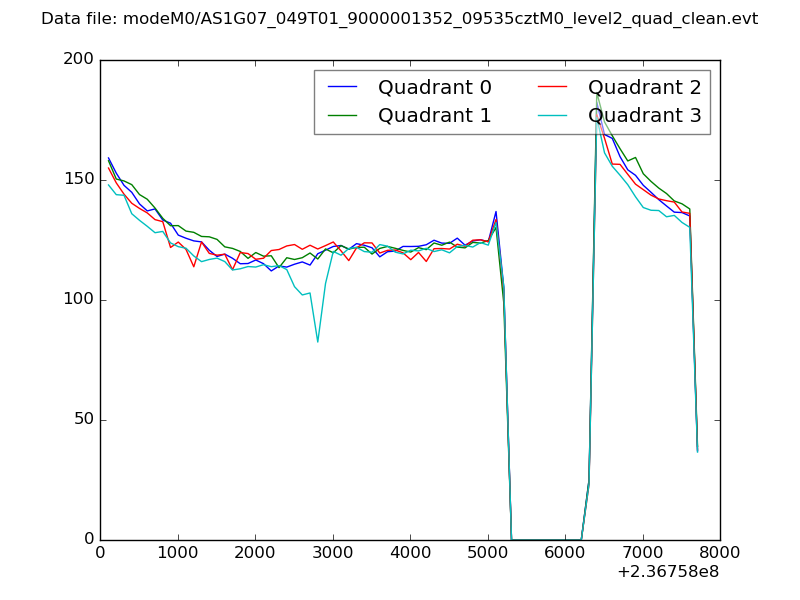
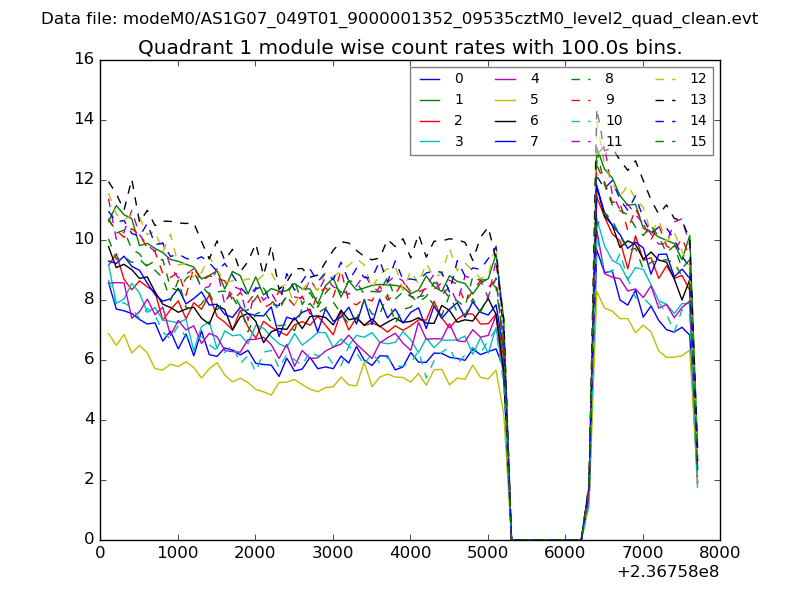
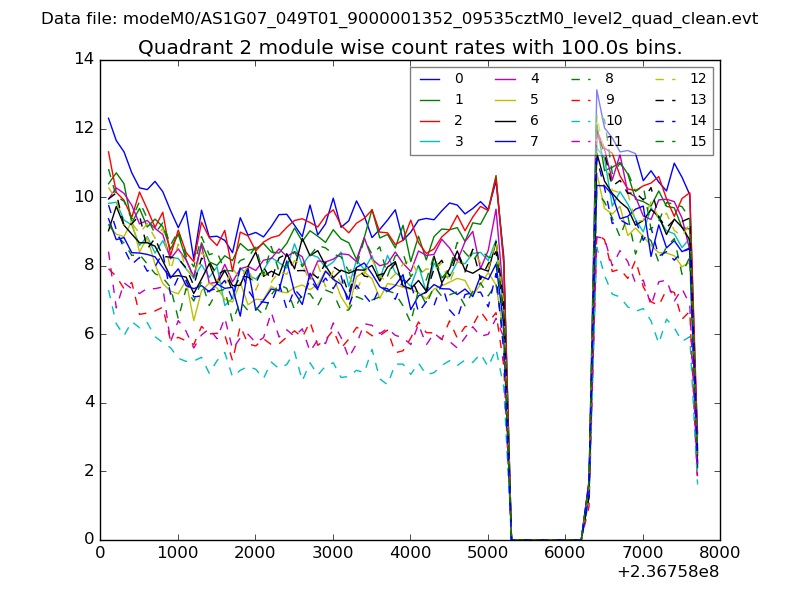
| Quadrant-wise count rates Data is divided into 100 sec bins |
 |
|
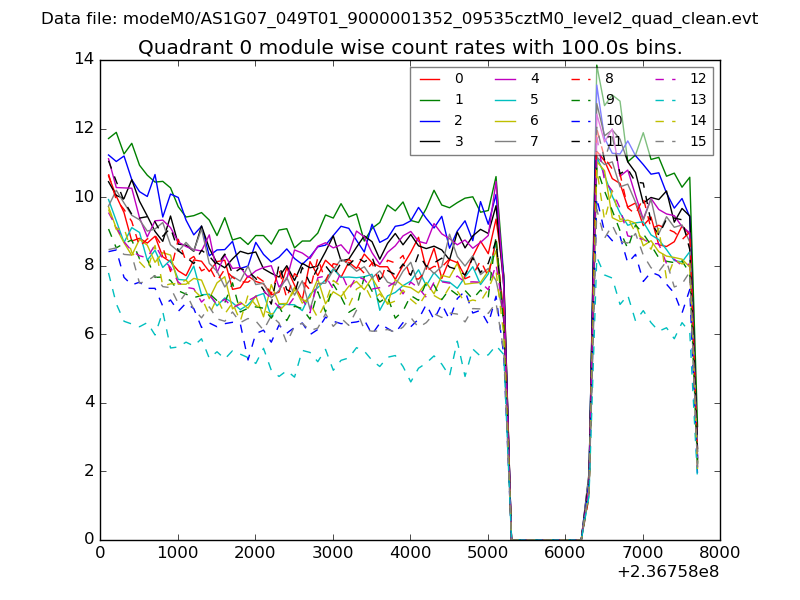
| Module-wise count rates for Quadrant A Data is divided into 100 sec bins |
 |
 |
| Module-wise count rates for Quadrant B Data is divided into 100 sec bins |
 |
 |
| Module-wise count rates for Quadrant C Data is divided into 100 sec bins |
 |
 |
| Module-wise count rates for Quadrant D Data is divided into 100 sec bins |
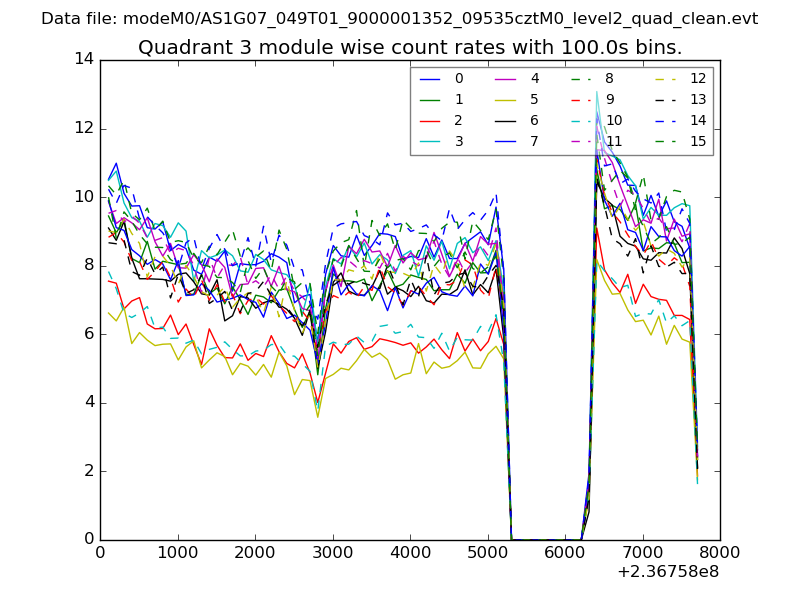 |
 |
| Parameter | Plot |
|---|---|
| CZT HV Monitor | 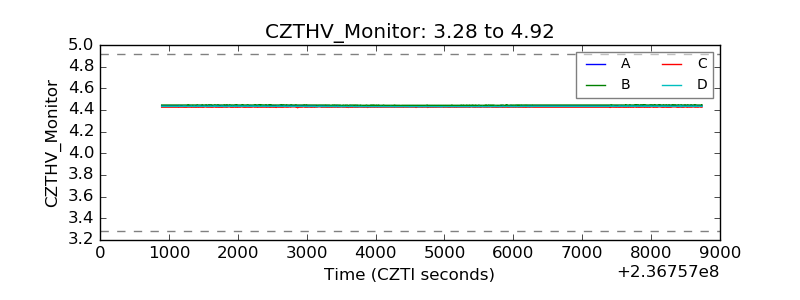 |
| D_VDD | 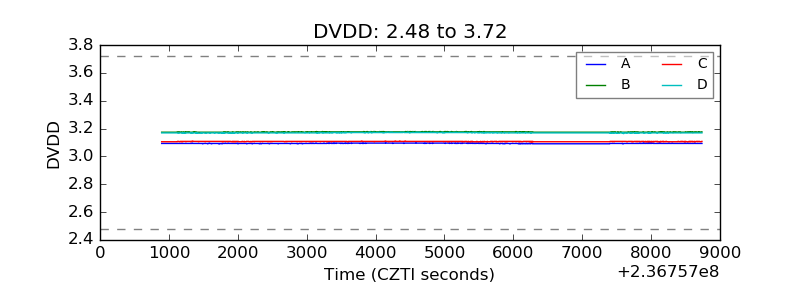 |
| Temperature 1 | 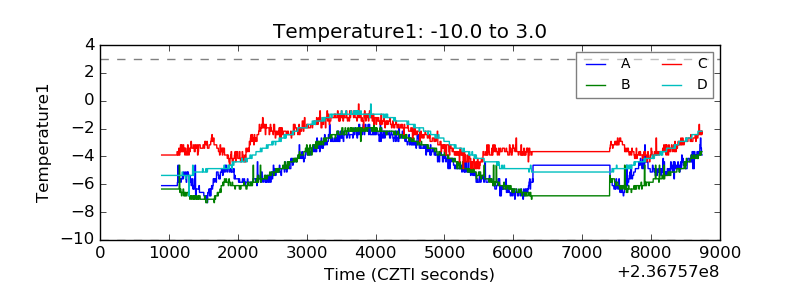 |
| Veto HV Monitor | 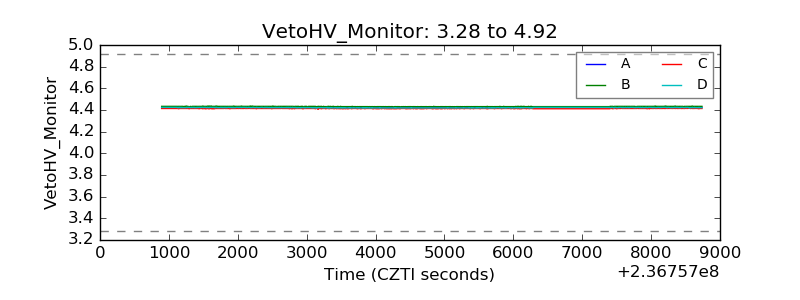 |
| Veto LLD | 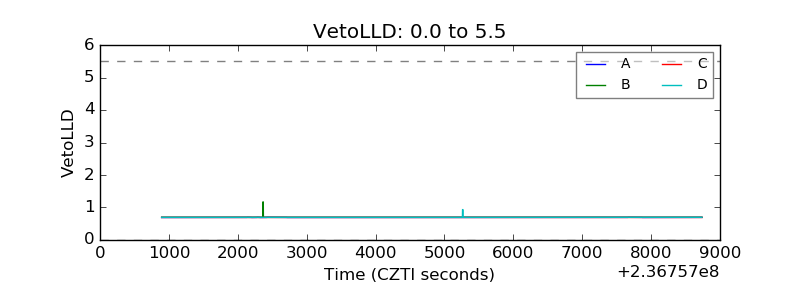 |
| Alpha Counter | 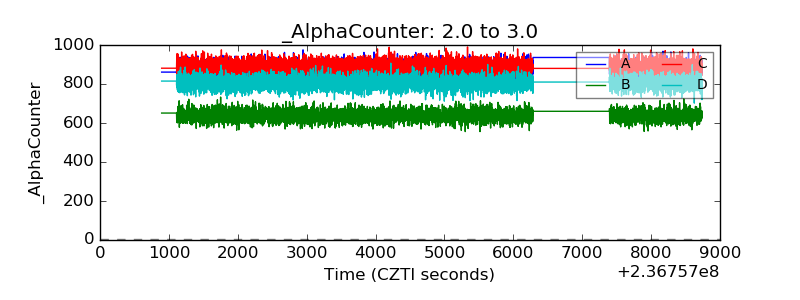 |
| _CPM_Rate | 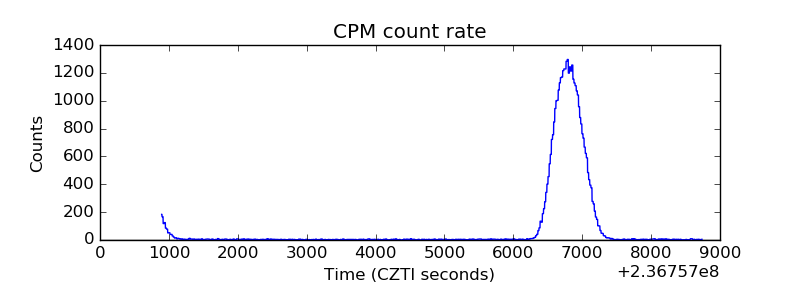 |
| CZT Counter | 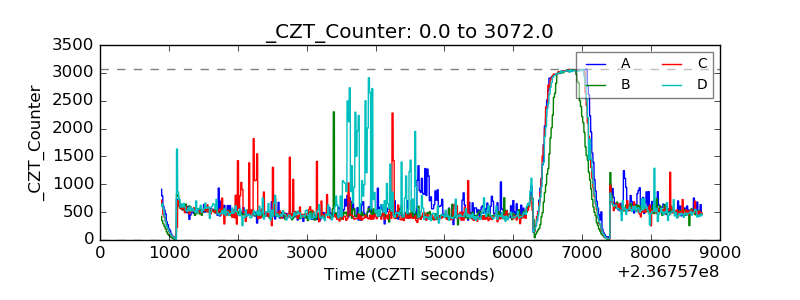 |
| +2.5 Volts monitor |  |
| +5 Volts monitor |  |
| _ROLL_ROT | 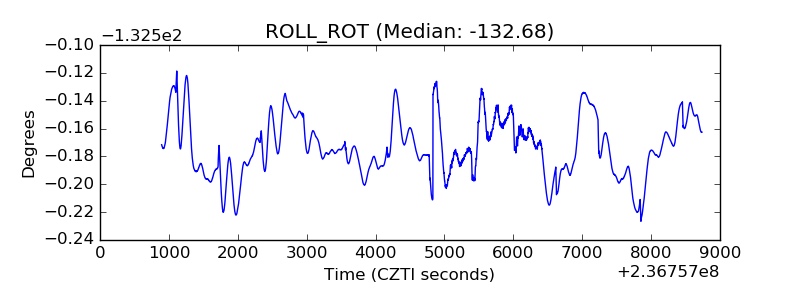 |
| _Roll_DEC | 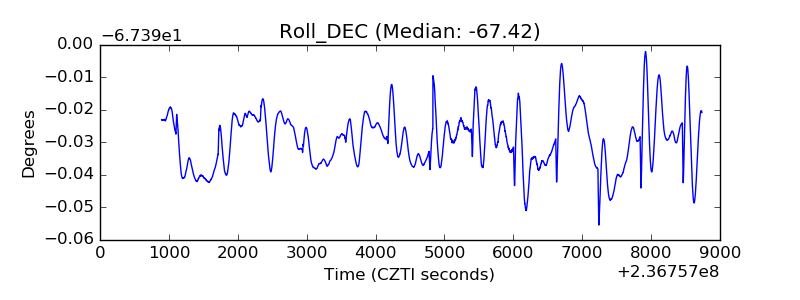 |
| _Roll_RA | 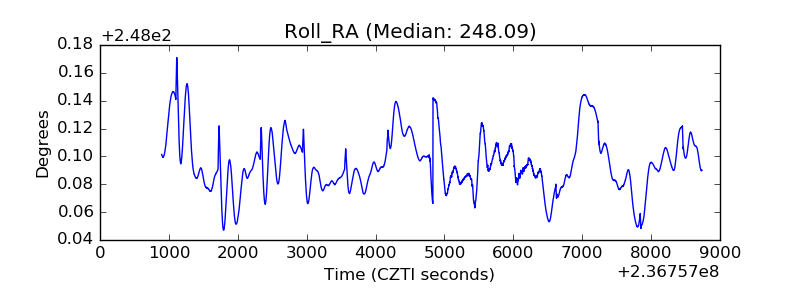 |
| Veto Counter | 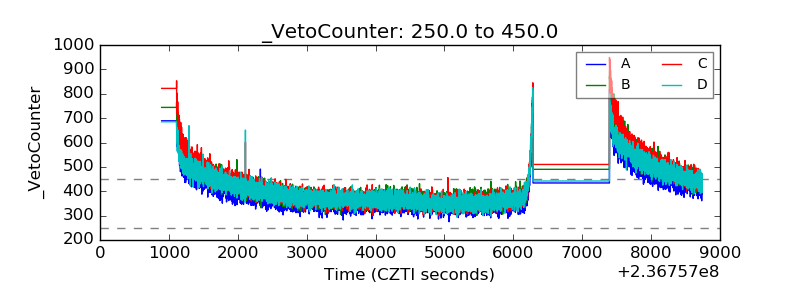 |