| Param | Original file | Final file |
|---|---|---|
| Filename | modeM0/AS1G07_049T01_9000001352_09536cztM0_level2.evt | modeM0/AS1G07_049T01_9000001352_09536cztM0_level2_quad_clean.evt |
| Size (bytes) | 396,789,120 | 108,100,800 |
| Size | 378.4 MB | 103.1 MB |
| Events in quadrant A | 3,041,722 | 728,605 |
| Events in quadrant B | 2,640,260 | 737,124 |
| Events in quadrant C | 2,565,804 | 730,329 |
| Events in quadrant D | 3,407,051 | 705,340 |
| Mode M9 | |||
|---|---|---|---|
| Quadrant | BADHDUFLAG | Total packets | Discarded packets |
| A | 0 | 12 | 0 |
| B | 0 | 12 | 0 |
| C | 0 | 12 | 0 |
| D | 0 | 12 | 0 |
| Mode M0 | |||
|---|---|---|---|
| Quadrant | BADHDUFLAG | Total packets | Discarded packets |
| A | 0 | 13685 | 1151 |
| B | 0 | 12195 | 967 |
| C | 0 | 12307 | 995 |
| D | 0 | 14735 | 1049 |
| Mode SS | |||
|---|---|---|---|
| Quadrant | BADHDUFLAG | Total packets | Discarded packets |
| A | 0 | 120 | 10 |
| B | 0 | 120 | 8 |
| C | 0 | 120 | 10 |
| D | 0 | 120 | 8 |
| Quadrant | Total seconds | Saturated seconds | Saturation percentage |
|---|---|---|---|
| A | 5300 | 68 | 1.283019% |
| B | 5314 | 45 | 0.846820% |
| C | 5310 | 46 | 0.866290% |
| D | 5303 | 92 | 1.734867% |
Noise dominated data is calculated using 1-second bins in cleaned event files. If a bin has >2000 counts, and if more than 50% of those come from <1% of pixels, then it is considered to be noise-dominated and hence unusable.
| Quadrant | # 1 sec bins | Bins with >0 counts | Bins with >2000 counts | High rate bins dominated by noise | Noise dominated (total time) | Noise dominated (detector-on time) | Marked lightcurve |
|---|---|---|---|---|---|---|---|
| A | 7028 | 5525 | 1 | 1 | 0.01% | 0.02% | 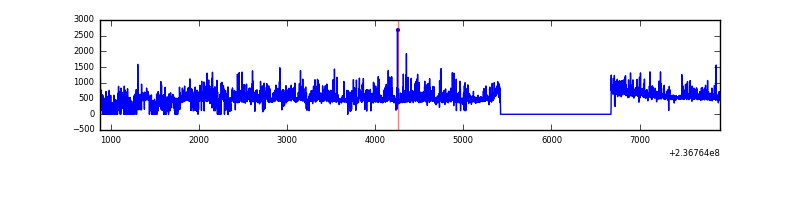 |
| B | 7030 | 5530 | 4 | 4 | 0.06% | 0.07% | 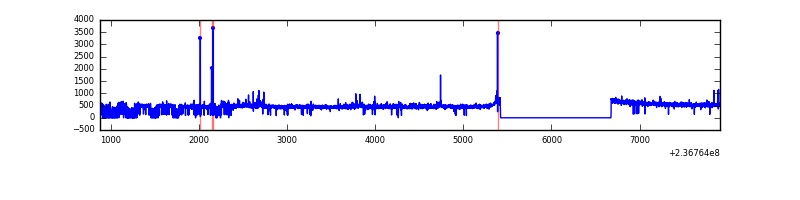 |
| C | 7030 | 5552 | 8 | 8 | 0.11% | 0.14% |  |
| D | 7030 | 5542 | 50 | 50 | 0.71% | 0.90% | 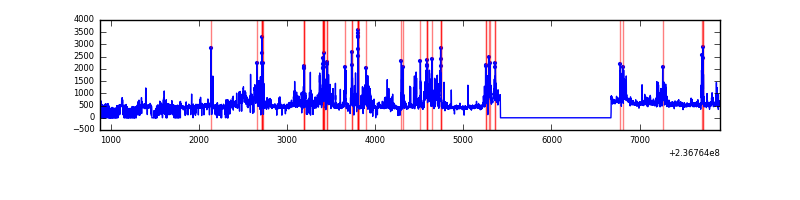 |
Top three noisy pixels from each quadrant. If the there are fewer than three noisy pixels in the level2.evt file, extra rows are filled as -1
| Pixel properties | Quadrant properties | ||||||
|---|---|---|---|---|---|---|---|
| Quadrant | DetID | PixID | Counts | Sigma | Mean | Median | Sigma |
| A | 1 | 162 | 222869 | 1687.11 | 652 | 640 | 131.7 |
| A | 1 | 178 | 107859 | 813.98 | 652 | 640 | 131.7 |
| A | 1 | 161 | 103061 | 777.56 | 652 | 640 | 131.7 |
| B | 0 | 214 | 56512 | 457.28 | 651 | 636 | 122.2 |
| B | 0 | 219 | 35894 | 288.54 | 651 | 636 | 122.2 |
| B | 12 | 111 | 12651 | 98.33 | 651 | 636 | 122.2 |
| C | 4 | 254 | 98459 | 679.73 | 632 | 637 | 143.9 |
| C | 13 | 61 | 4988 | 30.23 | 632 | 637 | 143.9 |
| C | 8 | 222 | 1684 | 7.28 | 632 | 637 | 143.9 |
| D | 1 | 52 | 842047 | 5445.4 | 631 | 617 | 154.5 |
| D | 13 | 137 | 69729 | 447.27 | 631 | 617 | 154.5 |
| D | 12 | 233 | 47130 | 301.01 | 631 | 617 | 154.5 |
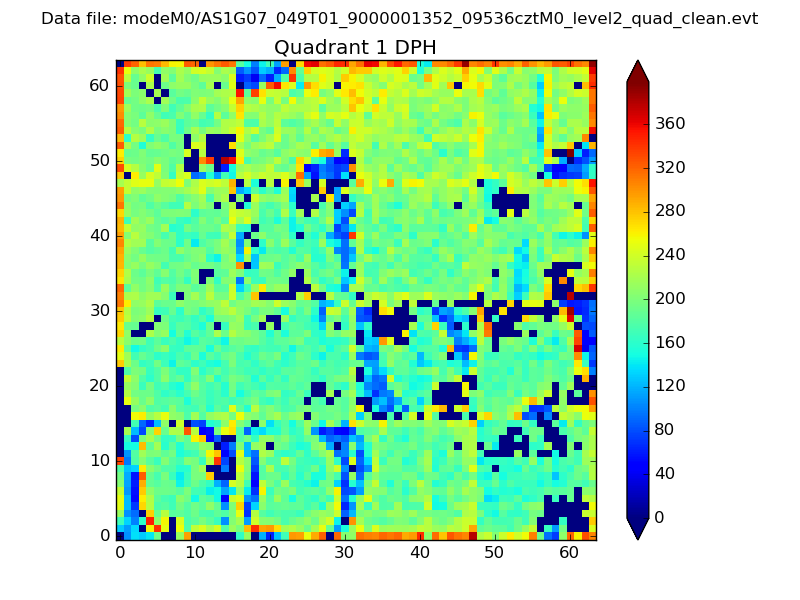
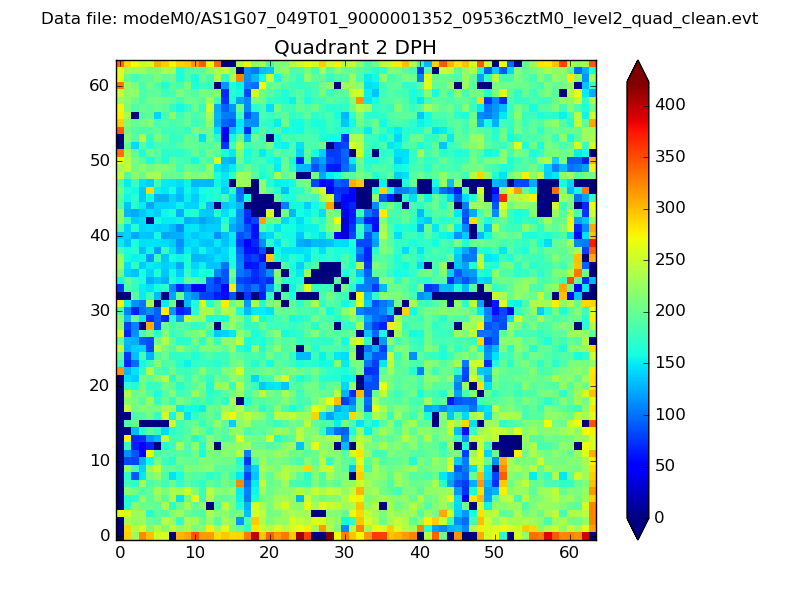
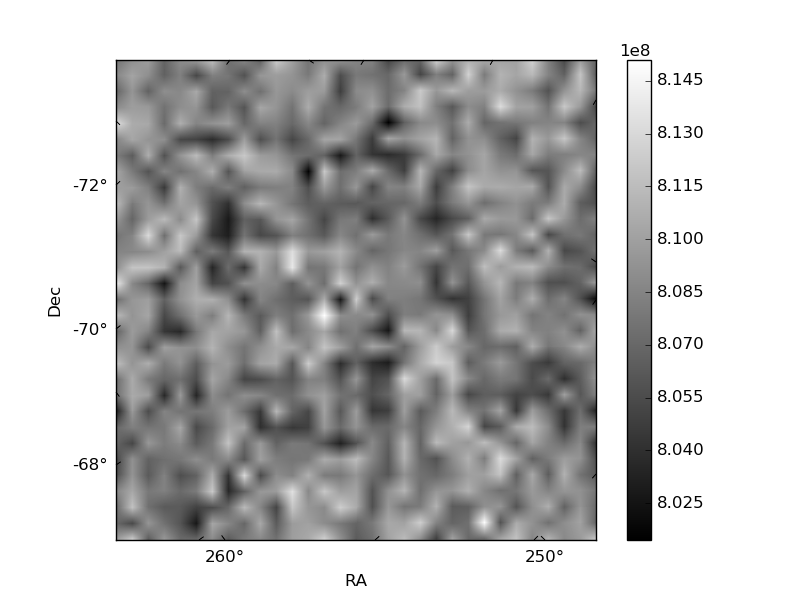
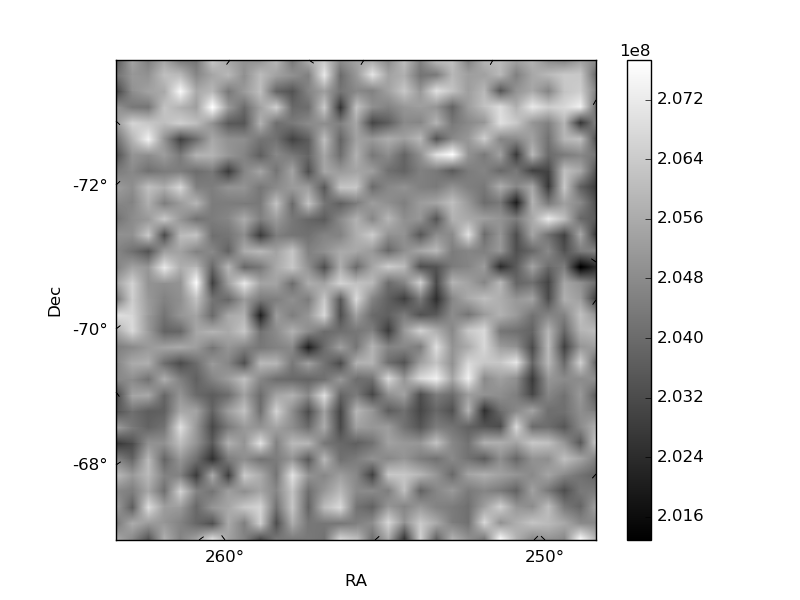
Histogram calculated using DETX and DETY for each event in the final _common_clean file
| Quadrant A | 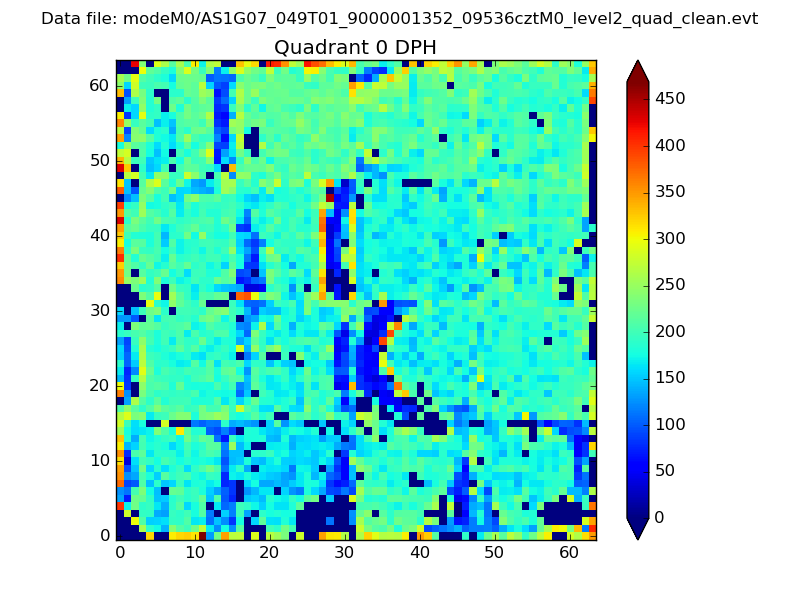 |
 |
Quadrant B |
|---|---|---|---|
| Quadrant D | 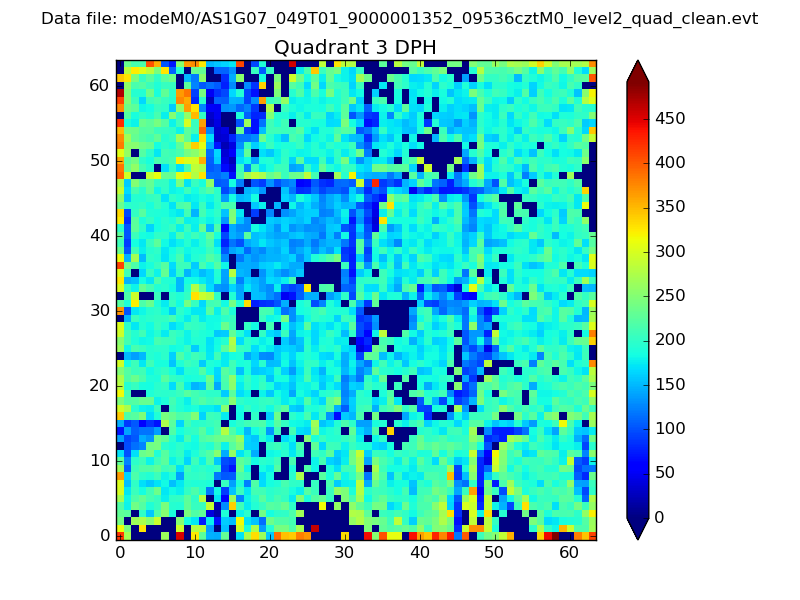 |
 |
Quadrant C |
| Plot type | Count rate plots | Images |
|---|---|---|
| Comparison with Poisson distribution Blue bars denote a histogram of data divided into 1 sec bins. Red curve is a Poisson curve with rate = median count rate of data. |
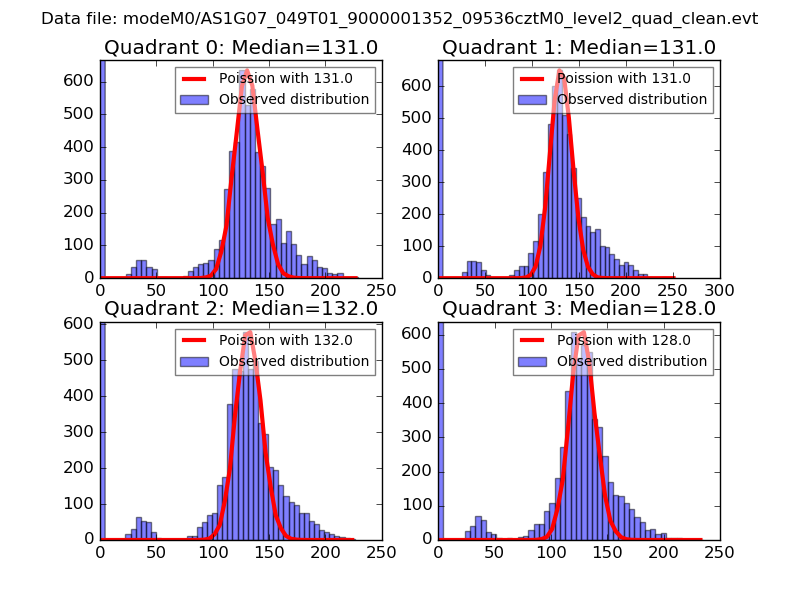 |
 |
| Quadrant-wise count rates Data is divided into 100 sec bins |
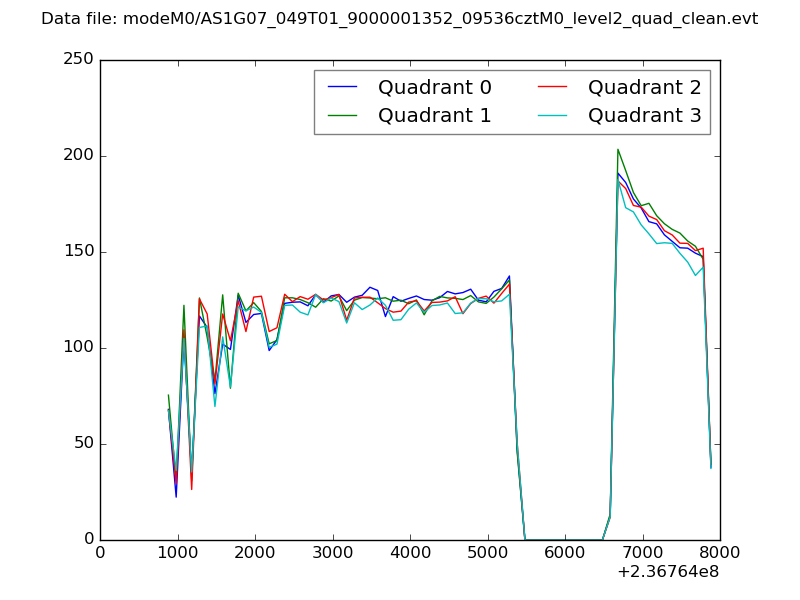 |
|
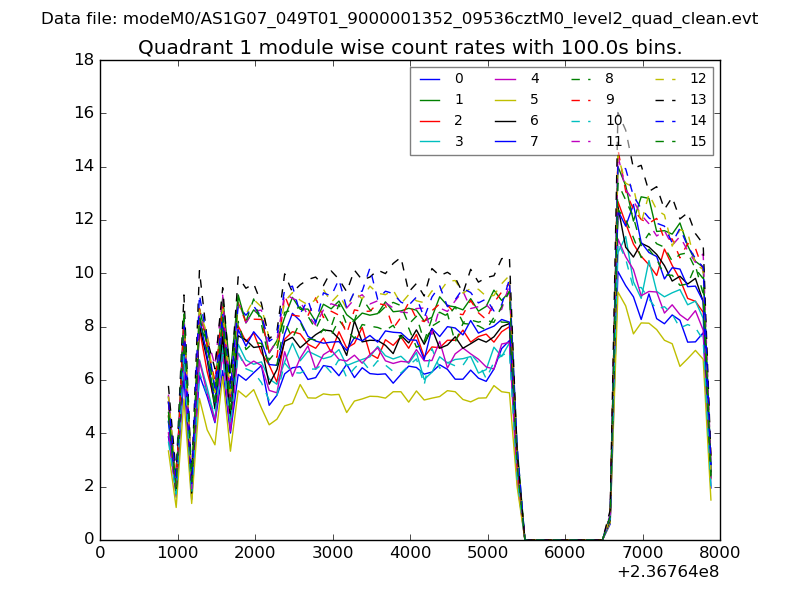
| Module-wise count rates for Quadrant A Data is divided into 100 sec bins |
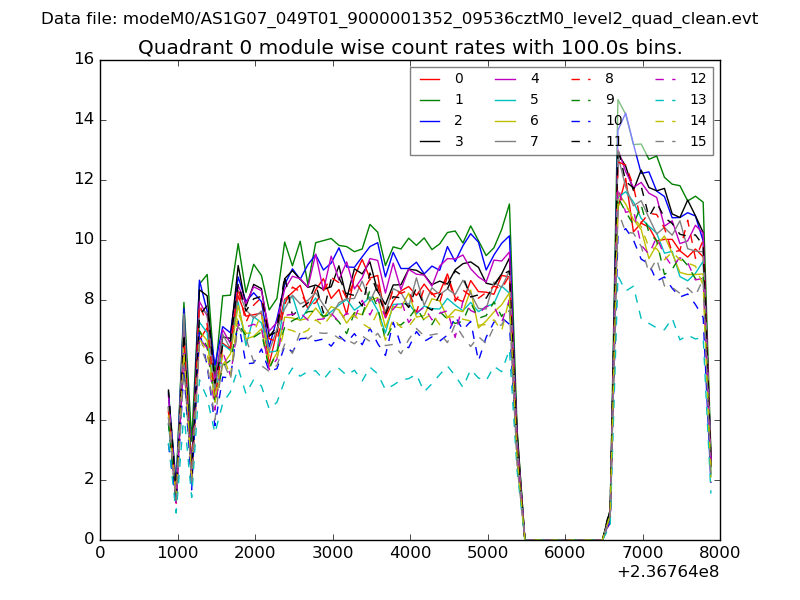 |
 |
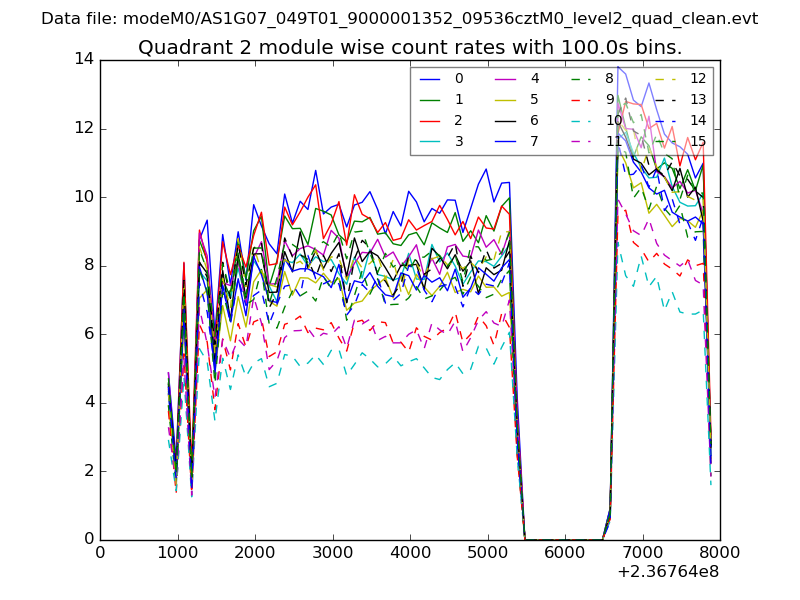
| Module-wise count rates for Quadrant B Data is divided into 100 sec bins |
 |
 |
| Module-wise count rates for Quadrant C Data is divided into 100 sec bins |
 |
 |
| Module-wise count rates for Quadrant D Data is divided into 100 sec bins |
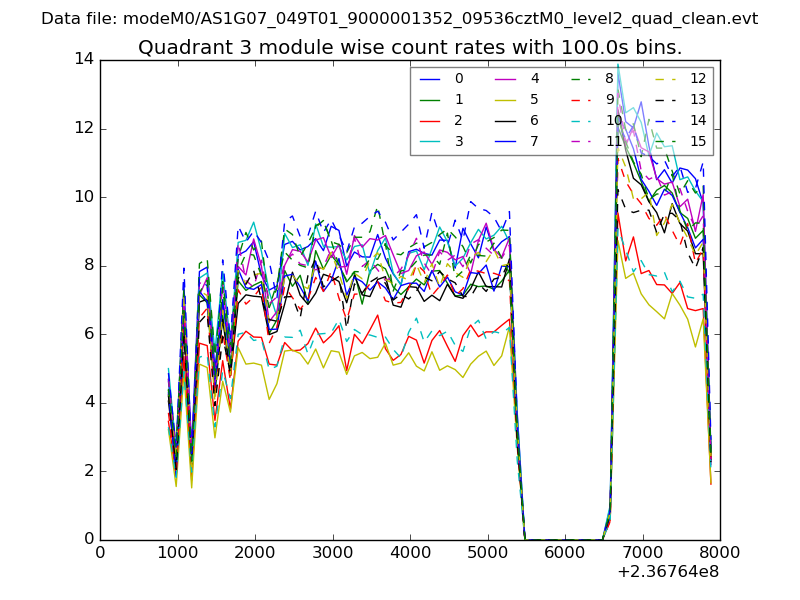 |
 |
| Parameter | Plot |
|---|---|
| CZT HV Monitor | 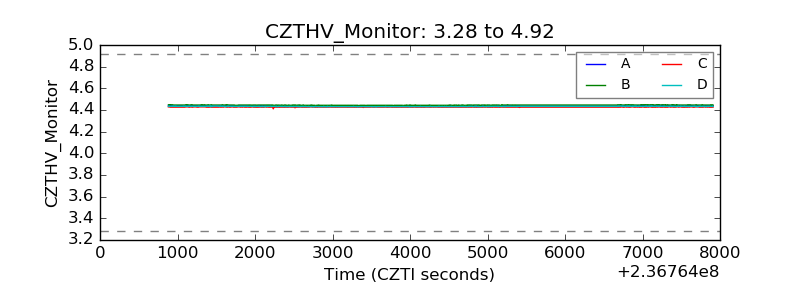 |
| D_VDD | 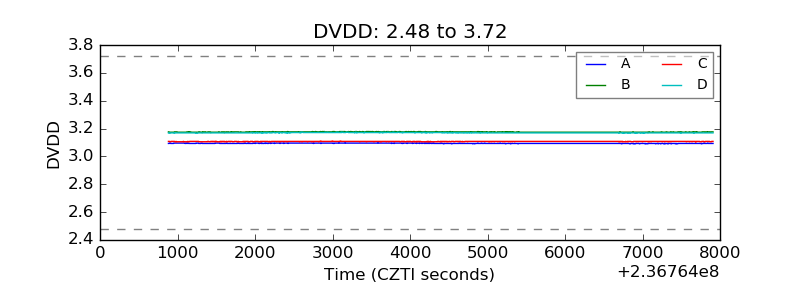 |
| Temperature 1 | 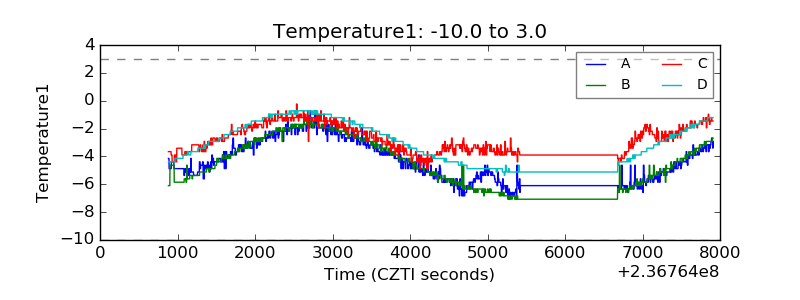 |
| Veto HV Monitor | 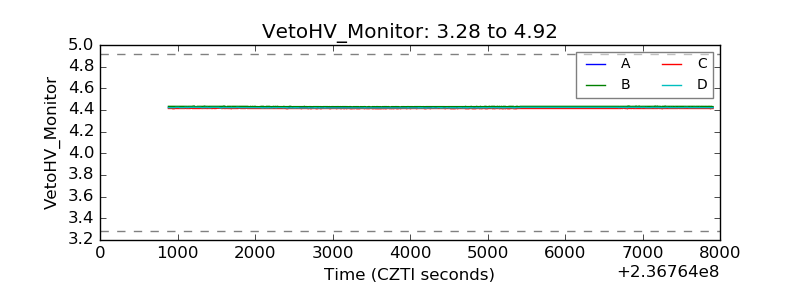 |
| Veto LLD | 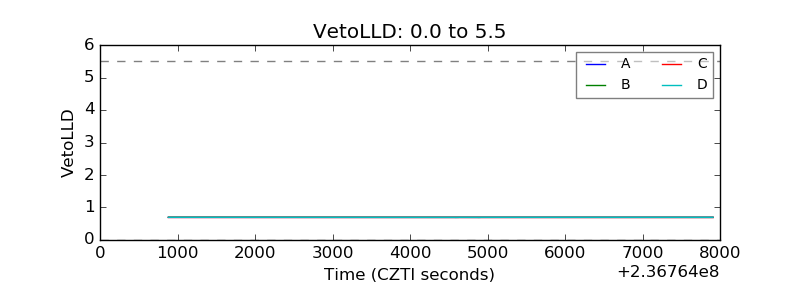 |
| Alpha Counter | 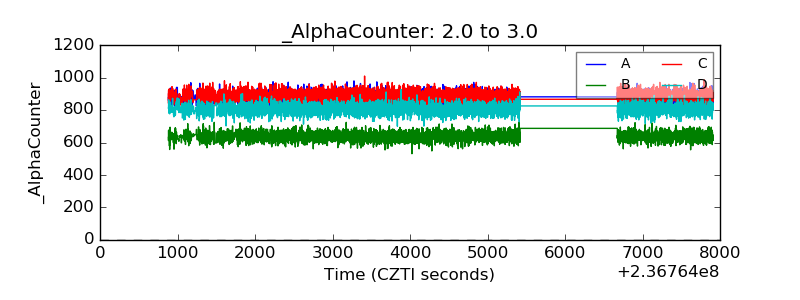 |
| _CPM_Rate | 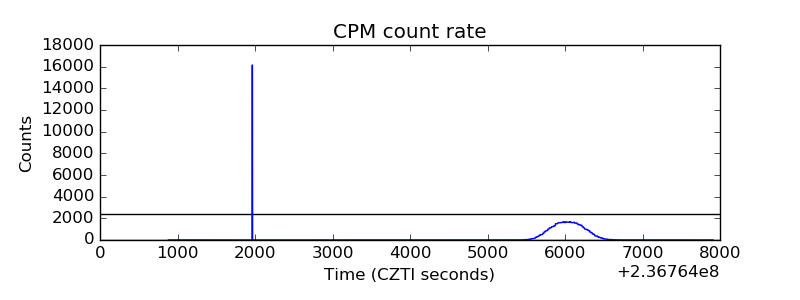 |
| CZT Counter | 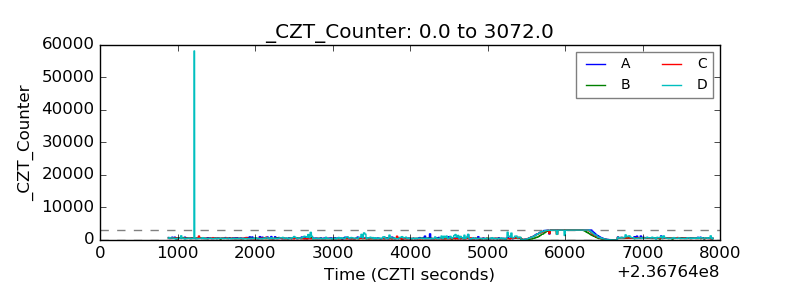 |
| +2.5 Volts monitor | 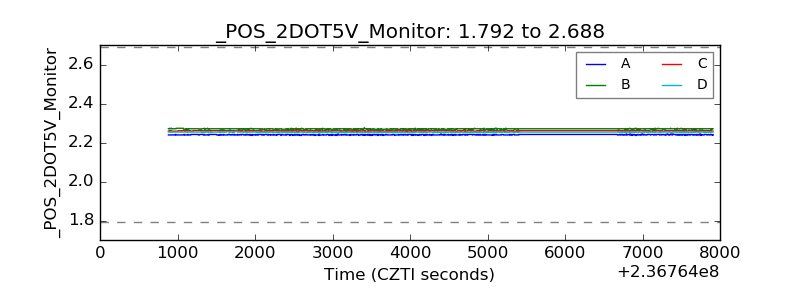 |
| +5 Volts monitor |  |
| _ROLL_ROT | 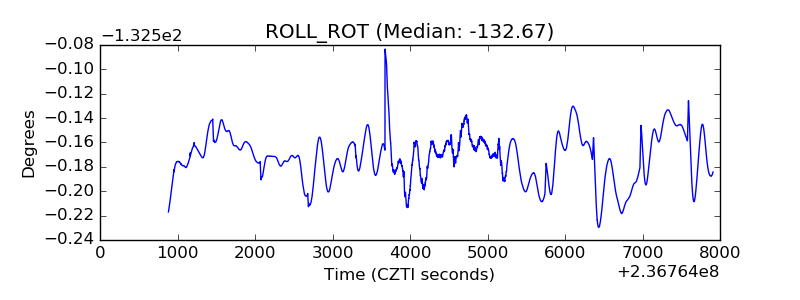 |
| _Roll_DEC | 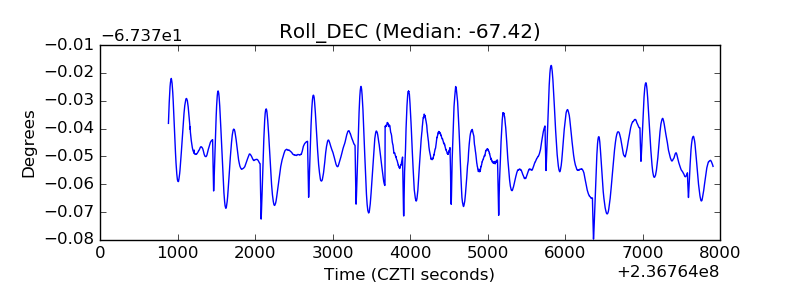 |
| _Roll_RA | 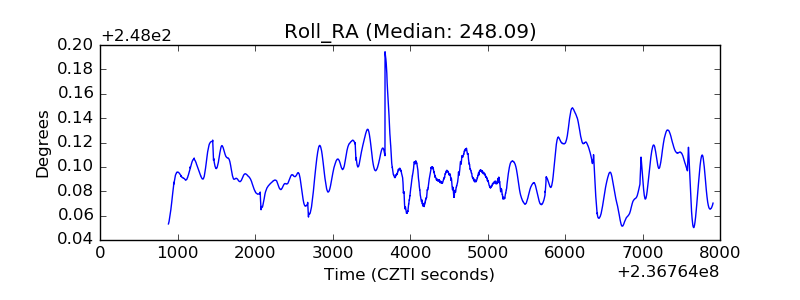 |
| Veto Counter | 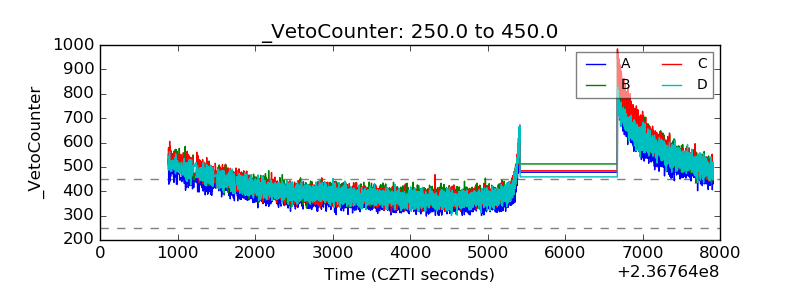 |