| Param | Original file | Final file |
|---|---|---|
| Filename | modeM0/AS1G07_049T01_9000001352_09537cztM0_level2.evt | modeM0/AS1G07_049T01_9000001352_09537cztM0_level2_quad_clean.evt |
| Size (bytes) | 688,127,040 | 194,025,600 |
| Size | 656.2 MB | 185.0 MB |
| Events in quadrant A | 5,337,769 | 1,312,758 |
| Events in quadrant B | 4,749,659 | 1,328,555 |
| Events in quadrant C | 4,597,240 | 1,316,791 |
| Events in quadrant D | 5,519,489 | 1,268,283 |
| Mode M9 | |||
|---|---|---|---|
| Quadrant | BADHDUFLAG | Total packets | Discarded packets |
| A | 0 | 24 | 1 |
| B | 0 | 24 | 0 |
| C | 0 | 24 | 1 |
| D | 0 | 24 | 2 |
| Mode M0 | |||
|---|---|---|---|
| Quadrant | BADHDUFLAG | Total packets | Discarded packets |
| A | 0 | 25591 | 3519 |
| B | 0 | 23180 | 3072 |
| C | 0 | 23153 | 3038 |
| D | 0 | 26420 | 3816 |
| Mode SS | |||
|---|---|---|---|
| Quadrant | BADHDUFLAG | Total packets | Discarded packets |
| A | 0 | 224 | 26 |
| B | 0 | 224 | 34 |
| C | 0 | 224 | 36 |
| D | 0 | 224 | 38 |
| Quadrant | Total seconds | Saturated seconds | Saturation percentage |
|---|---|---|---|
| A | 9348 | 165 | 1.765083% |
| B | 9373 | 139 | 1.482983% |
| C | 9399 | 116 | 1.234174% |
| D | 9321 | 161 | 1.727282% |
Noise dominated data is calculated using 1-second bins in cleaned event files. If a bin has >2000 counts, and if more than 50% of those come from <1% of pixels, then it is considered to be noise-dominated and hence unusable.
| Quadrant | # 1 sec bins | Bins with >0 counts | Bins with >2000 counts | High rate bins dominated by noise | Noise dominated (total time) | Noise dominated (detector-on time) | Marked lightcurve |
|---|---|---|---|---|---|---|---|
| A | 13358 | 10147 | 3 | 3 | 0.02% | 0.03% | 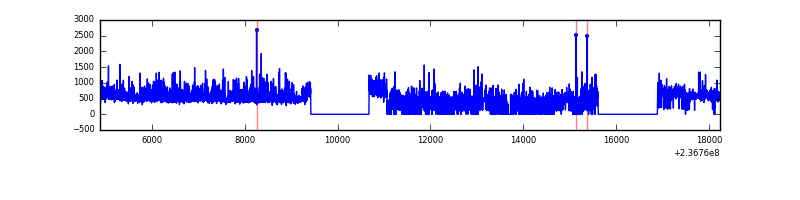 |
| B | 13358 | 10170 | 5 | 5 | 0.04% | 0.05% | 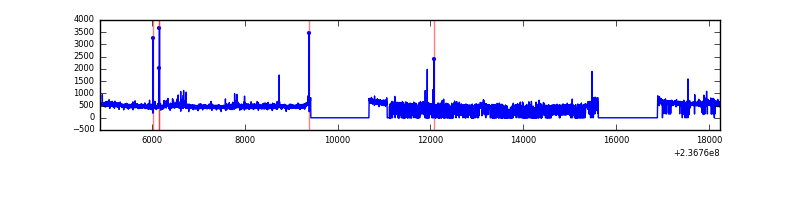 |
| C | 13358 | 10203 | 11 | 11 | 0.08% | 0.11% | 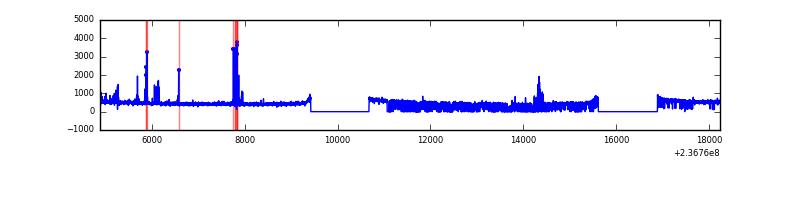 |
| D | 13358 | 10108 | 55 | 55 | 0.41% | 0.54% | 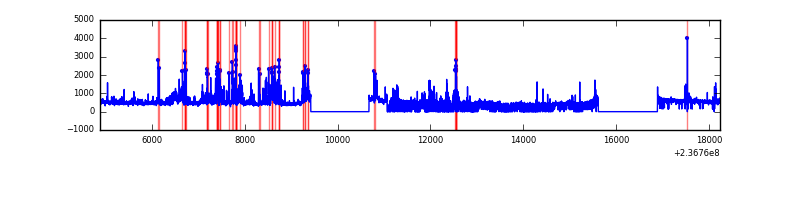 |
Top three noisy pixels from each quadrant. If the there are fewer than three noisy pixels in the level2.evt file, extra rows are filled as -1
| Pixel properties | Quadrant properties | ||||||
|---|---|---|---|---|---|---|---|
| Quadrant | DetID | PixID | Counts | Sigma | Mean | Median | Sigma |
| A | 1 | 162 | 348929 | 1486.51 | 1173 | 1150 | 234.0 |
| A | 1 | 178 | 165765 | 703.61 | 1173 | 1150 | 234.0 |
| A | 1 | 161 | 158580 | 672.9 | 1173 | 1150 | 234.0 |
| B | 0 | 214 | 124276 | 572.9 | 1169 | 1143 | 214.9 |
| B | 0 | 219 | 59831 | 273.05 | 1169 | 1143 | 214.9 |
| B | 12 | 111 | 22466 | 99.21 | 1169 | 1143 | 214.9 |
| C | 4 | 254 | 151943 | 587.71 | 1138 | 1149 | 256.6 |
| C | 13 | 61 | 8975 | 30.5 | 1138 | 1149 | 256.6 |
| C | 14 | 67 | 4815 | 14.29 | 1138 | 1149 | 256.6 |
| D | 1 | 52 | 959633 | 3474.15 | 1129 | 1106 | 275.9 |
| D | 8 | 195 | 78247 | 279.59 | 1129 | 1106 | 275.9 |
| D | 13 | 137 | 75750 | 270.54 | 1129 | 1106 | 275.9 |
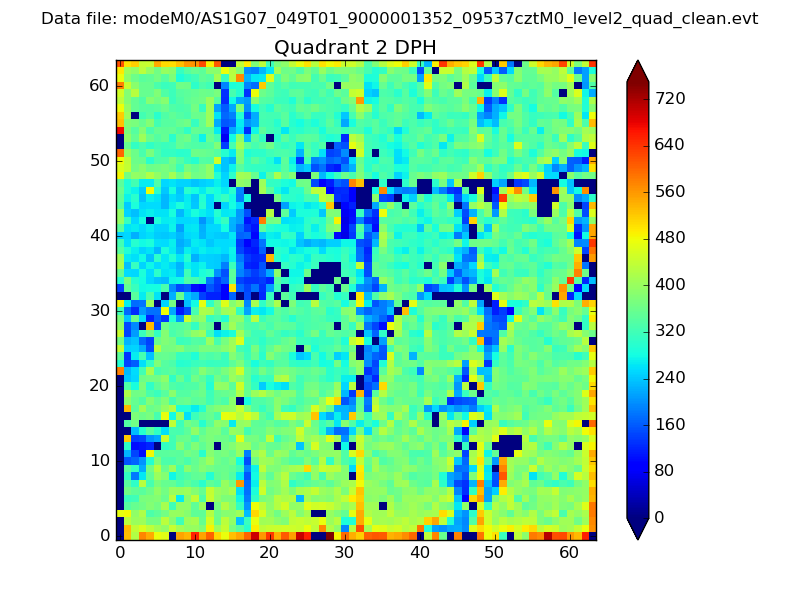
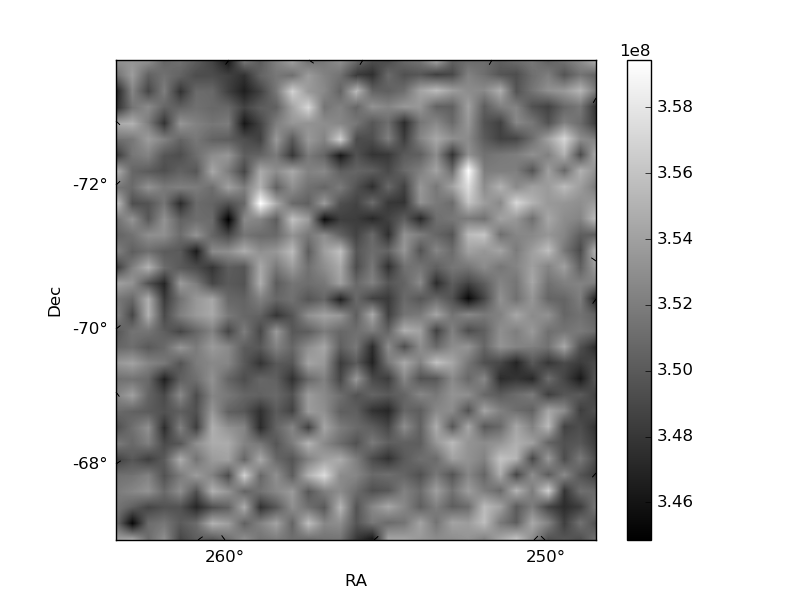
Histogram calculated using DETX and DETY for each event in the final _common_clean file
| Quadrant A | 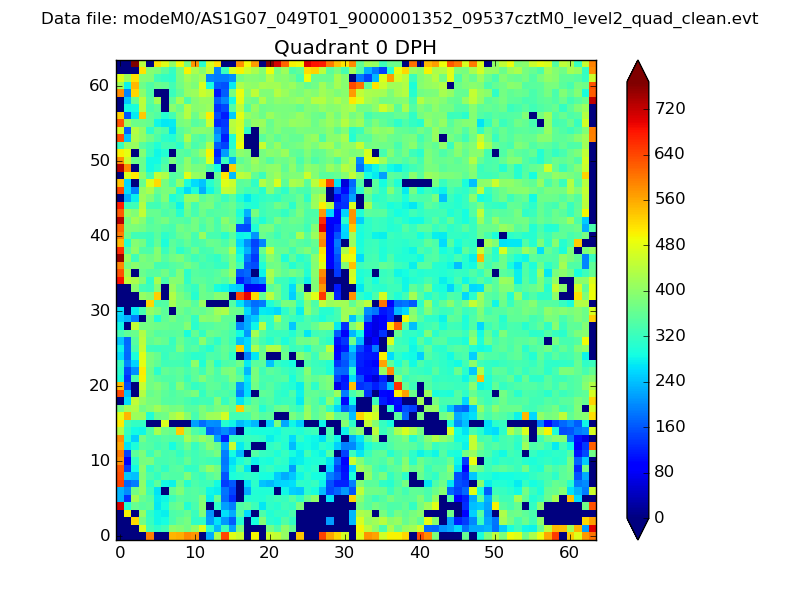 |
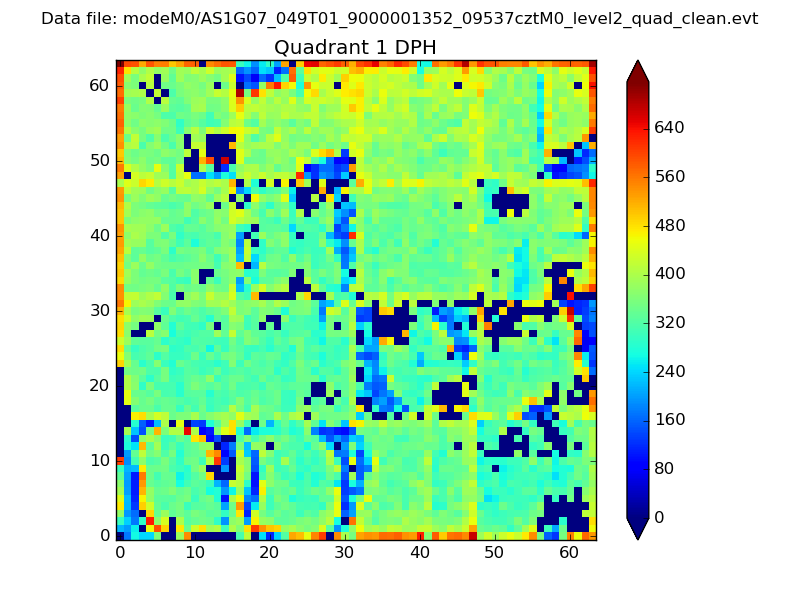 |
Quadrant B |
|---|---|---|---|
| Quadrant D | 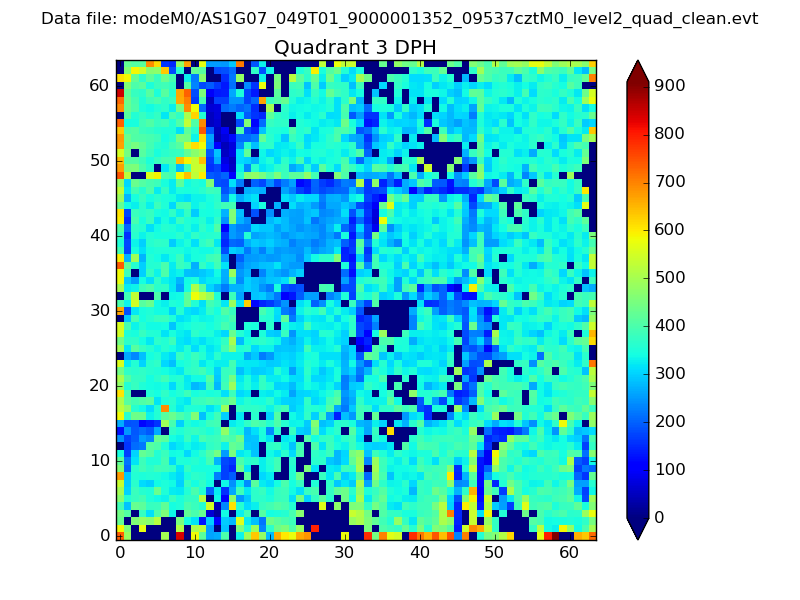 |
 |
Quadrant C |
| Plot type | Count rate plots | Images |
|---|---|---|
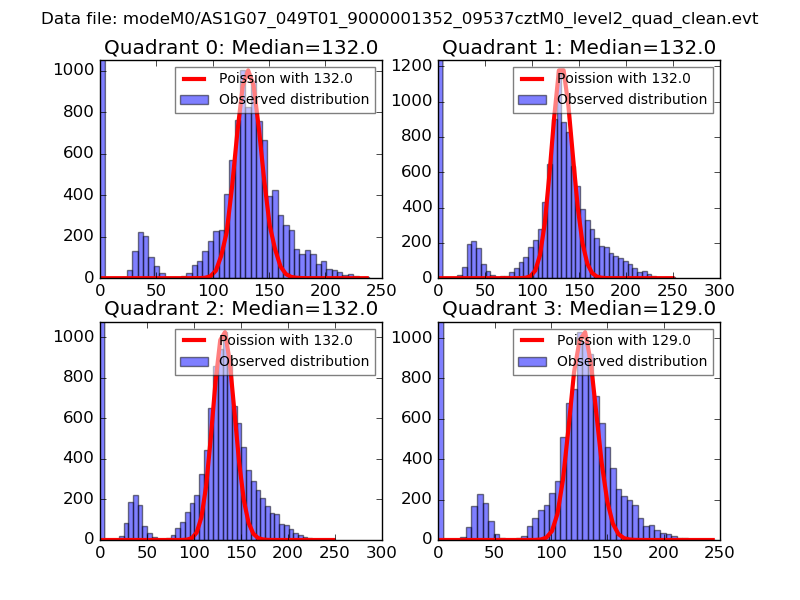
| Comparison with Poisson distribution Blue bars denote a histogram of data divided into 1 sec bins. Red curve is a Poisson curve with rate = median count rate of data. |
 |
 |
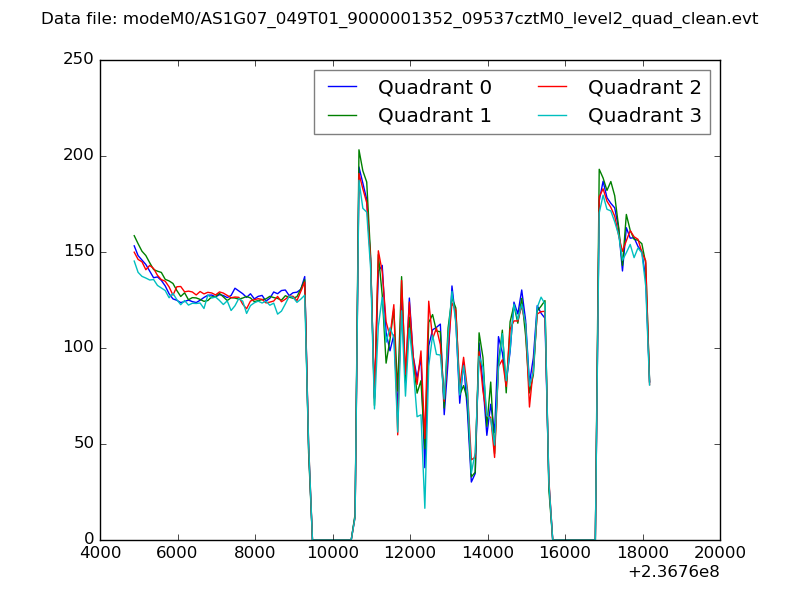
| Quadrant-wise count rates Data is divided into 100 sec bins |
 |
|
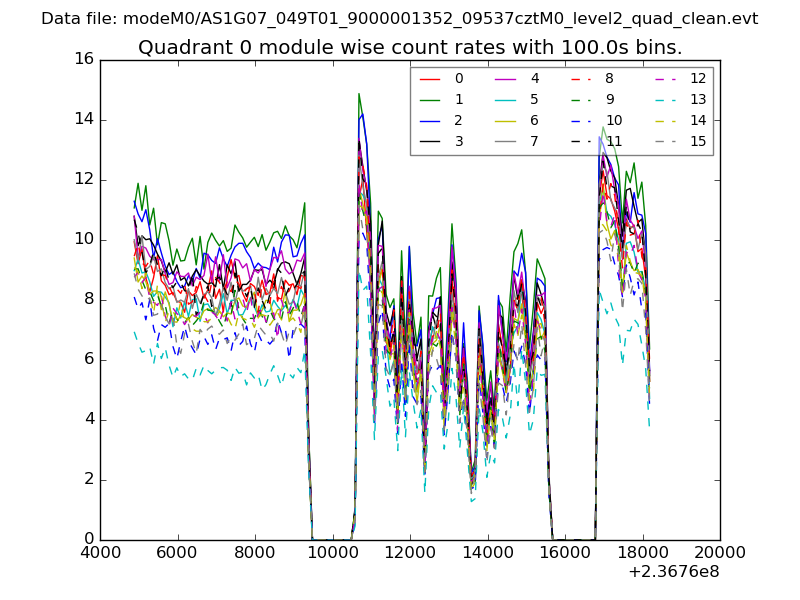
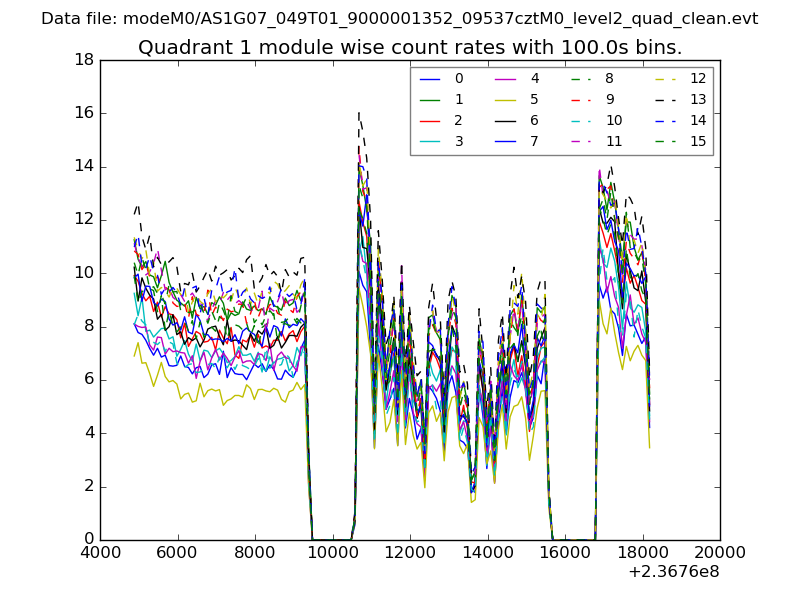
| Module-wise count rates for Quadrant A Data is divided into 100 sec bins |
 |
 |
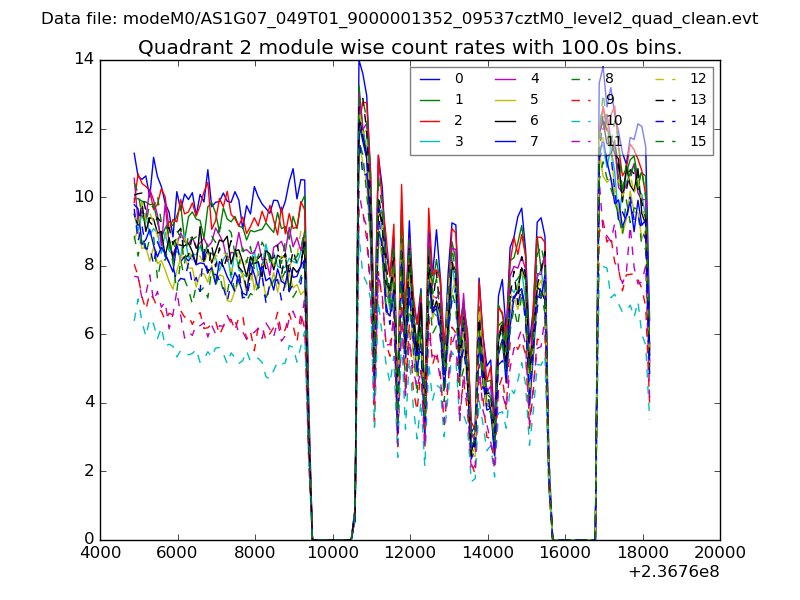
| Module-wise count rates for Quadrant B Data is divided into 100 sec bins |
 |
 |
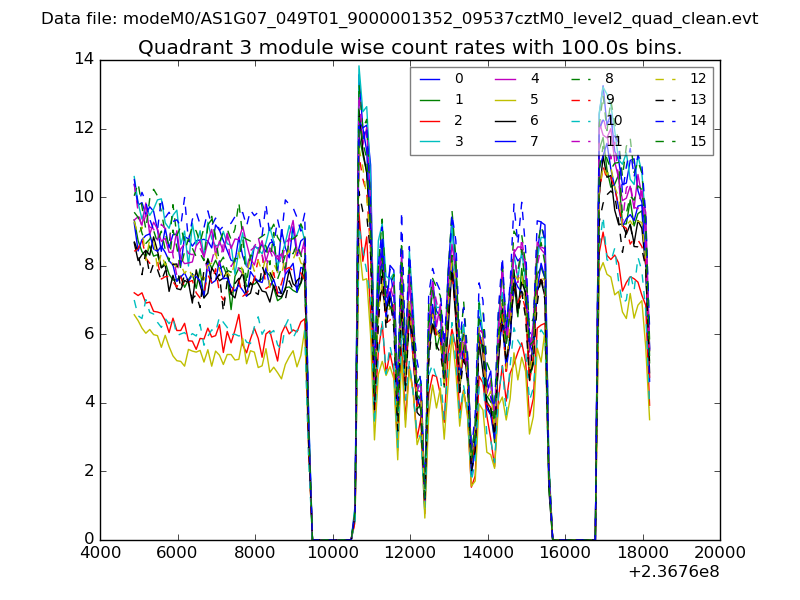
| Module-wise count rates for Quadrant C Data is divided into 100 sec bins |
 |
 |
| Module-wise count rates for Quadrant D Data is divided into 100 sec bins |
 |
 |
| Parameter | Plot |
|---|---|
| CZT HV Monitor | 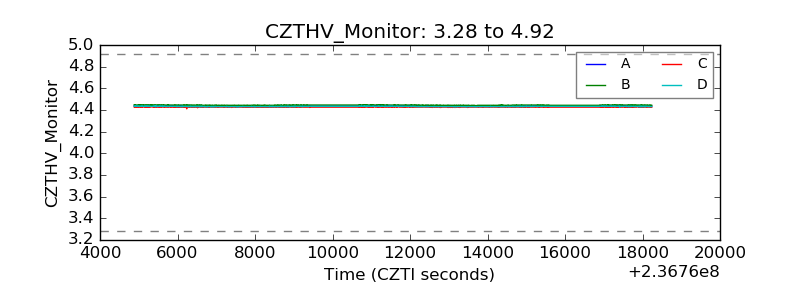 |
| D_VDD | 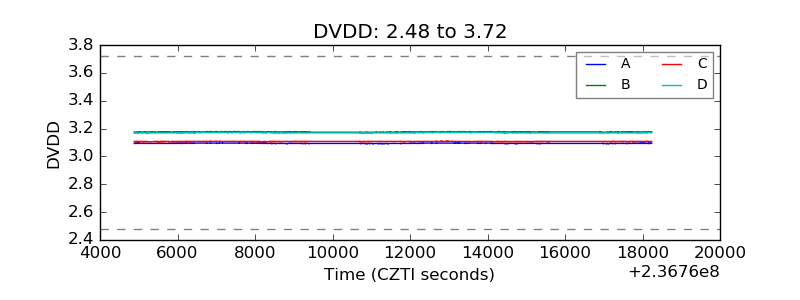 |
| Temperature 1 | 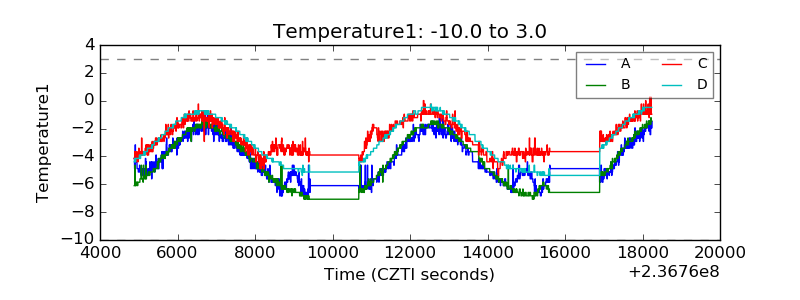 |
| Veto HV Monitor |  |
| Veto LLD | 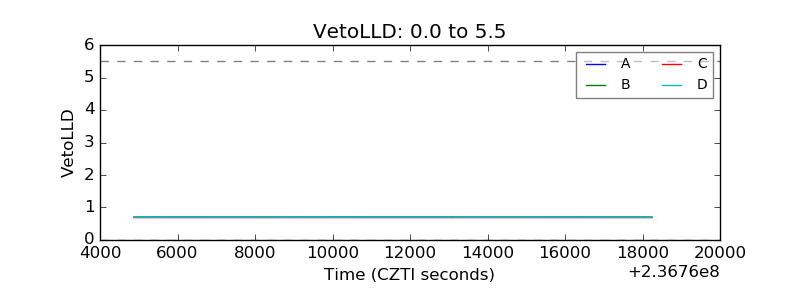 |
| Alpha Counter | 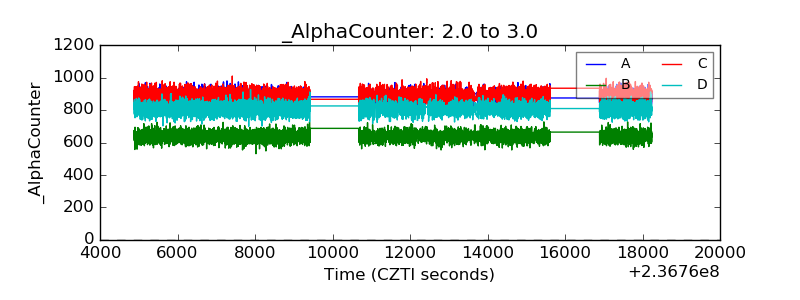 |
| _CPM_Rate | 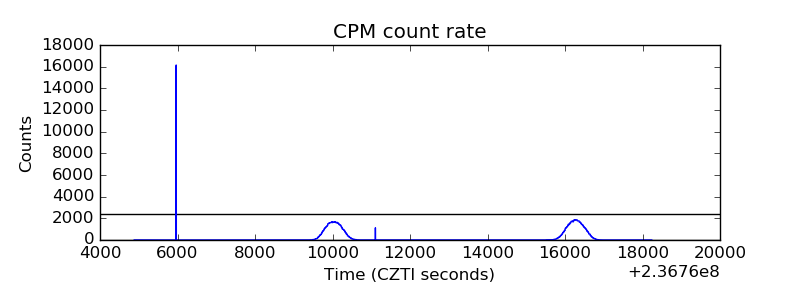 |
| CZT Counter | 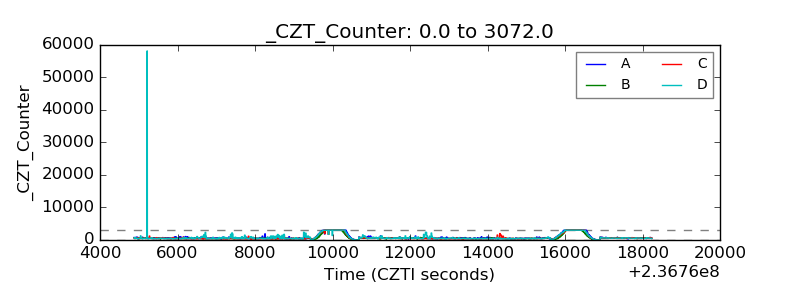 |
| +2.5 Volts monitor |  |
| +5 Volts monitor |  |
| _ROLL_ROT | 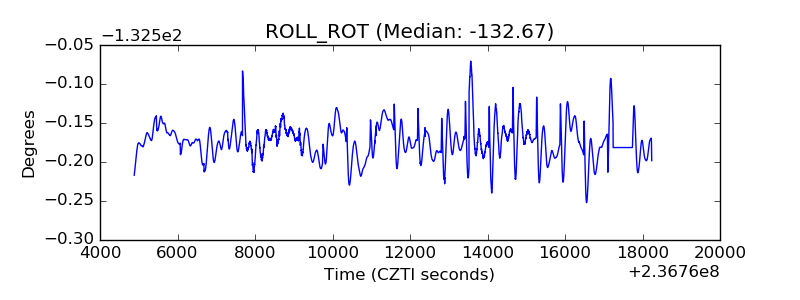 |
| _Roll_DEC | 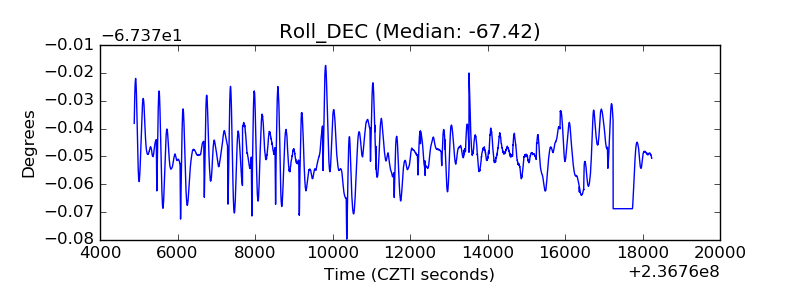 |
| _Roll_RA | 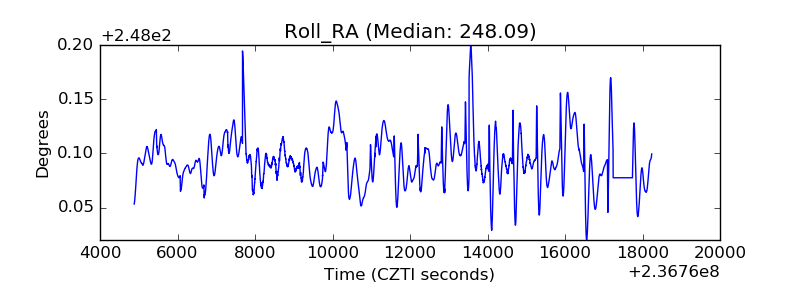 |
| Veto Counter | 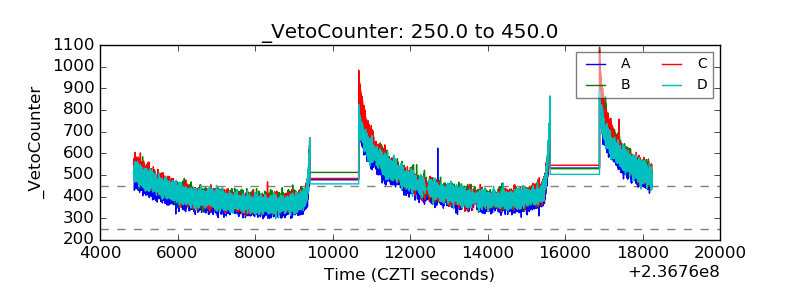 |