| Param | Original file | Final file |
|---|---|---|
| Filename | modeM0/AS1G07_049T01_9000001352_09538cztM0_level2.evt | modeM0/AS1G07_049T01_9000001352_09538cztM0_level2_quad_clean.evt |
| Size (bytes) | 482,184,000 | 129,381,120 |
| Size | 459.8 MB | 123.4 MB |
| Events in quadrant A | 3,351,578 | 889,852 |
| Events in quadrant B | 3,256,477 | 893,608 |
| Events in quadrant C | 3,627,163 | 864,894 |
| Events in quadrant D | 3,954,081 | 844,762 |
| Mode M9 | |||
|---|---|---|---|
| Quadrant | BADHDUFLAG | Total packets | Discarded packets |
| A | 0 | 13 | 0 |
| B | 0 | 13 | 0 |
| C | 0 | 13 | 0 |
| D | 0 | 13 | 0 |
| Mode M0 | |||
|---|---|---|---|
| Quadrant | BADHDUFLAG | Total packets | Discarded packets |
| A | 0 | 13908 | 2 |
| B | 0 | 13618 | 1 |
| C | 0 | 14872 | 1 |
| D | 0 | 15694 | 1 |
| Mode SS | |||
|---|---|---|---|
| Quadrant | BADHDUFLAG | Total packets | Discarded packets |
| A | 0 | 124 | 0 |
| B | 0 | 124 | 0 |
| C | 0 | 124 | 0 |
| D | 0 | 124 | 0 |
| Quadrant | Total seconds | Saturated seconds | Saturation percentage |
|---|---|---|---|
| A | 6092 | 119 | 1.953381% |
| B | 6092 | 121 | 1.986211% |
| C | 6092 | 234 | 3.841103% |
| D | 6092 | 319 | 5.236376% |
Noise dominated data is calculated using 1-second bins in cleaned event files. If a bin has >2000 counts, and if more than 50% of those come from <1% of pixels, then it is considered to be noise-dominated and hence unusable.
| Quadrant | # 1 sec bins | Bins with >0 counts | Bins with >2000 counts | High rate bins dominated by noise | Noise dominated (total time) | Noise dominated (detector-on time) | Marked lightcurve |
|---|---|---|---|---|---|---|---|
| A | 7392 | 6093 | 0 | 0 | 0.00% | 0.00% | 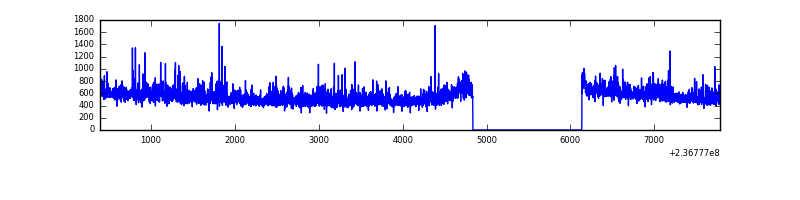 |
| B | 7392 | 6093 | 5 | 5 | 0.07% | 0.08% | 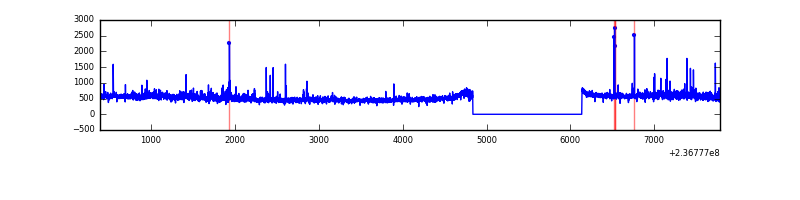 |
| C | 7392 | 6093 | 75 | 75 | 1.01% | 1.23% | 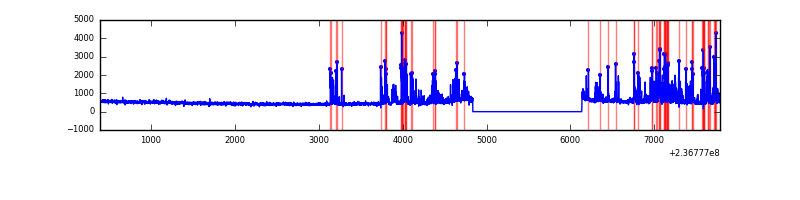 |
| D | 7392 | 6093 | 114 | 114 | 1.54% | 1.87% | 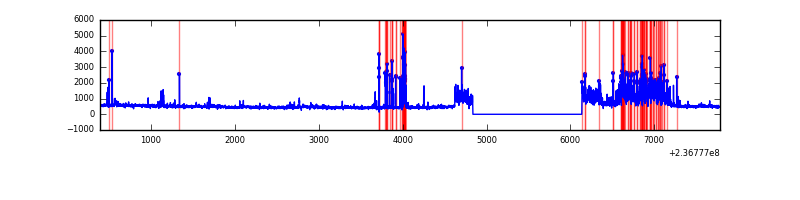 |
Top three noisy pixels from each quadrant. If the there are fewer than three noisy pixels in the level2.evt file, extra rows are filled as -1
| Pixel properties | Quadrant properties | ||||||
|---|---|---|---|---|---|---|---|
| Quadrant | DetID | PixID | Counts | Sigma | Mean | Median | Sigma |
| A | 1 | 162 | 158470 | 1021.76 | 782 | 767 | 154.3 |
| A | 1 | 178 | 61914 | 396.17 | 782 | 767 | 154.3 |
| A | 1 | 161 | 60204 | 385.09 | 782 | 767 | 154.3 |
| B | 0 | 214 | 173975 | 1216.93 | 774 | 759 | 142.3 |
| B | 0 | 219 | 28799 | 196.99 | 774 | 759 | 142.3 |
| B | 0 | 246 | 20506 | 138.73 | 774 | 759 | 142.3 |
| C | 4 | 254 | 743306 | 4466.82 | 737 | 742 | 166.2 |
| C | 13 | 61 | 5494 | 28.59 | 737 | 742 | 166.2 |
| C | 14 | 67 | 3517 | 16.69 | 737 | 742 | 166.2 |
| D | 1 | 52 | 781910 | 4028.14 | 739 | 722 | 193.9 |
| D | 12 | 233 | 161266 | 827.83 | 739 | 722 | 193.9 |
| D | 8 | 195 | 102160 | 523.06 | 739 | 722 | 193.9 |
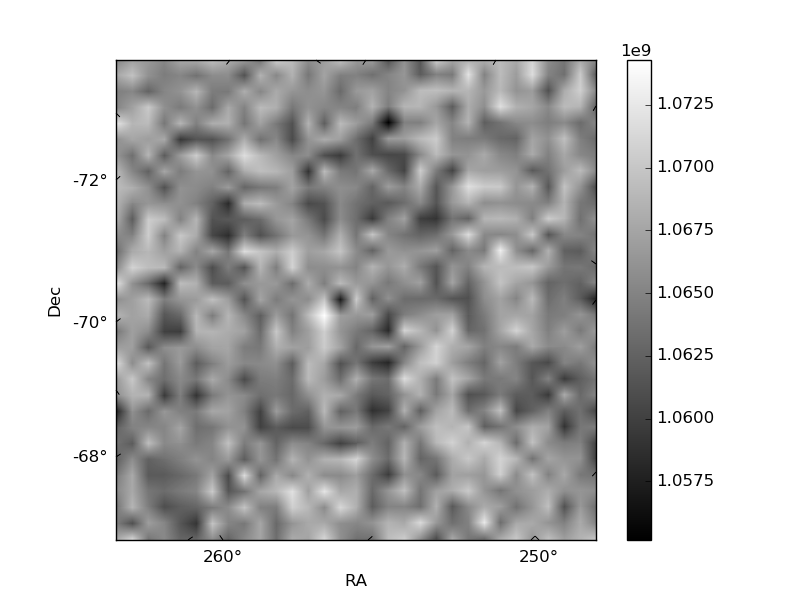
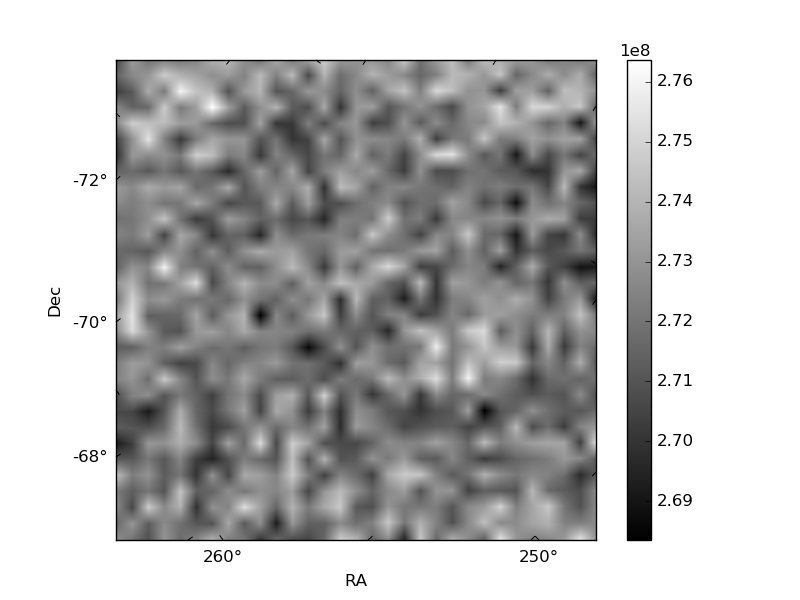
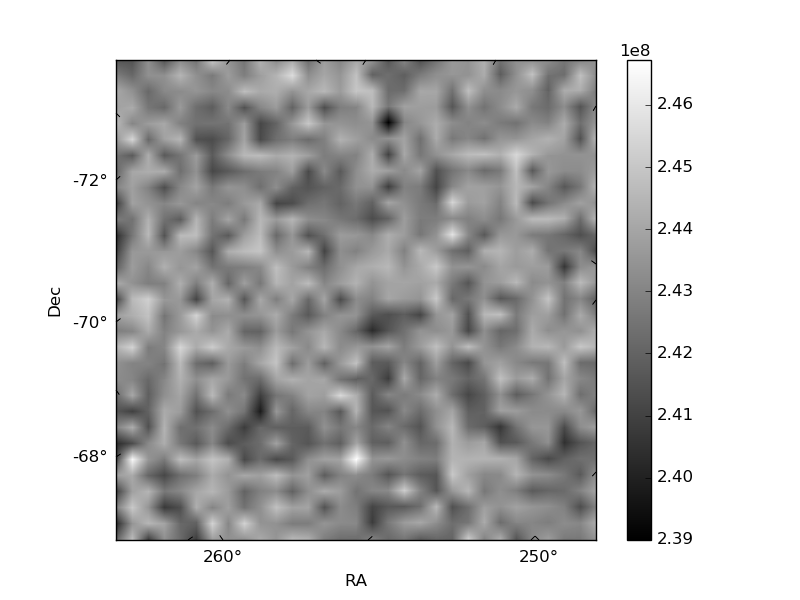
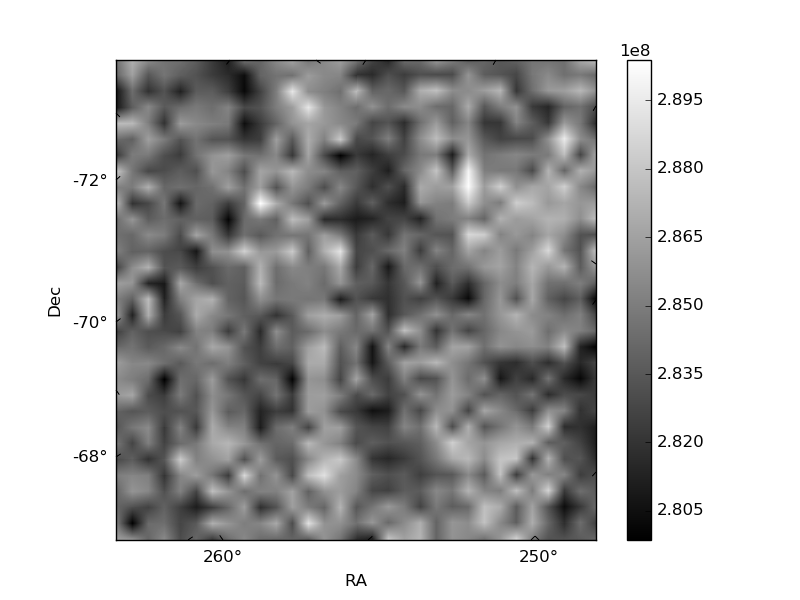
Histogram calculated using DETX and DETY for each event in the final _common_clean file
| Quadrant A | 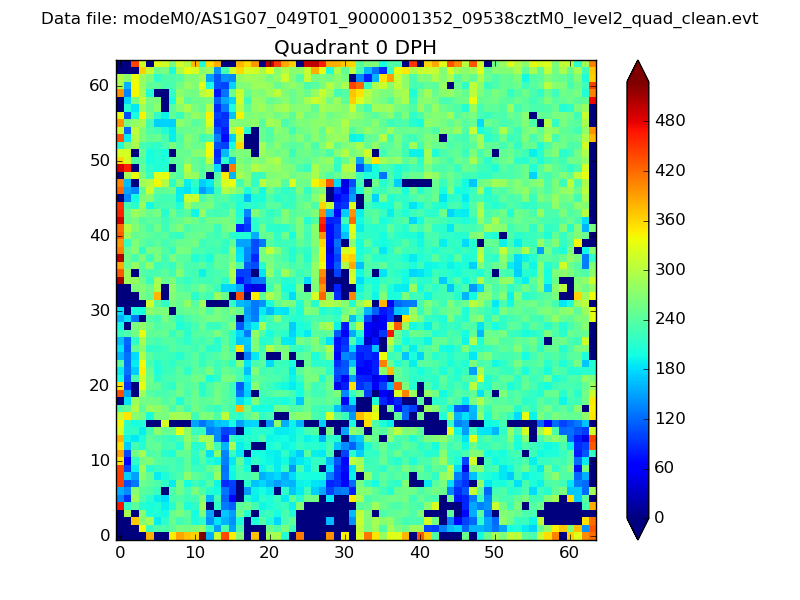 |
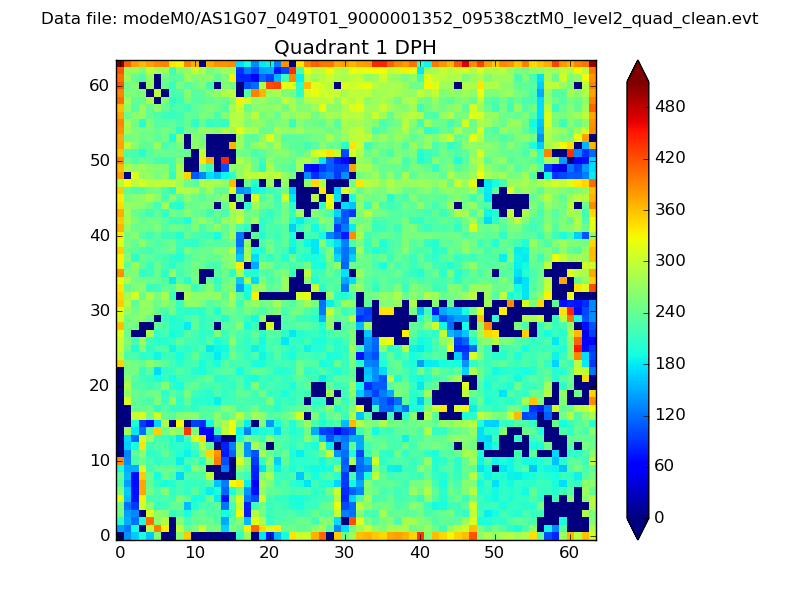 |
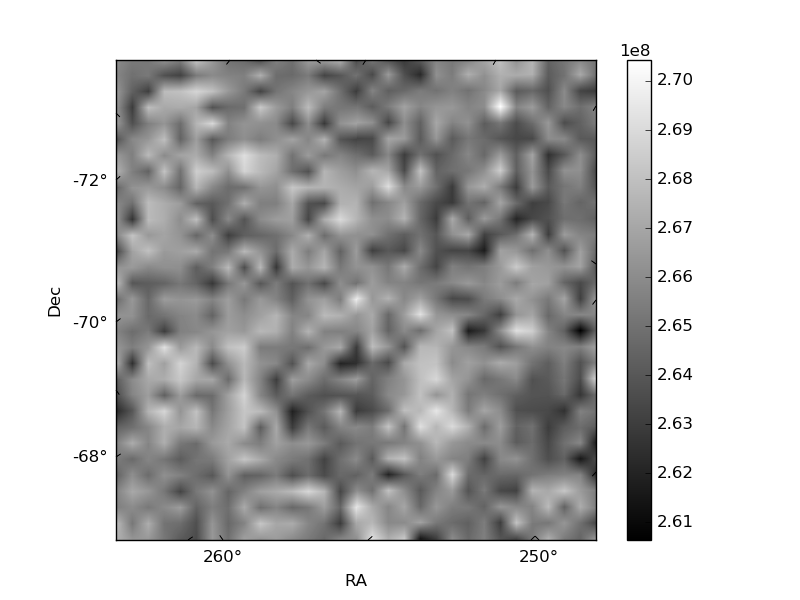
Quadrant B |
|---|---|---|---|
| Quadrant D | 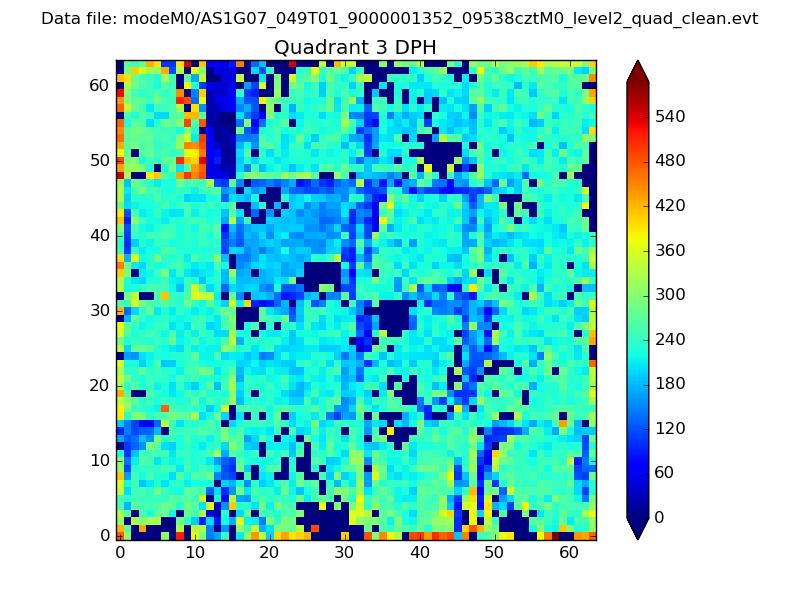 |
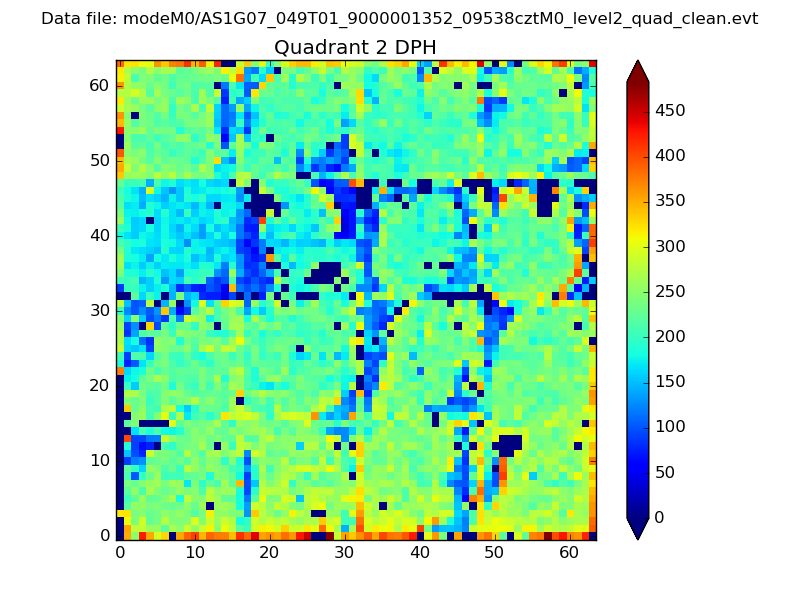 |
Quadrant C |
| Plot type | Count rate plots | Images |
|---|---|---|
| Comparison with Poisson distribution Blue bars denote a histogram of data divided into 1 sec bins. Red curve is a Poisson curve with rate = median count rate of data. |
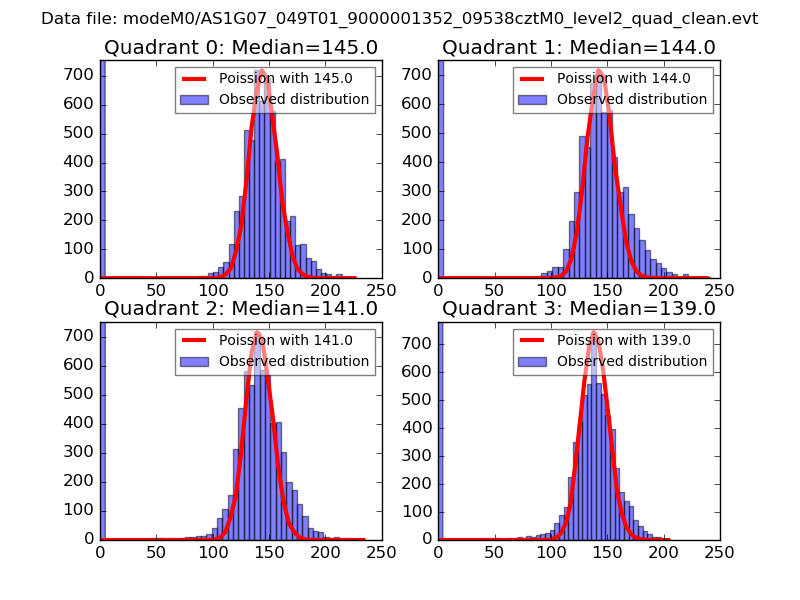 |
 |
| Quadrant-wise count rates Data is divided into 100 sec bins |
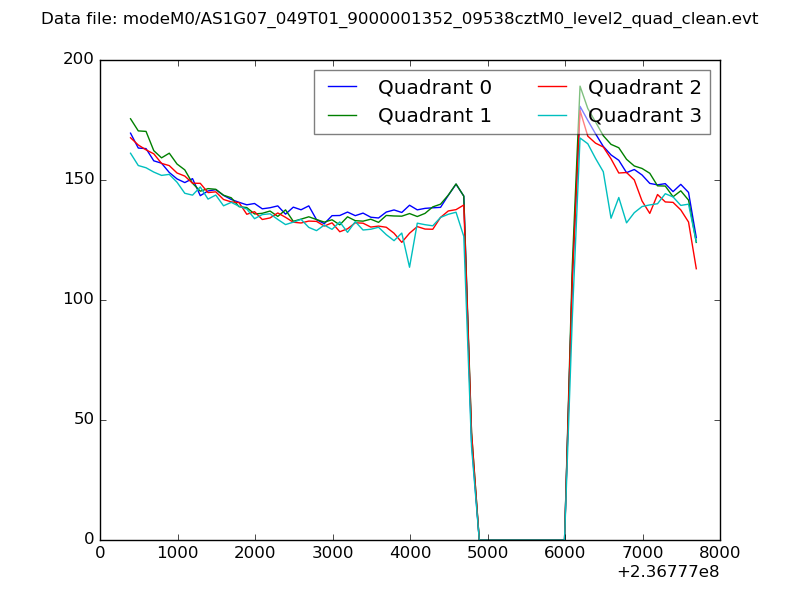 |
|
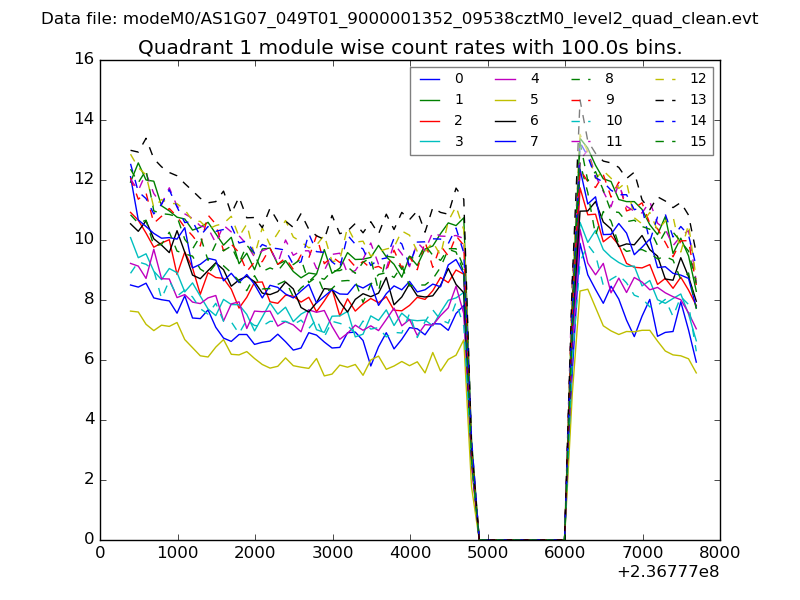
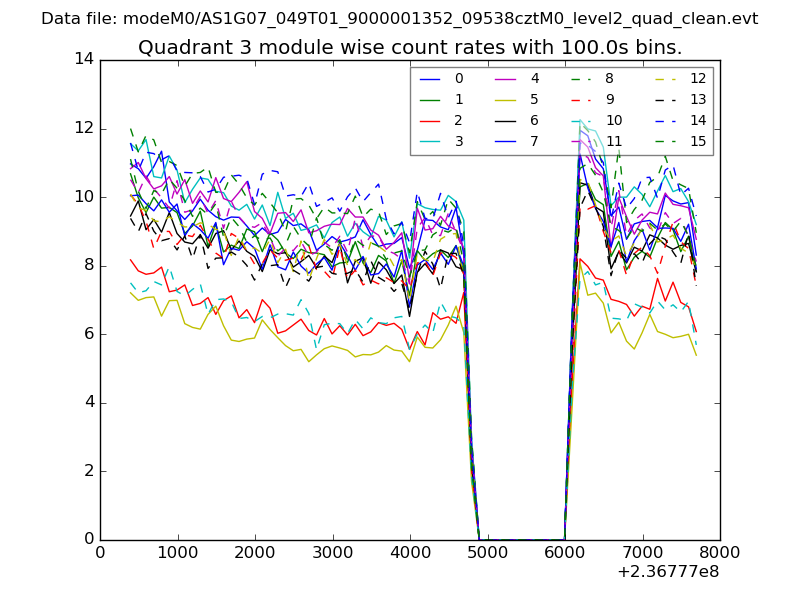
| Module-wise count rates for Quadrant A Data is divided into 100 sec bins |
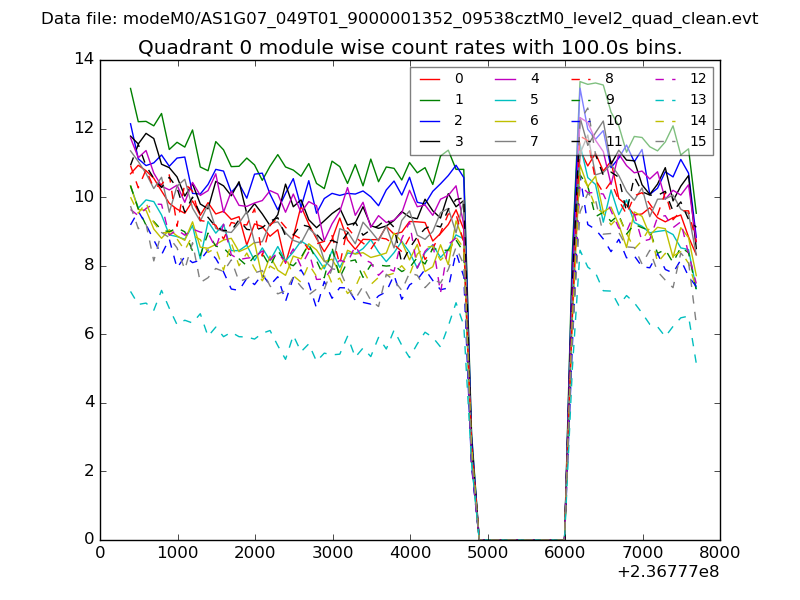 |
 |
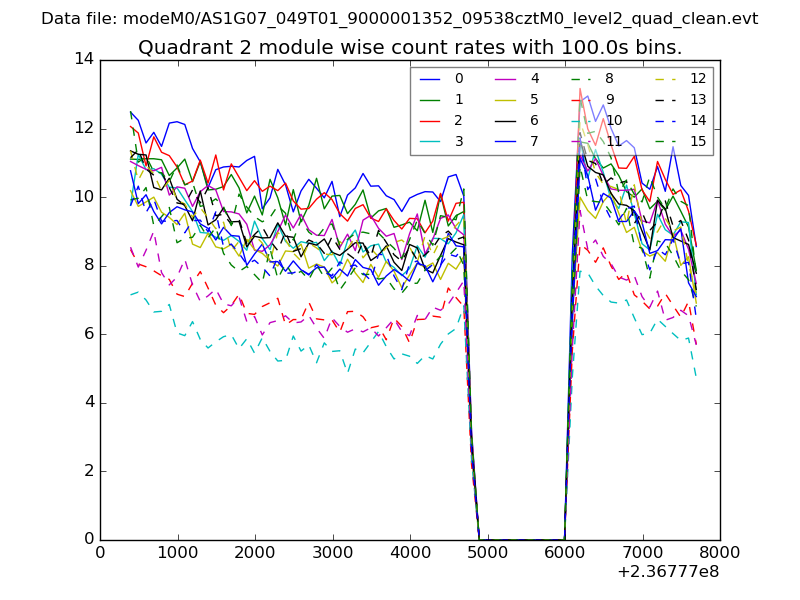
| Module-wise count rates for Quadrant B Data is divided into 100 sec bins |
 |
 |
| Module-wise count rates for Quadrant C Data is divided into 100 sec bins |
 |
 |
| Module-wise count rates for Quadrant D Data is divided into 100 sec bins |
 |
 |
| Parameter | Plot |
|---|---|
| CZT HV Monitor | 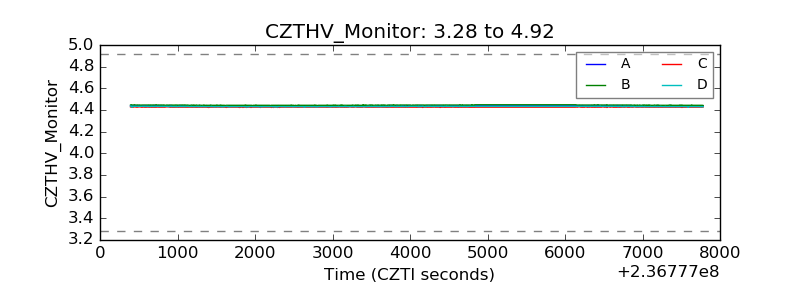 |
| D_VDD |  |
| Temperature 1 | 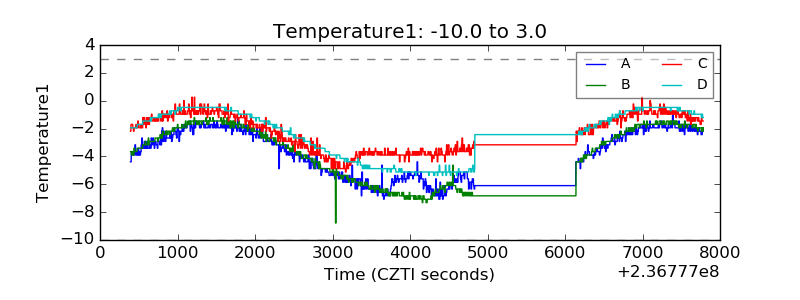 |
| Veto HV Monitor | 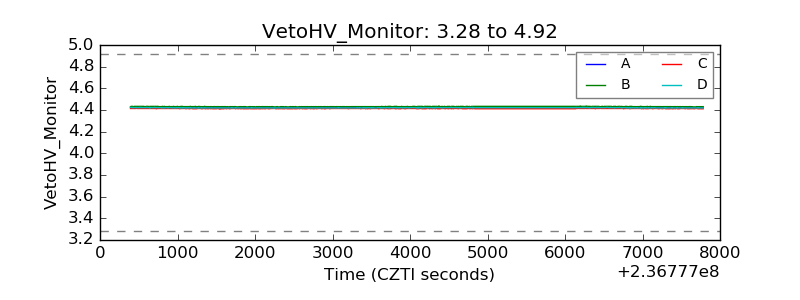 |
| Veto LLD | 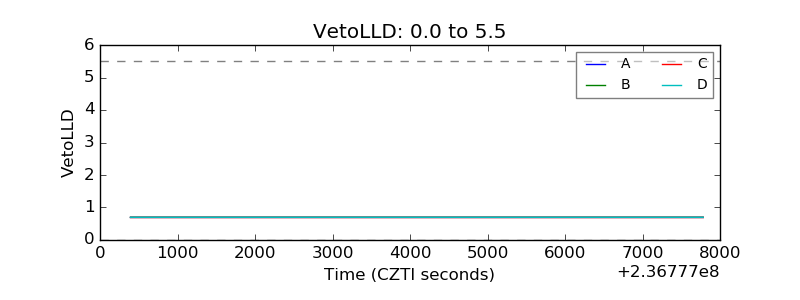 |
| Alpha Counter | 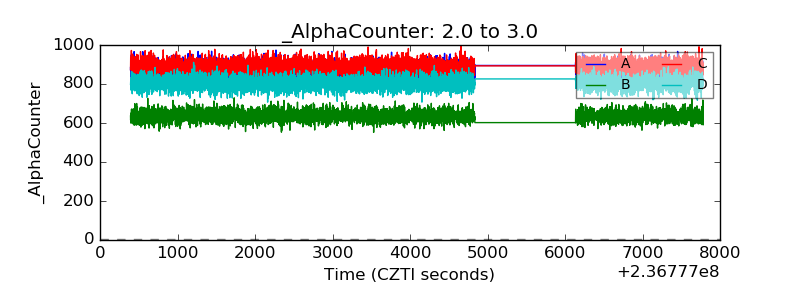 |
| _CPM_Rate | 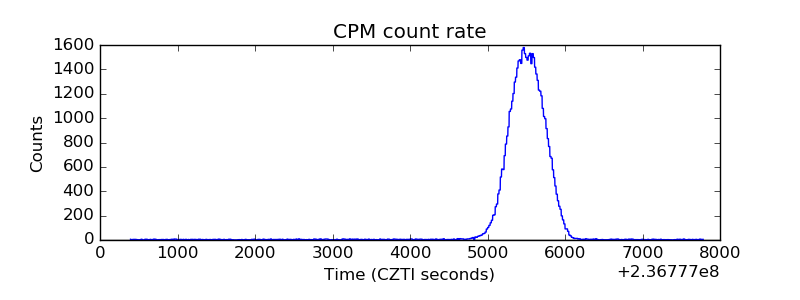 |
| CZT Counter | 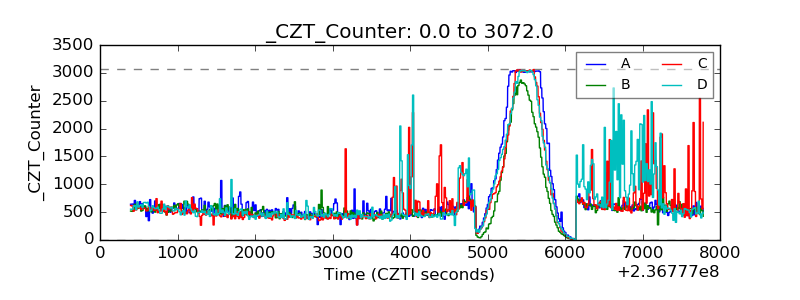 |
| +2.5 Volts monitor |  |
| +5 Volts monitor |  |
| _ROLL_ROT | 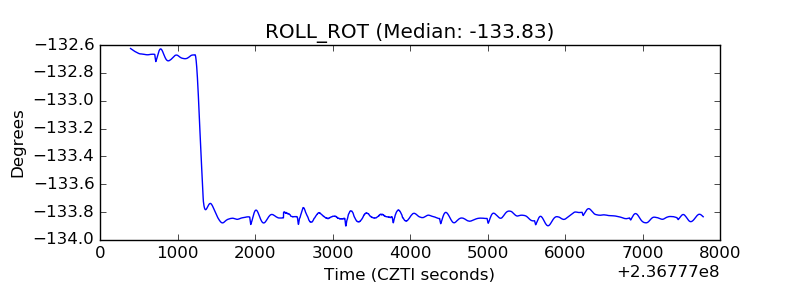 |
| _Roll_DEC |  |
| _Roll_RA | 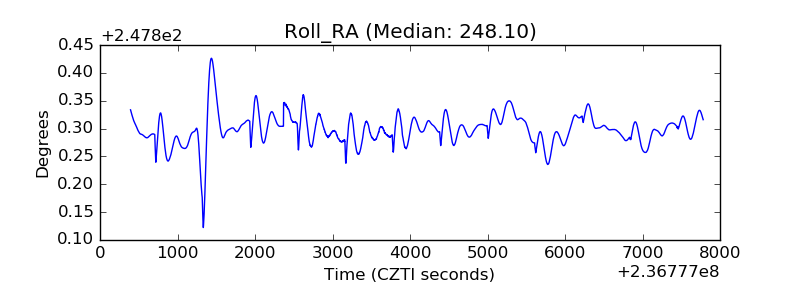 |
| Veto Counter | 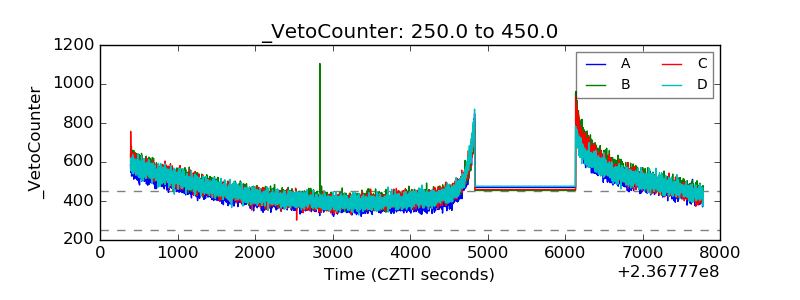 |