| Param | Original file | Final file |
|---|---|---|
| Filename | modeM0/AS1G07_049T01_9000001352_09539cztM0_level2.evt | modeM0/AS1G07_049T01_9000001352_09539cztM0_level2_quad_clean.evt |
| Size (bytes) | 503,305,920 | 118,820,160 |
| Size | 480.0 MB | 113.3 MB |
| Events in quadrant A | 3,115,589 | 822,482 |
| Events in quadrant B | 3,004,294 | 821,139 |
| Events in quadrant C | 4,351,330 | 776,575 |
| Events in quadrant D | 4,375,043 | 769,867 |
| Mode M9 | |||
|---|---|---|---|
| Quadrant | BADHDUFLAG | Total packets | Discarded packets |
| A | 0 | 13 | 0 |
| B | 0 | 13 | 0 |
| C | 0 | 13 | 0 |
| D | 0 | 13 | 0 |
| Mode M0 | |||
|---|---|---|---|
| Quadrant | BADHDUFLAG | Total packets | Discarded packets |
| A | 0 | 13006 | 2 |
| B | 0 | 12808 | 1 |
| C | 0 | 16844 | 1 |
| D | 0 | 16860 | 1 |
| Mode SS | |||
|---|---|---|---|
| Quadrant | BADHDUFLAG | Total packets | Discarded packets |
| A | 0 | 118 | 0 |
| B | 0 | 118 | 0 |
| C | 0 | 118 | 0 |
| D | 0 | 118 | 0 |
| Quadrant | Total seconds | Saturated seconds | Saturation percentage |
|---|---|---|---|
| A | 5849 | 102 | 1.743888% |
| B | 5849 | 96 | 1.641306% |
| C | 5849 | 462 | 7.898786% |
| D | 5849 | 303 | 5.180373% |
Noise dominated data is calculated using 1-second bins in cleaned event files. If a bin has >2000 counts, and if more than 50% of those come from <1% of pixels, then it is considered to be noise-dominated and hence unusable.
| Quadrant | # 1 sec bins | Bins with >0 counts | Bins with >2000 counts | High rate bins dominated by noise | Noise dominated (total time) | Noise dominated (detector-on time) | Marked lightcurve |
|---|---|---|---|---|---|---|---|
| A | 7144 | 5850 | 1 | 1 | 0.01% | 0.02% | 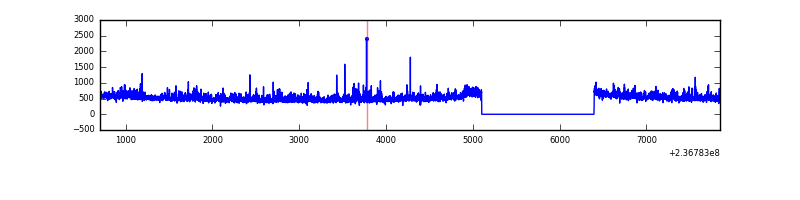 |
| B | 7144 | 5850 | 5 | 5 | 0.07% | 0.09% | 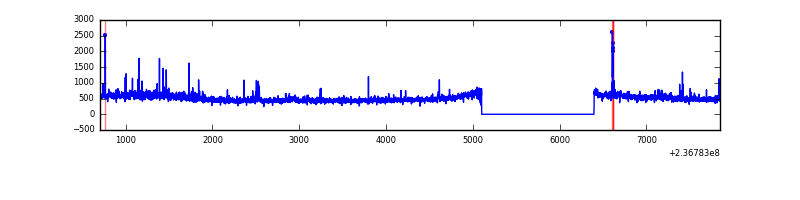 |
| C | 7144 | 5850 | 263 | 263 | 3.68% | 4.50% | 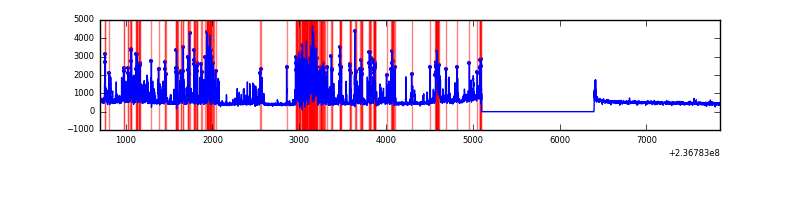 |
| D | 7144 | 5850 | 156 | 156 | 2.18% | 2.67% | 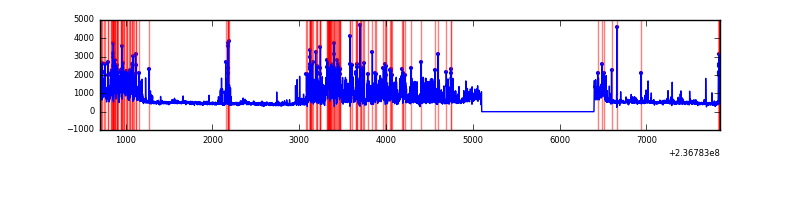 |
Top three noisy pixels from each quadrant. If the there are fewer than three noisy pixels in the level2.evt file, extra rows are filled as -1
| Pixel properties | Quadrant properties | ||||||
|---|---|---|---|---|---|---|---|
| Quadrant | DetID | PixID | Counts | Sigma | Mean | Median | Sigma |
| A | 1 | 162 | 159230 | 1100.77 | 725 | 712 | 144.0 |
| A | 1 | 178 | 60682 | 416.44 | 725 | 712 | 144.0 |
| A | 1 | 161 | 59809 | 410.38 | 725 | 712 | 144.0 |
| B | 0 | 214 | 123643 | 923.23 | 720 | 705 | 133.2 |
| B | 15 | 204 | 27231 | 199.2 | 720 | 705 | 133.2 |
| B | 0 | 219 | 20606 | 149.45 | 720 | 705 | 133.2 |
| C | 4 | 254 | 1723560 | 11298.75 | 672 | 675 | 152.5 |
| C | 13 | 61 | 5156 | 29.39 | 672 | 675 | 152.5 |
| C | 8 | 222 | 2605 | 12.66 | 672 | 675 | 152.5 |
| D | 1 | 52 | 1525962 | 8348.23 | 680 | 666 | 182.7 |
| D | 8 | 195 | 60495 | 327.46 | 680 | 666 | 182.7 |
| D | 12 | 233 | 51565 | 278.58 | 680 | 666 | 182.7 |
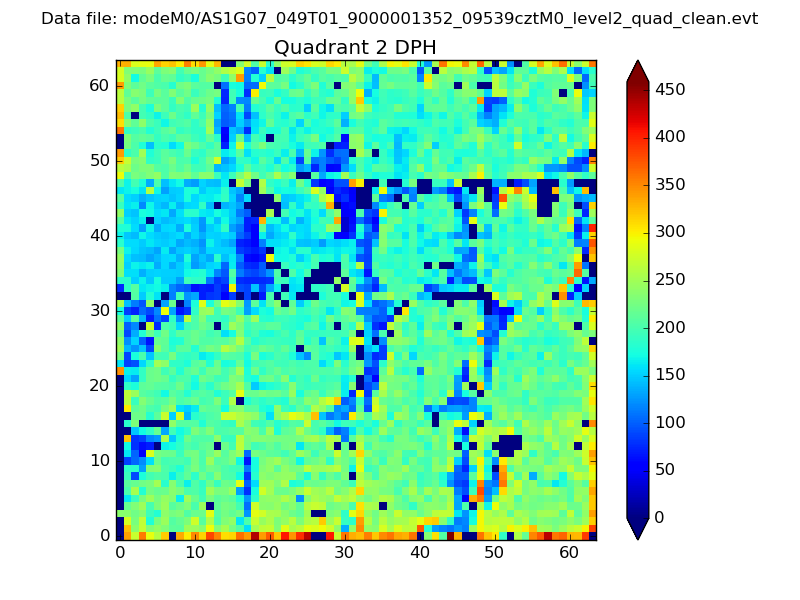
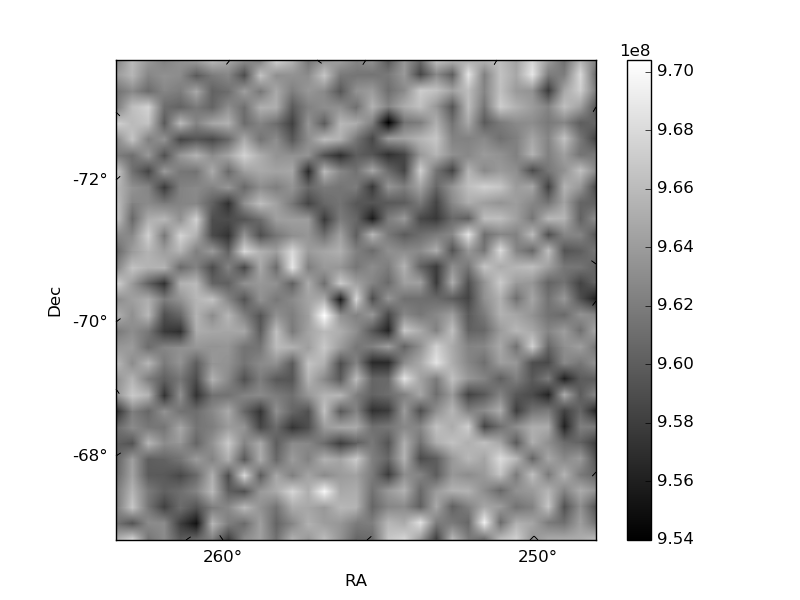
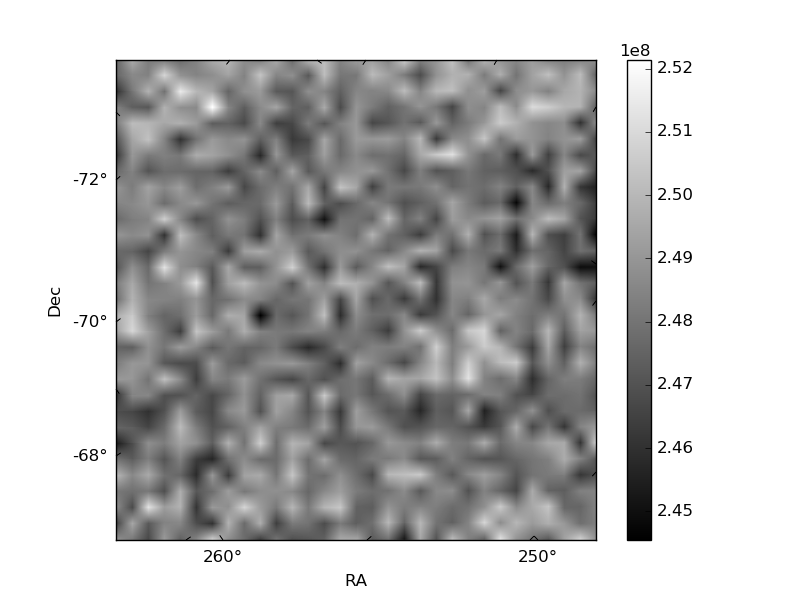
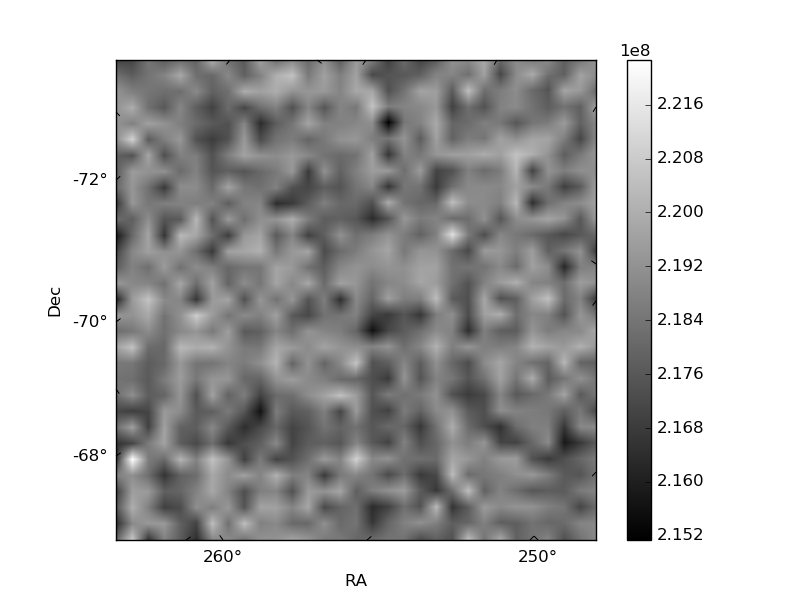
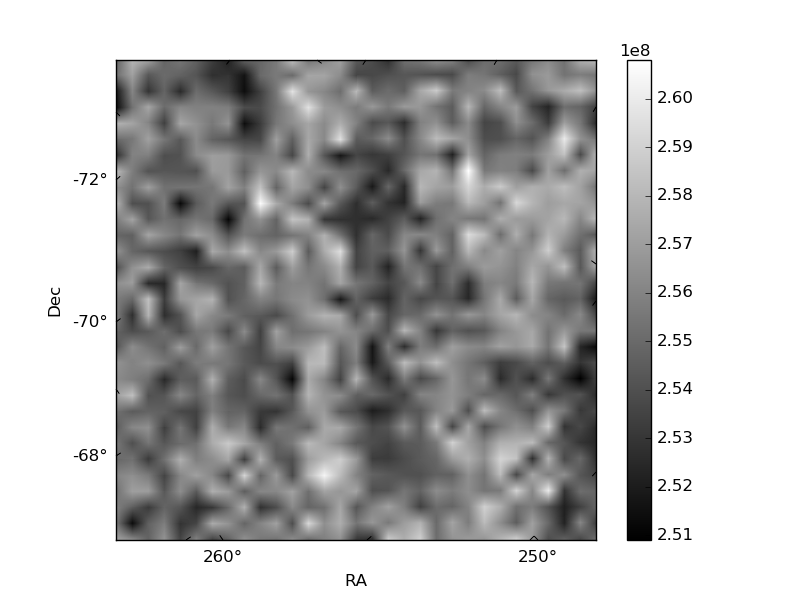
Histogram calculated using DETX and DETY for each event in the final _common_clean file
| Quadrant A | 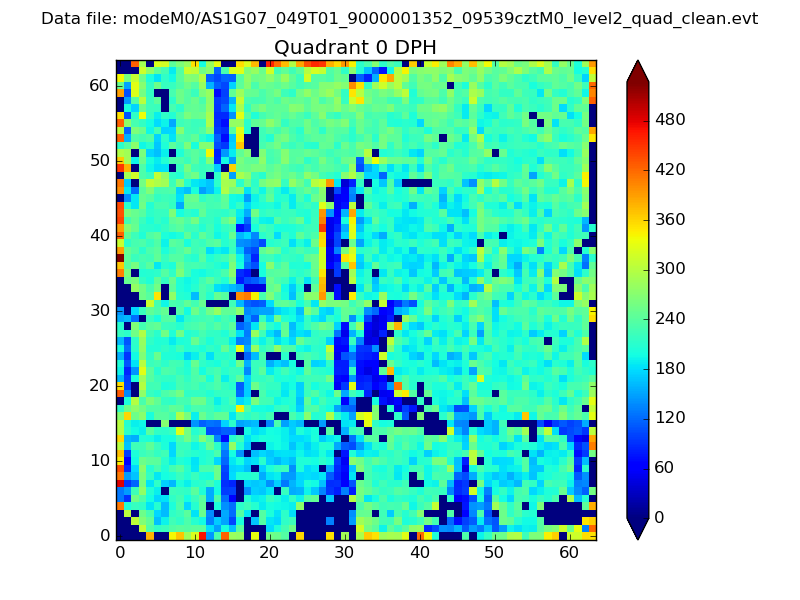 |
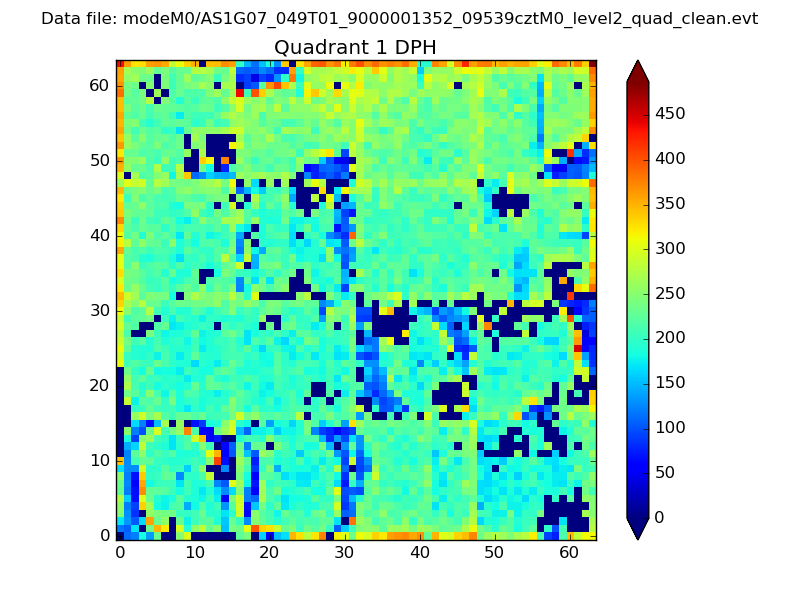 |
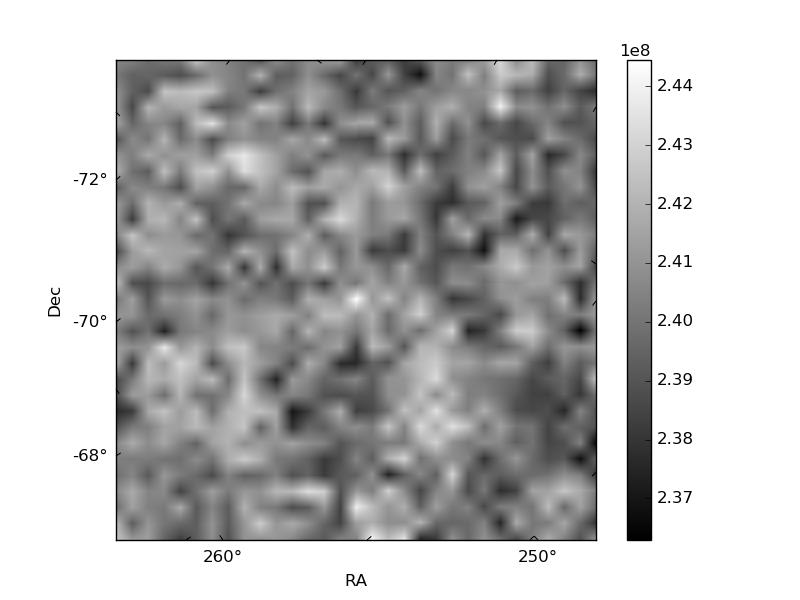
Quadrant B |
|---|---|---|---|
| Quadrant D | 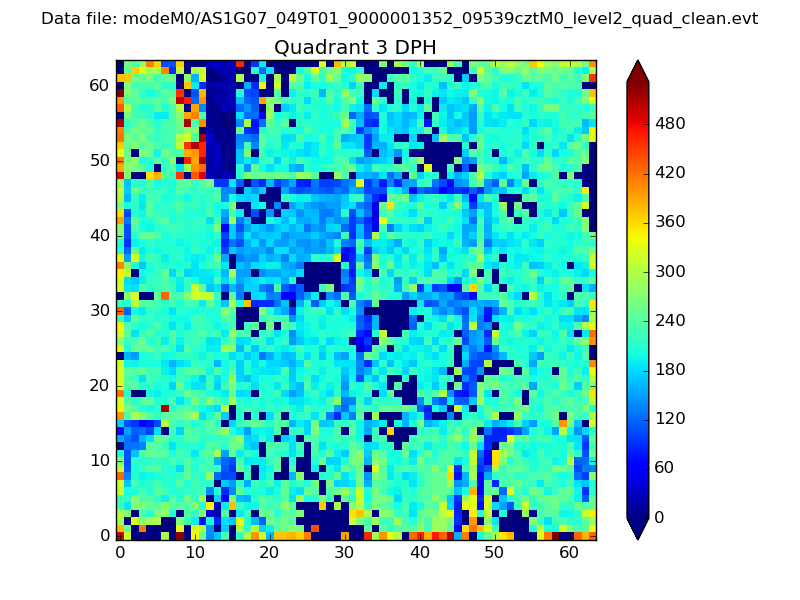 |
 |
Quadrant C |
| Plot type | Count rate plots | Images |
|---|---|---|
| Comparison with Poisson distribution Blue bars denote a histogram of data divided into 1 sec bins. Red curve is a Poisson curve with rate = median count rate of data. |
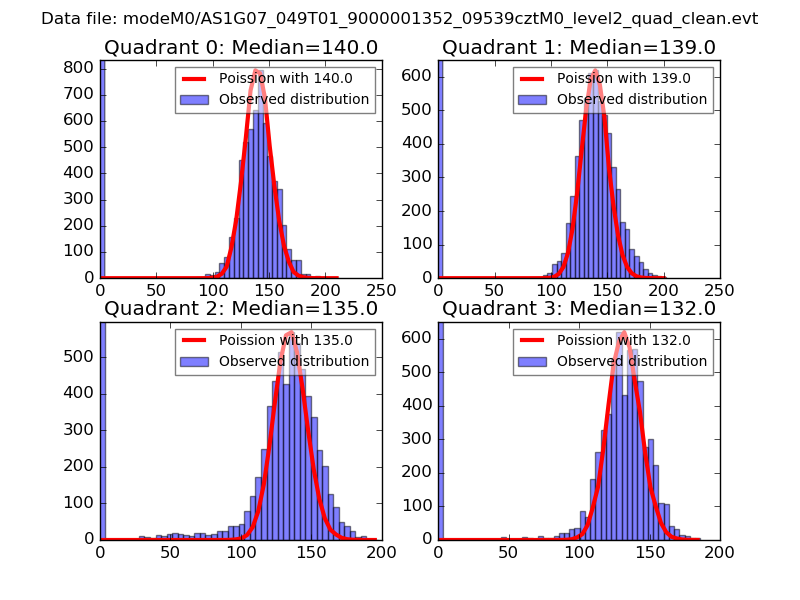 |
 |
| Quadrant-wise count rates Data is divided into 100 sec bins |
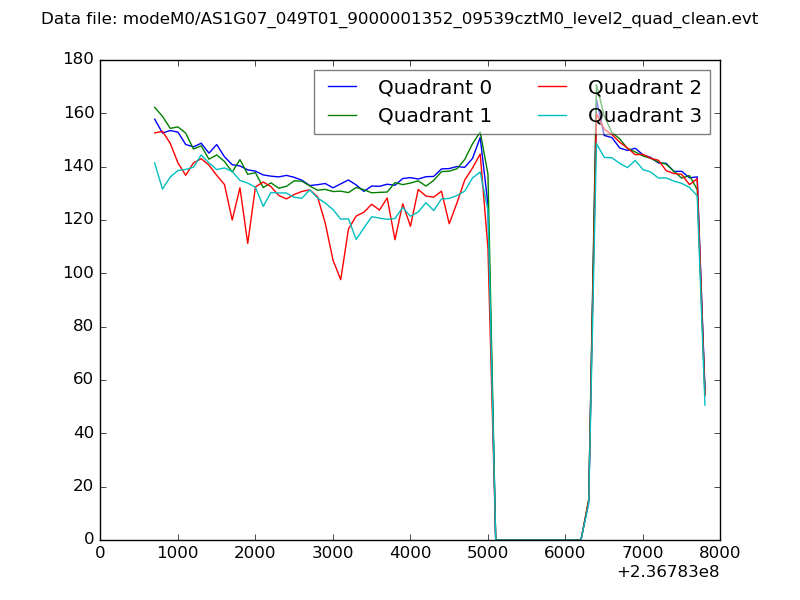 |
|
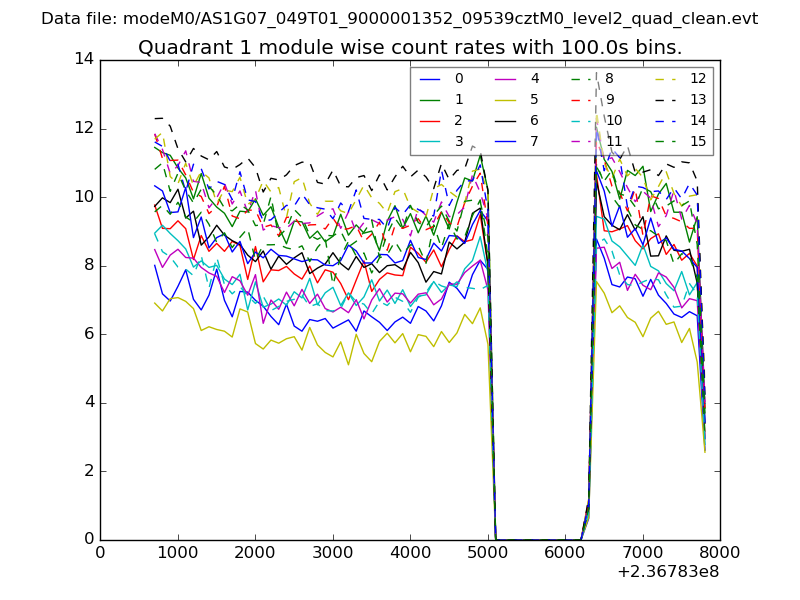
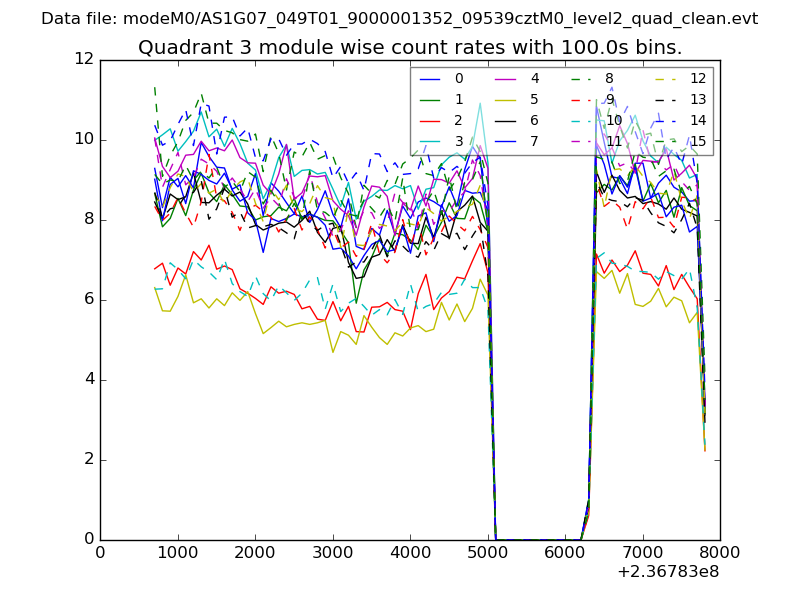
| Module-wise count rates for Quadrant A Data is divided into 100 sec bins |
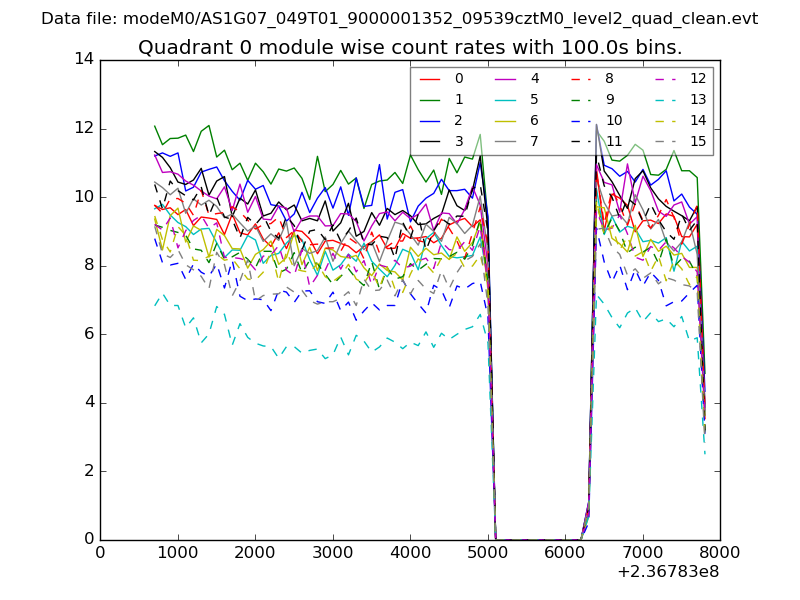 |
 |
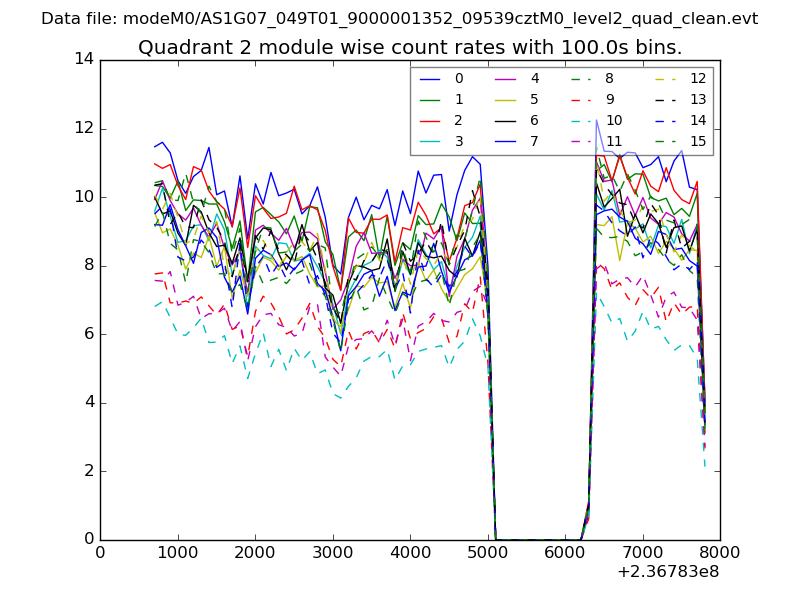
| Module-wise count rates for Quadrant B Data is divided into 100 sec bins |
 |
 |
| Module-wise count rates for Quadrant C Data is divided into 100 sec bins |
 |
 |
| Module-wise count rates for Quadrant D Data is divided into 100 sec bins |
 |
 |
| Parameter | Plot |
|---|---|
| CZT HV Monitor | 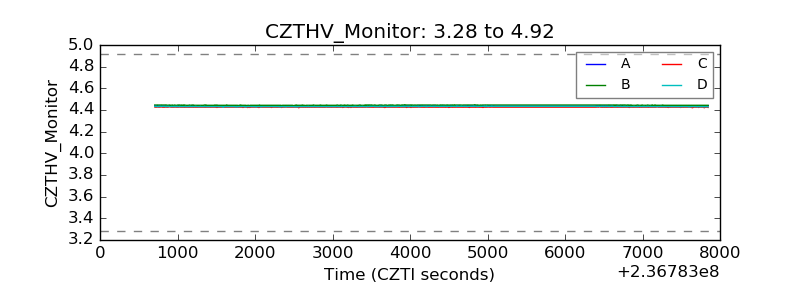 |
| D_VDD | 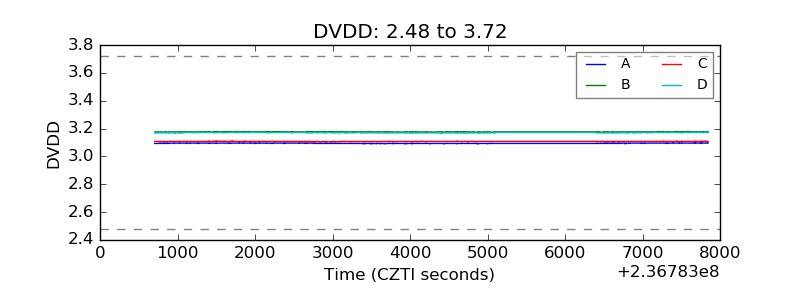 |
| Temperature 1 |  |
| Veto HV Monitor | 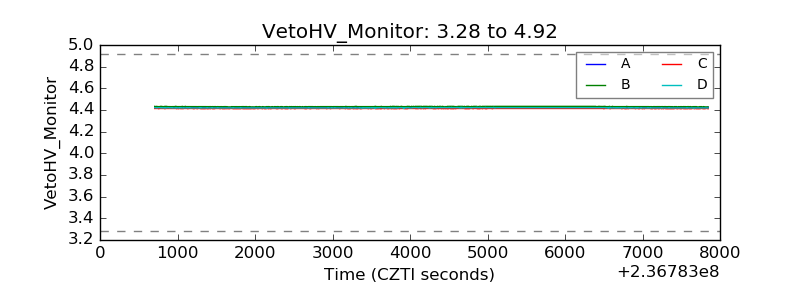 |
| Veto LLD | 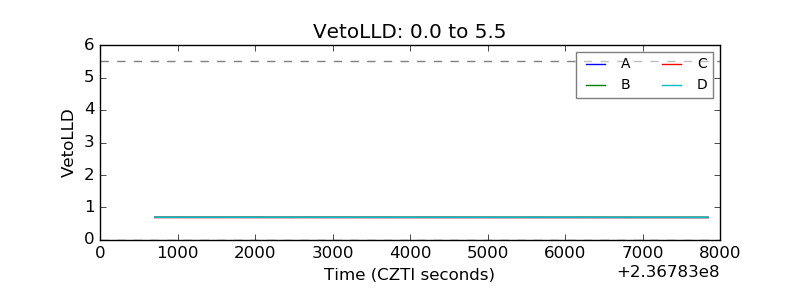 |
| Alpha Counter | 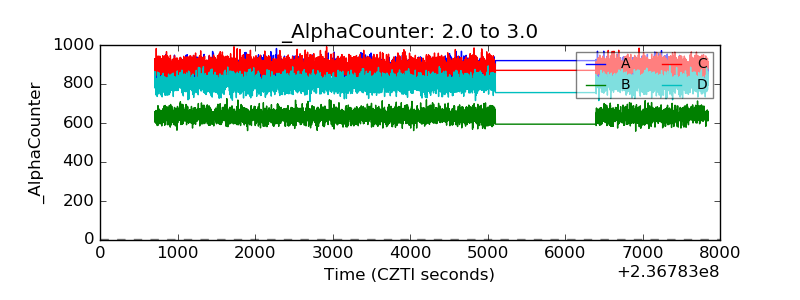 |
| _CPM_Rate | 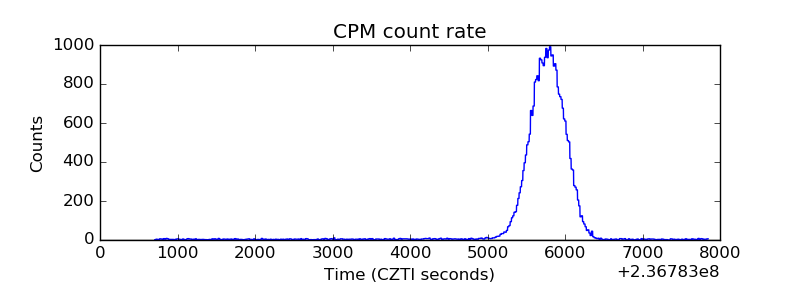 |
| CZT Counter | 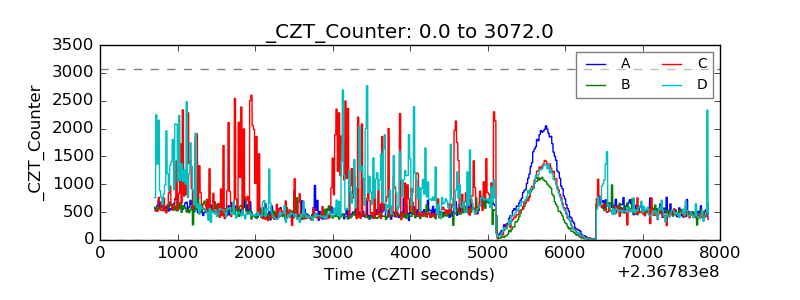 |
| +2.5 Volts monitor |  |
| +5 Volts monitor |  |
| _ROLL_ROT | 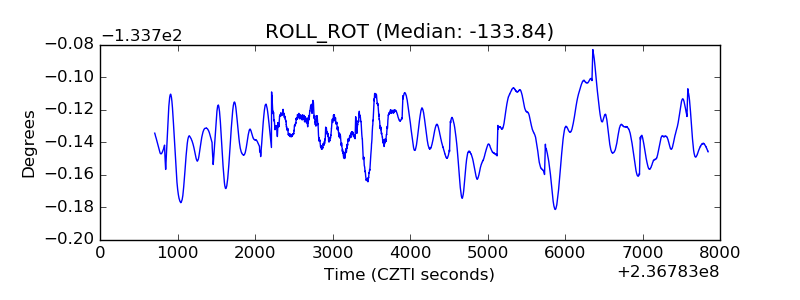 |
| _Roll_DEC |  |
| _Roll_RA | 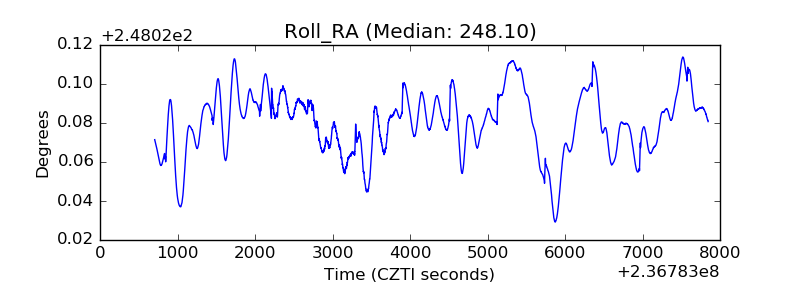 |
| Veto Counter | 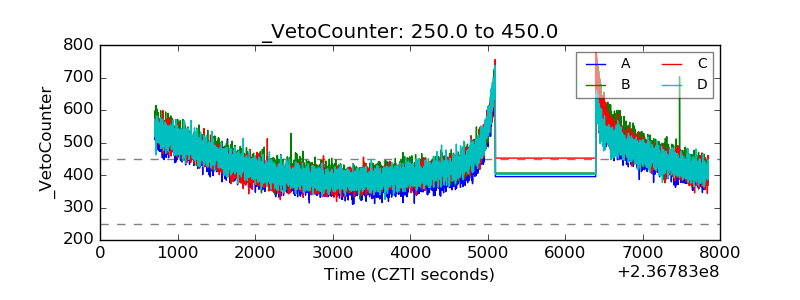 |