| Param | Original file | Final file |
|---|---|---|
| Filename | modeM0/AS1G07_049T01_9000001352_09540cztM0_level2.evt | modeM0/AS1G07_049T01_9000001352_09540cztM0_level2_quad_clean.evt |
| Size (bytes) | 437,662,080 | 118,088,640 |
| Size | 417.4 MB | 112.6 MB |
| Events in quadrant A | 3,125,664 | 804,596 |
| Events in quadrant B | 3,089,824 | 800,112 |
| Events in quadrant C | 2,735,877 | 787,219 |
| Events in quadrant D | 3,890,992 | 761,098 |
| Mode M9 | |||
|---|---|---|---|
| Quadrant | BADHDUFLAG | Total packets | Discarded packets |
| A | 0 | 11 | 0 |
| B | 0 | 11 | 0 |
| C | 0 | 11 | 0 |
| D | 0 | 11 | 0 |
| Mode M0 | |||
|---|---|---|---|
| Quadrant | BADHDUFLAG | Total packets | Discarded packets |
| A | 0 | 13195 | 3 |
| B | 0 | 13199 | 2 |
| C | 0 | 12490 | 2 |
| D | 0 | 15682 | 2 |
| Mode SS | |||
|---|---|---|---|
| Quadrant | BADHDUFLAG | Total packets | Discarded packets |
| A | 0 | 124 | 0 |
| B | 0 | 124 | 0 |
| C | 0 | 124 | 0 |
| D | 0 | 124 | 0 |
| Quadrant | Total seconds | Saturated seconds | Saturation percentage |
|---|---|---|---|
| A | 6064 | 71 | 1.170844% |
| B | 6064 | 82 | 1.352243% |
| C | 6064 | 51 | 0.841029% |
| D | 6064 | 189 | 3.116755% |
Noise dominated data is calculated using 1-second bins in cleaned event files. If a bin has >2000 counts, and if more than 50% of those come from <1% of pixels, then it is considered to be noise-dominated and hence unusable.
| Quadrant | # 1 sec bins | Bins with >0 counts | Bins with >2000 counts | High rate bins dominated by noise | Noise dominated (total time) | Noise dominated (detector-on time) | Marked lightcurve |
|---|---|---|---|---|---|---|---|
| A | 7189 | 6067 | 1 | 1 | 0.01% | 0.02% | 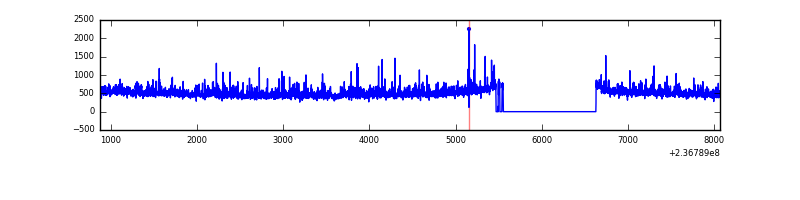 |
| B | 7189 | 6066 | 14 | 14 | 0.19% | 0.23% | 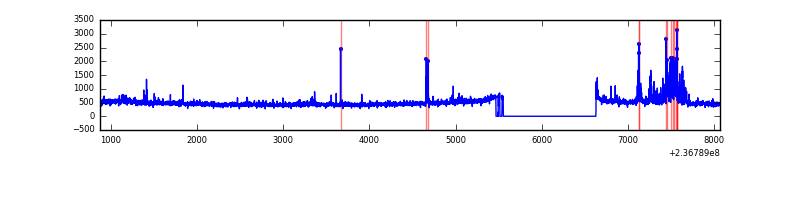 |
| C | 7189 | 6067 | 11 | 11 | 0.15% | 0.18% | 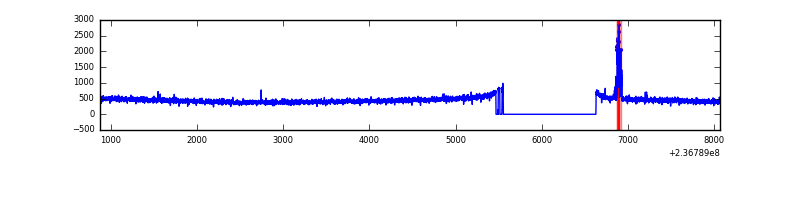 |
| D | 7189 | 6066 | 219 | 219 | 3.05% | 3.61% | 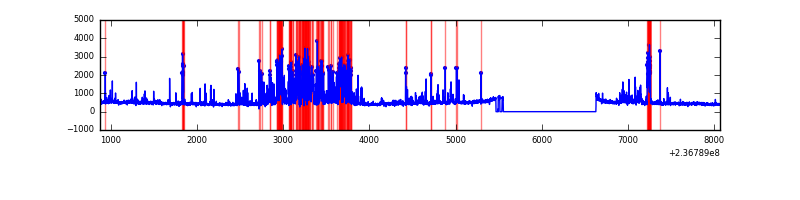 |
Top three noisy pixels from each quadrant. If the there are fewer than three noisy pixels in the level2.evt file, extra rows are filled as -1
| Pixel properties | Quadrant properties | ||||||
|---|---|---|---|---|---|---|---|
| Quadrant | DetID | PixID | Counts | Sigma | Mean | Median | Sigma |
| A | 1 | 162 | 170294 | 1164.73 | 718 | 704 | 145.6 |
| A | 1 | 178 | 67244 | 456.99 | 718 | 704 | 145.6 |
| A | 1 | 161 | 67210 | 456.76 | 718 | 704 | 145.6 |
| B | 4 | 80 | 213973 | 1607.26 | 717 | 701 | 132.7 |
| B | 0 | 214 | 28595 | 210.21 | 717 | 701 | 132.7 |
| B | 0 | 246 | 15777 | 113.62 | 717 | 701 | 132.7 |
| C | 4 | 254 | 55497 | 347.34 | 686 | 689 | 157.8 |
| C | 13 | 61 | 5269 | 29.03 | 686 | 689 | 157.8 |
| C | 8 | 222 | 2907 | 14.06 | 686 | 689 | 157.8 |
| D | 1 | 52 | 1125007 | 6130.7 | 681 | 664 | 183.4 |
| D | 8 | 195 | 45677 | 245.44 | 681 | 664 | 183.4 |
| D | 7 | 55 | 27791 | 147.91 | 681 | 664 | 183.4 |
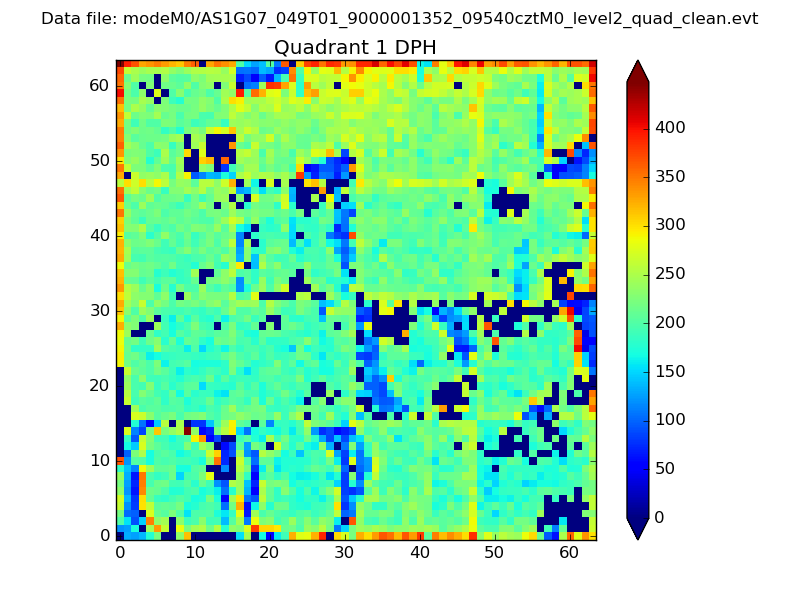
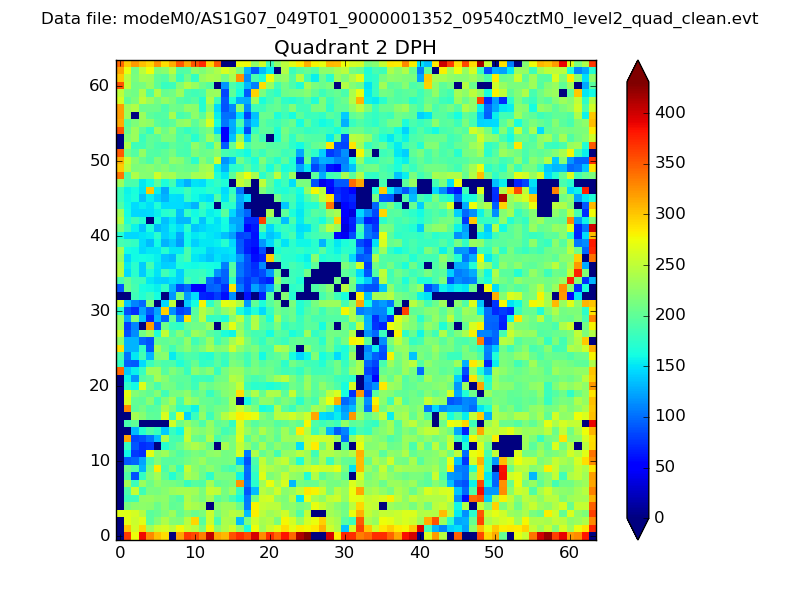
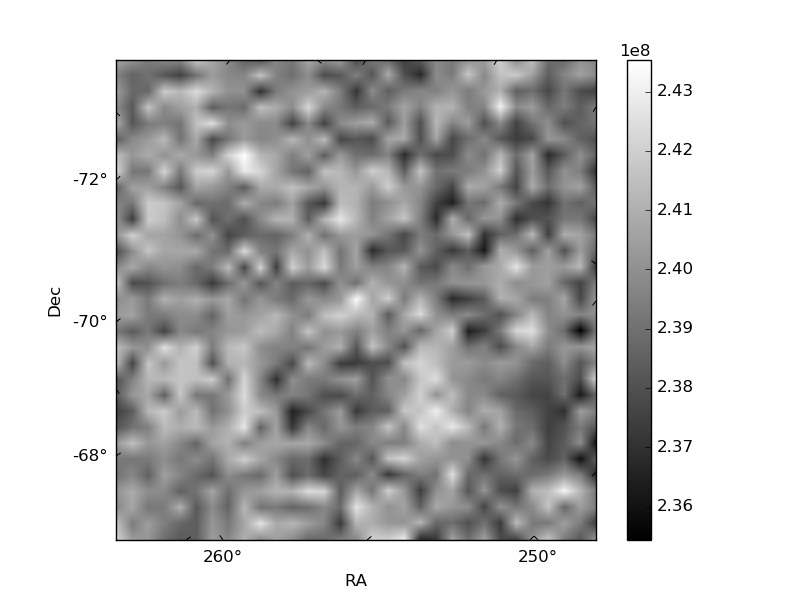
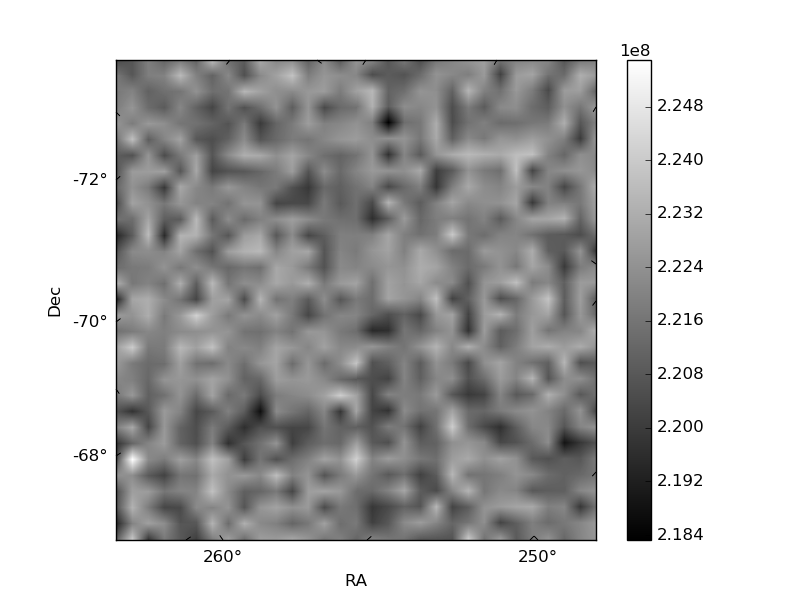
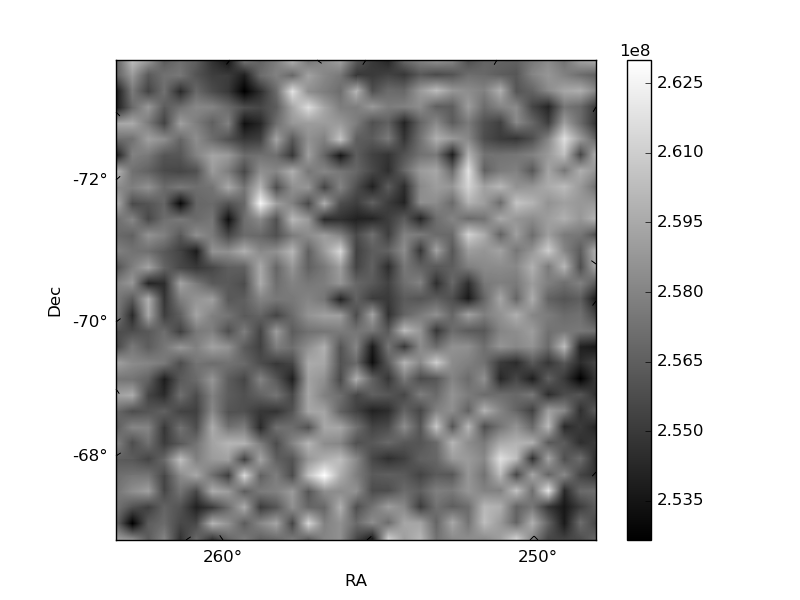
Histogram calculated using DETX and DETY for each event in the final _common_clean file
| Quadrant A |  |
 |
Quadrant B |
|---|---|---|---|
| Quadrant D |  |
 |
Quadrant C |
| Plot type | Count rate plots | Images |
|---|---|---|
| Comparison with Poisson distribution Blue bars denote a histogram of data divided into 1 sec bins. Red curve is a Poisson curve with rate = median count rate of data. |
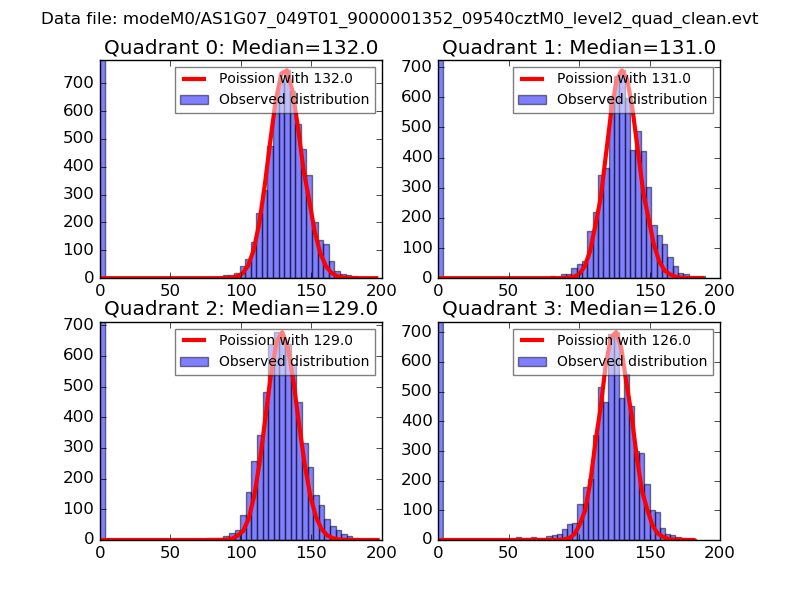 |
 |
| Quadrant-wise count rates Data is divided into 100 sec bins |
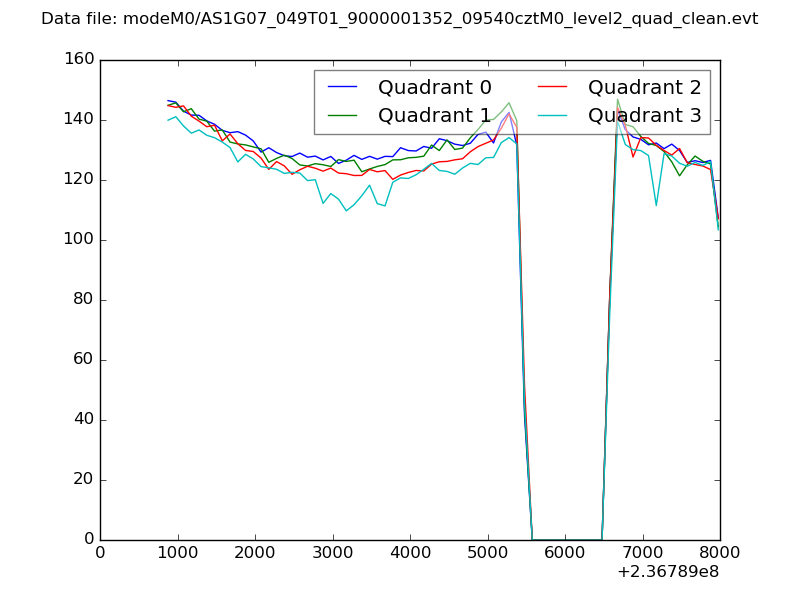 |
|
| Module-wise count rates for Quadrant A Data is divided into 100 sec bins |
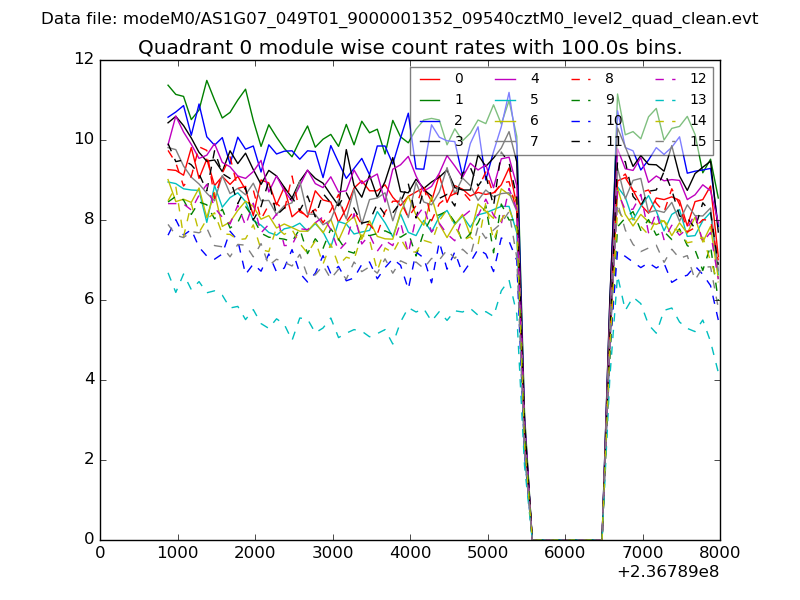 |
 |
| Module-wise count rates for Quadrant B Data is divided into 100 sec bins |
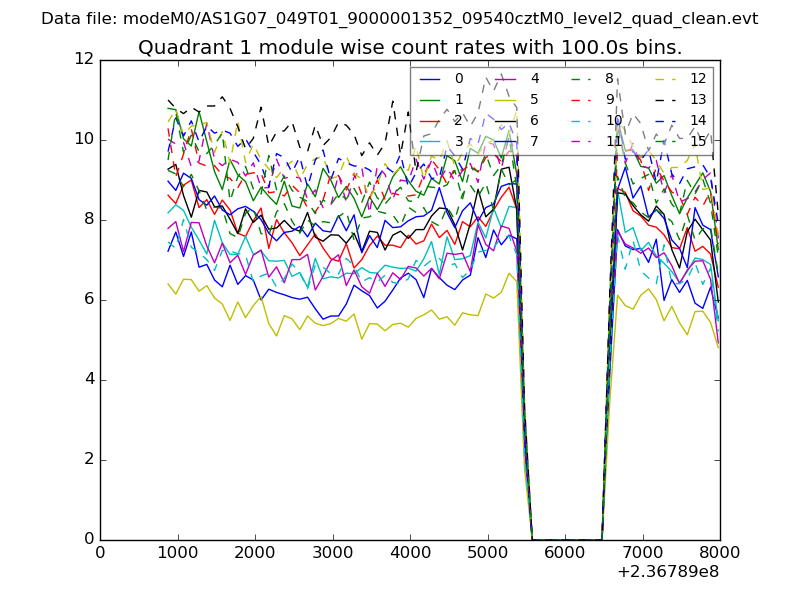 |
 |
| Module-wise count rates for Quadrant C Data is divided into 100 sec bins |
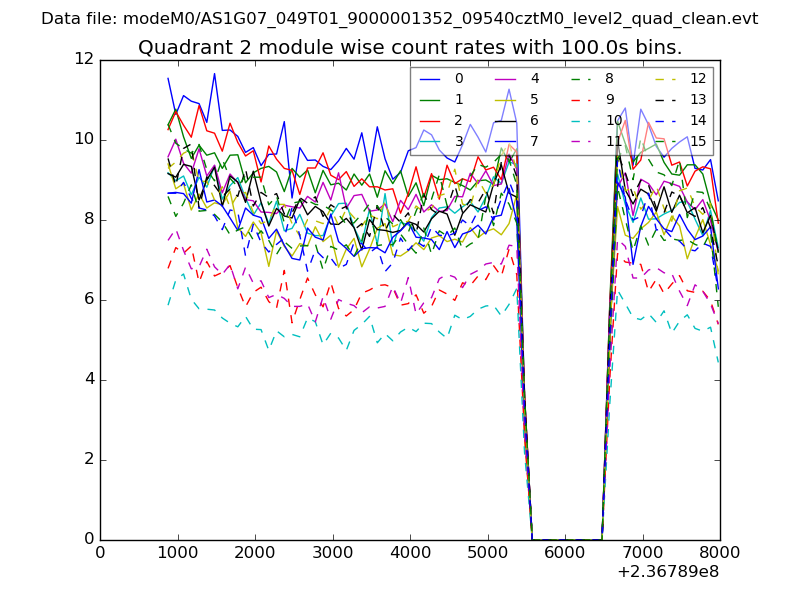 |
 |
| Module-wise count rates for Quadrant D Data is divided into 100 sec bins |
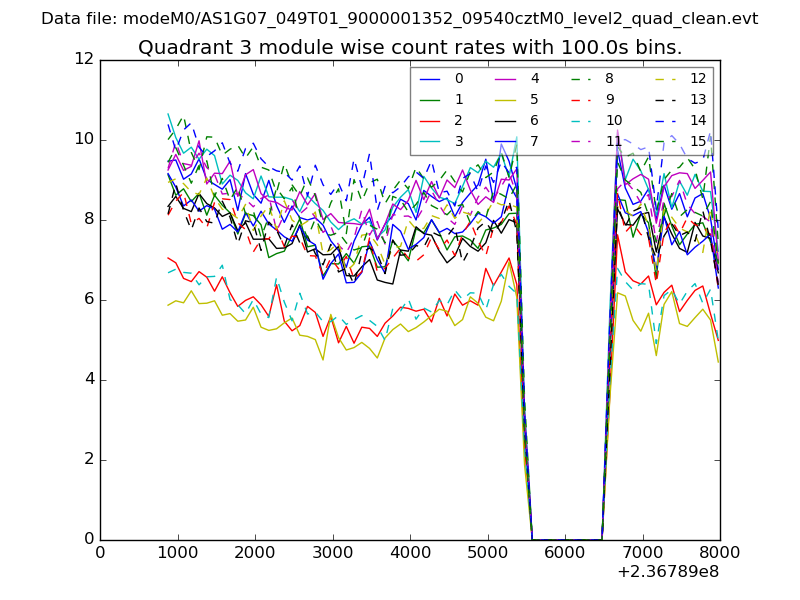 |
 |
| Parameter | Plot |
|---|---|
| CZT HV Monitor | 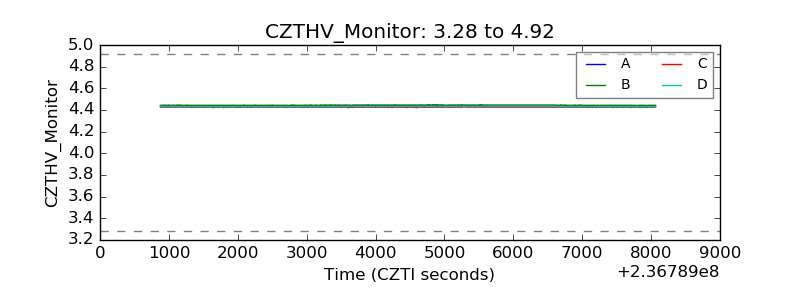 |
| D_VDD | 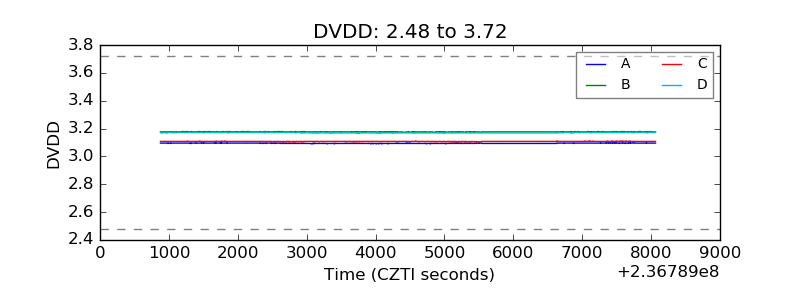 |
| Temperature 1 | 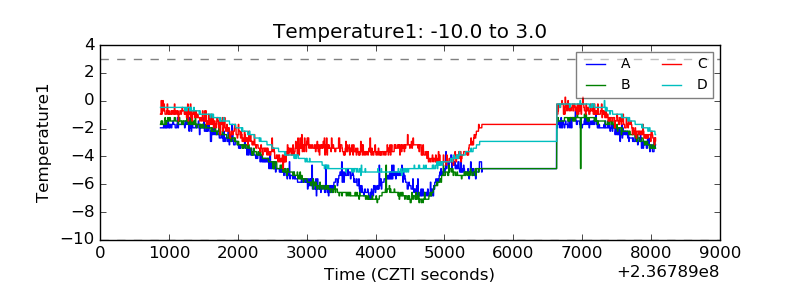 |
| Veto HV Monitor | 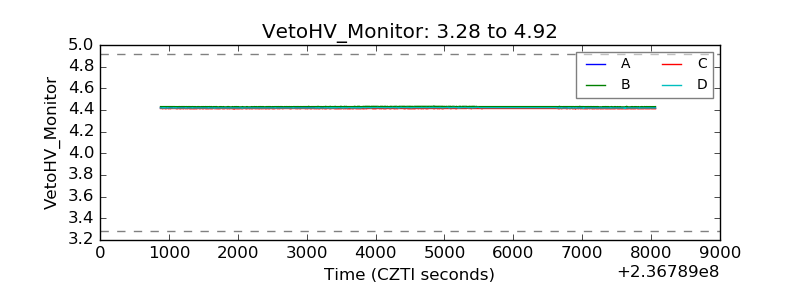 |
| Veto LLD |  |
| Alpha Counter | 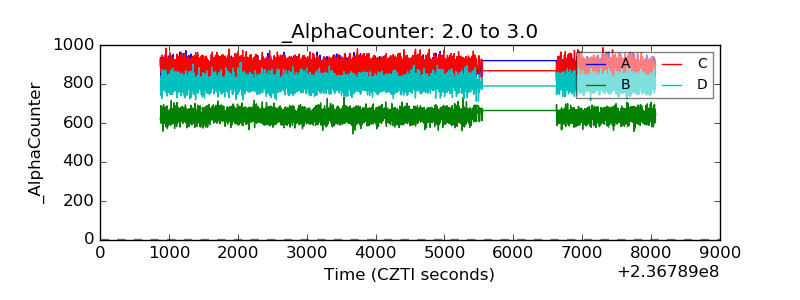 |
| _CPM_Rate | 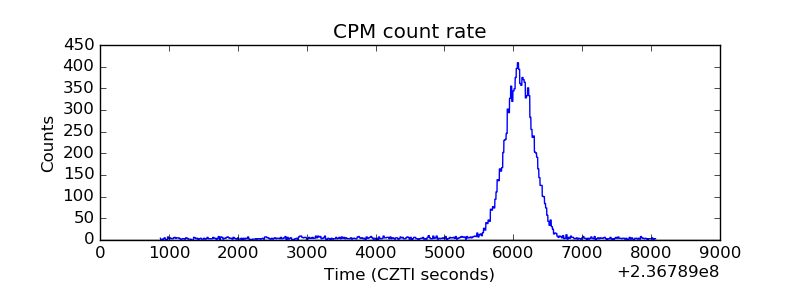 |
| CZT Counter | 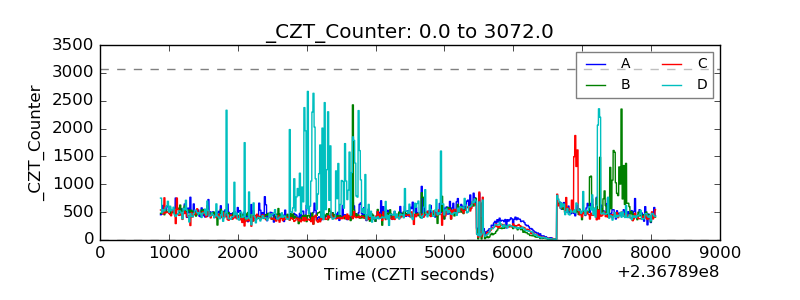 |
| +2.5 Volts monitor |  |
| +5 Volts monitor |  |
| _ROLL_ROT | 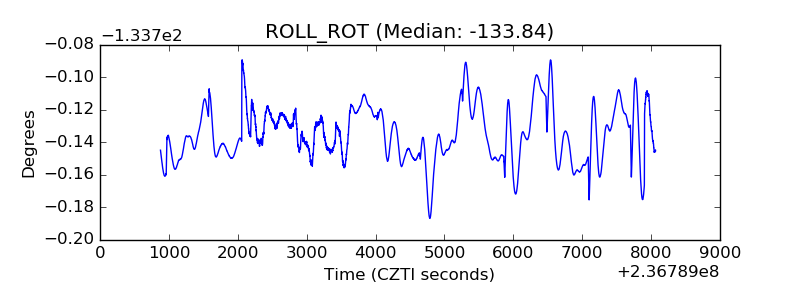 |
| _Roll_DEC | 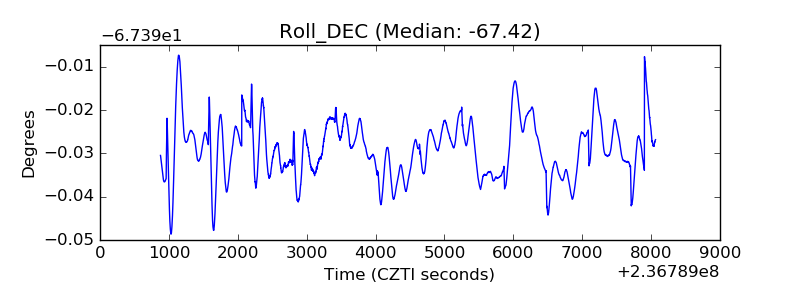 |
| _Roll_RA | 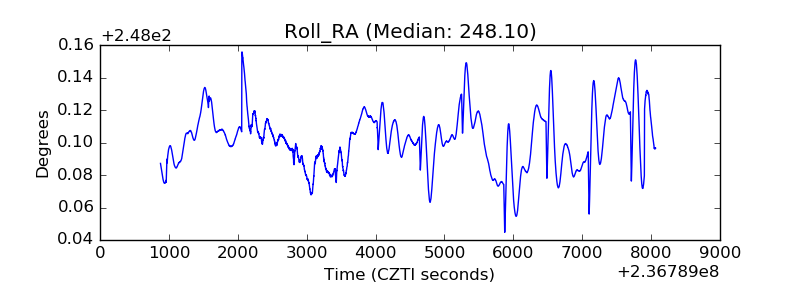 |
| Veto Counter | 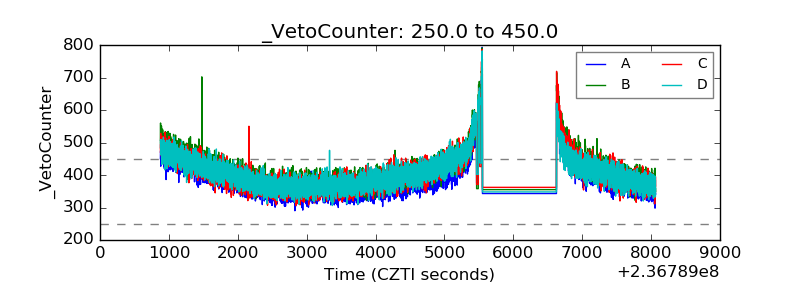 |