| Param | Original file | Final file |
|---|---|---|
| Filename | modeM0/AS1G07_049T01_9000001352_09541cztM0_level2.evt | modeM0/AS1G07_049T01_9000001352_09541cztM0_level2_quad_clean.evt |
| Size (bytes) | 483,266,880 | 128,185,920 |
| Size | 460.9 MB | 122.2 MB |
| Events in quadrant A | 3,429,105 | 867,498 |
| Events in quadrant B | 3,450,595 | 865,817 |
| Events in quadrant C | 3,825,598 | 840,320 |
| Events in quadrant D | 3,466,854 | 833,269 |
| Mode M9 | |||
|---|---|---|---|
| Quadrant | BADHDUFLAG | Total packets | Discarded packets |
| A | 0 | 10 | 0 |
| B | 0 | 10 | 0 |
| C | 0 | 10 | 0 |
| D | 0 | 11 | 0 |
| Mode M0 | |||
|---|---|---|---|
| Quadrant | BADHDUFLAG | Total packets | Discarded packets |
| A | 0 | 14654 | 5 |
| B | 0 | 14878 | 4 |
| C | 0 | 16272 | 2 |
| D | 0 | 14922 | 2 |
| Mode SS | |||
|---|---|---|---|
| Quadrant | BADHDUFLAG | Total packets | Discarded packets |
| A | 0 | 138 | 0 |
| B | 0 | 138 | 0 |
| C | 0 | 138 | 0 |
| D | 0 | 138 | 0 |
| Quadrant | Total seconds | Saturated seconds | Saturation percentage |
|---|---|---|---|
| A | 6827 | 43 | 0.629852% |
| B | 6827 | 76 | 1.113227% |
| C | 6828 | 199 | 2.914470% |
| D | 6828 | 71 | 1.039836% |
Noise dominated data is calculated using 1-second bins in cleaned event files. If a bin has >2000 counts, and if more than 50% of those come from <1% of pixels, then it is considered to be noise-dominated and hence unusable.
| Quadrant | # 1 sec bins | Bins with >0 counts | Bins with >2000 counts | High rate bins dominated by noise | Noise dominated (total time) | Noise dominated (detector-on time) | Marked lightcurve |
|---|---|---|---|---|---|---|---|
| A | 7588 | 6829 | 1 | 1 | 0.01% | 0.01% | 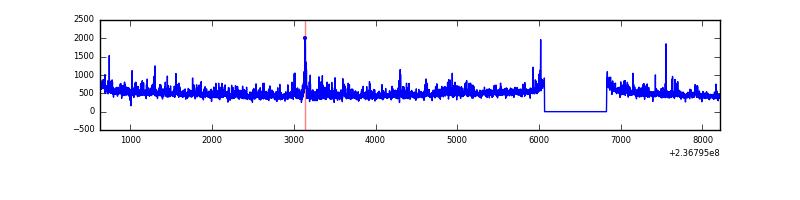 |
| B | 7588 | 6829 | 13 | 13 | 0.17% | 0.19% |  |
| C | 7588 | 6829 | 133 | 133 | 1.75% | 1.95% | 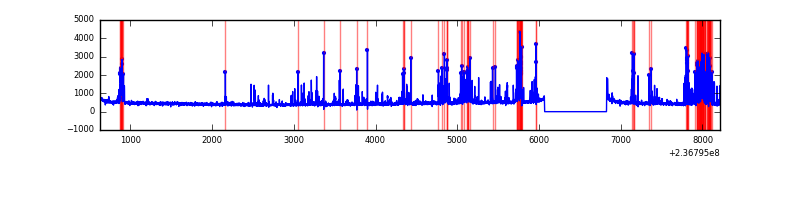 |
| D | 7588 | 6829 | 48 | 48 | 0.63% | 0.70% | 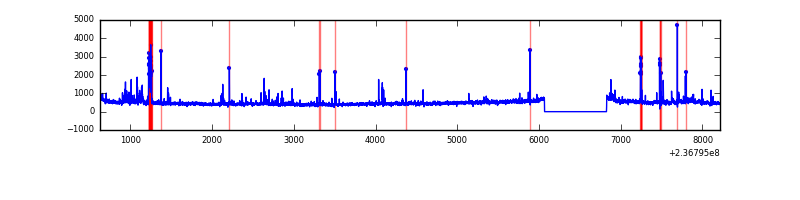 |
Top three noisy pixels from each quadrant. If the there are fewer than three noisy pixels in the level2.evt file, extra rows are filled as -1
| Pixel properties | Quadrant properties | ||||||
|---|---|---|---|---|---|---|---|
| Quadrant | DetID | PixID | Counts | Sigma | Mean | Median | Sigma |
| A | 1 | 162 | 160699 | 987.46 | 798 | 782 | 161.9 |
| A | 1 | 178 | 58495 | 356.37 | 798 | 782 | 161.9 |
| A | 1 | 161 | 58211 | 354.61 | 798 | 782 | 161.9 |
| B | 4 | 80 | 248904 | 1660.22 | 798 | 780 | 149.5 |
| B | 15 | 204 | 31686 | 206.79 | 798 | 780 | 149.5 |
| B | 0 | 214 | 24803 | 160.74 | 798 | 780 | 149.5 |
| C | 4 | 254 | 858983 | 4900.42 | 756 | 758 | 175.1 |
| C | 13 | 61 | 5978 | 29.8 | 756 | 758 | 175.1 |
| C | 14 | 238 | 5548 | 27.35 | 756 | 758 | 175.1 |
| D | 8 | 195 | 213533 | 1057.07 | 760 | 742 | 201.3 |
| D | 1 | 52 | 167353 | 827.67 | 760 | 742 | 201.3 |
| D | 13 | 104 | 58447 | 286.66 | 760 | 742 | 201.3 |
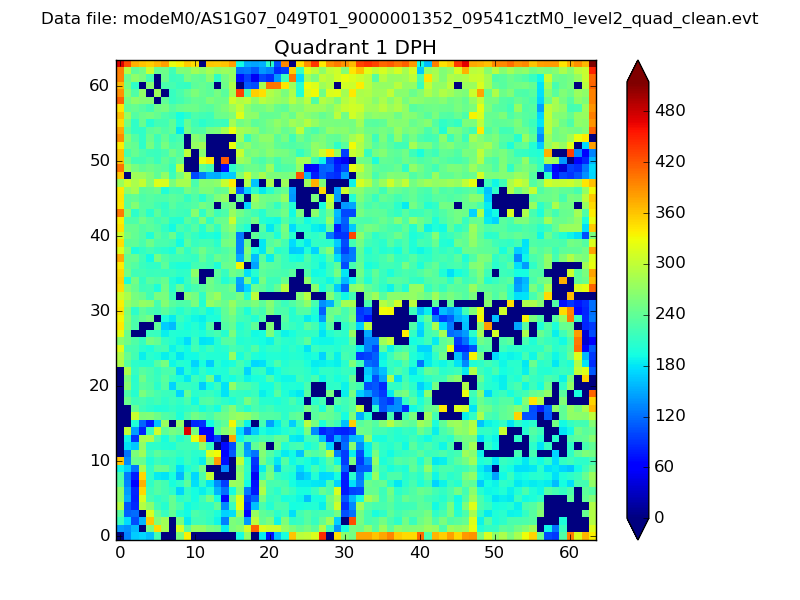
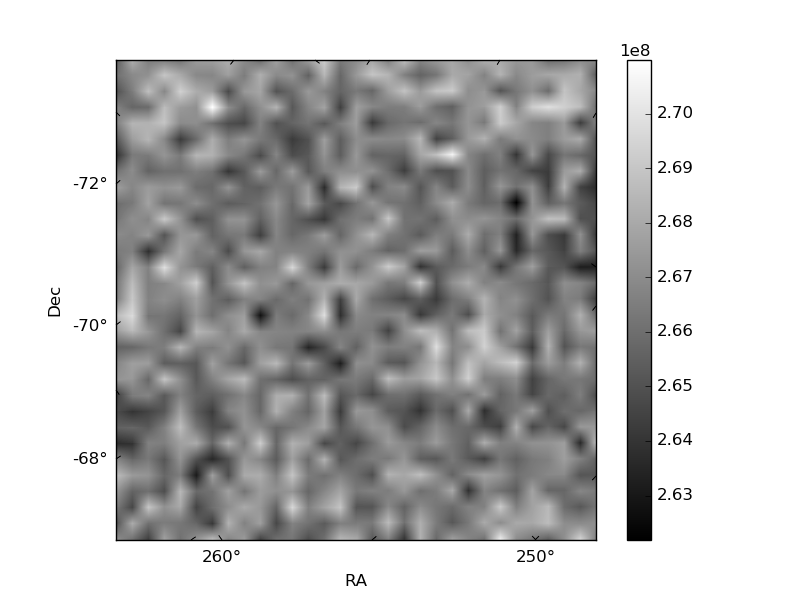
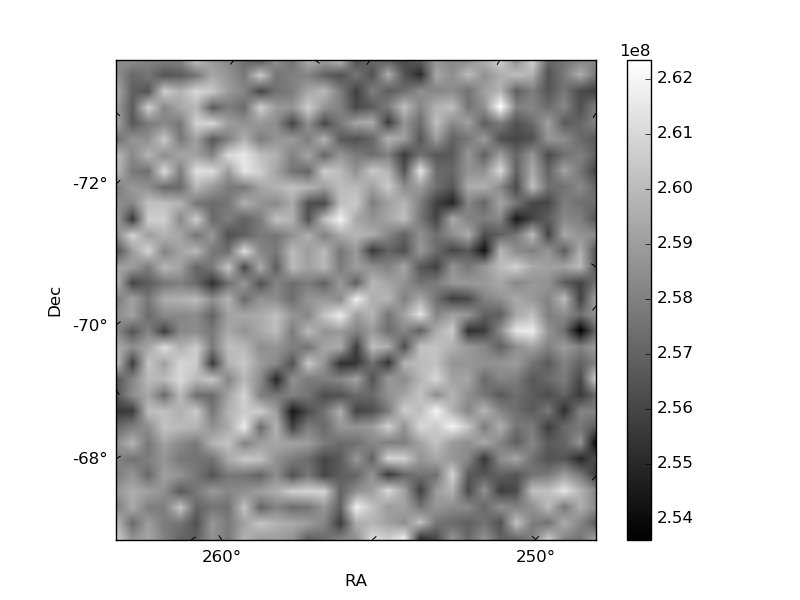
Histogram calculated using DETX and DETY for each event in the final _common_clean file
| Quadrant A | 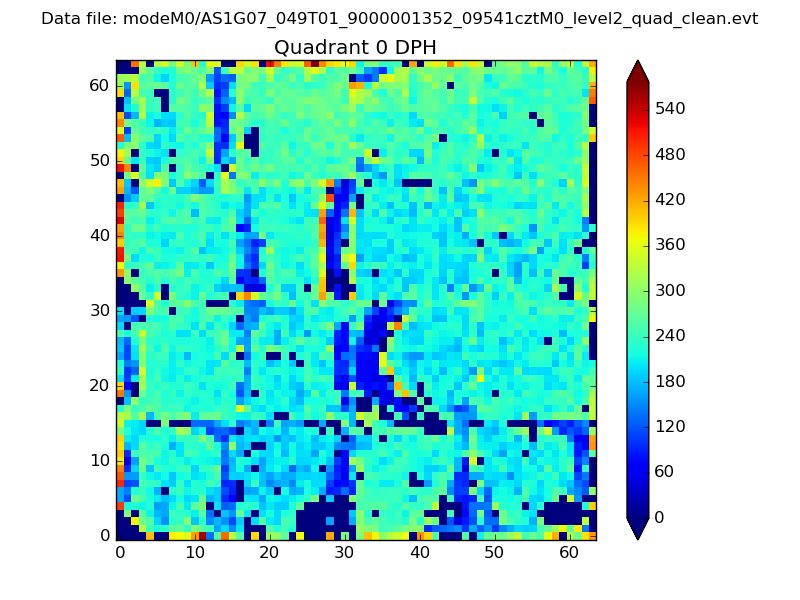 |
 |
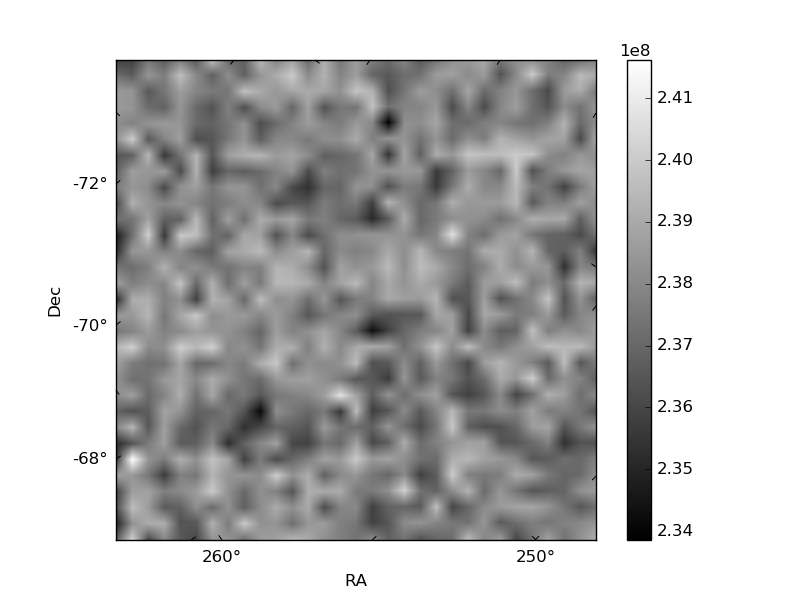
Quadrant B |
|---|---|---|---|
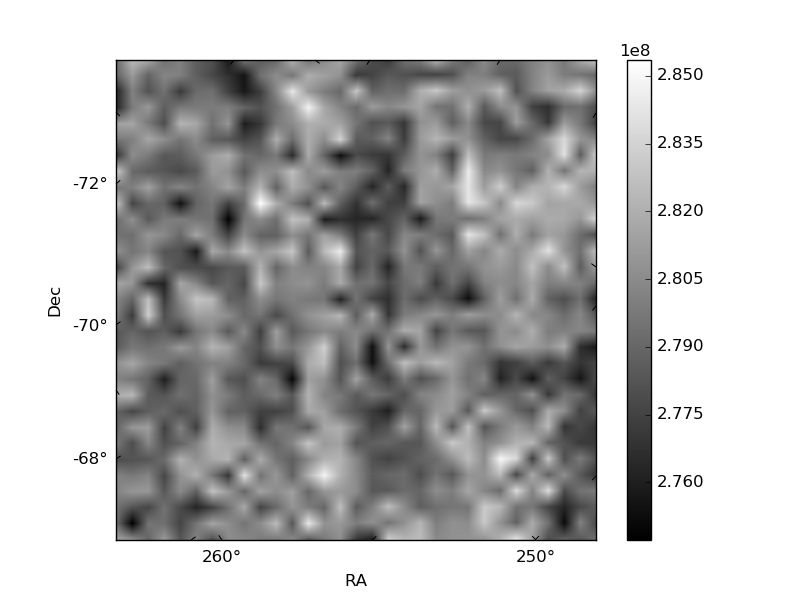
| Quadrant D |  |
 |
Quadrant C |
| Plot type | Count rate plots | Images |
|---|---|---|
| Comparison with Poisson distribution Blue bars denote a histogram of data divided into 1 sec bins. Red curve is a Poisson curve with rate = median count rate of data. |
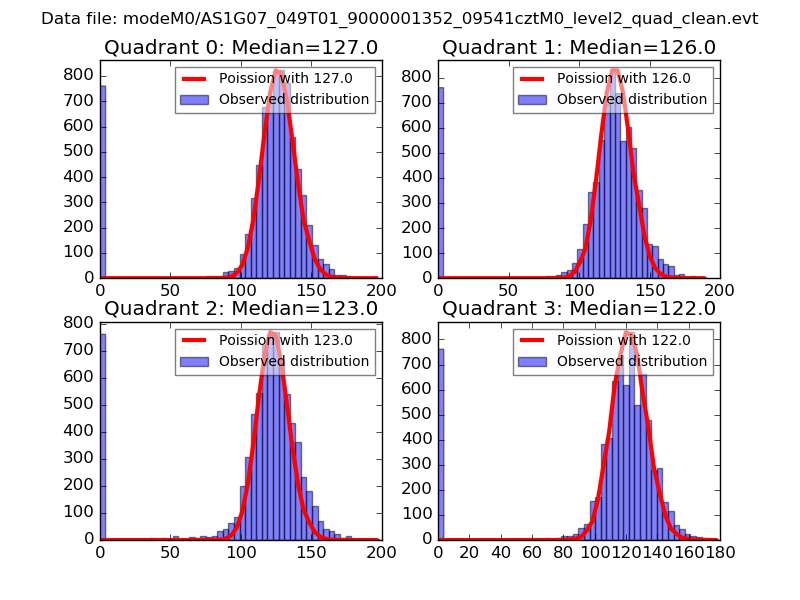 |
 |
| Quadrant-wise count rates Data is divided into 100 sec bins |
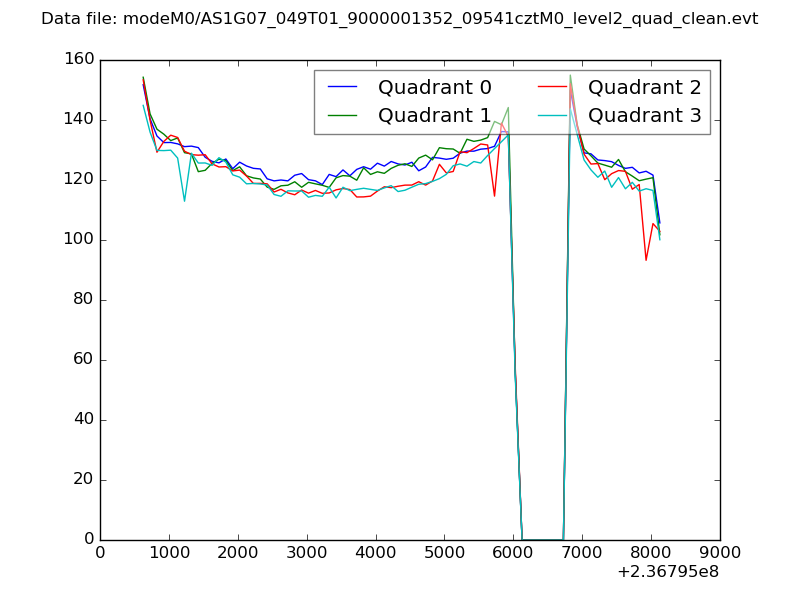 |
|
| Module-wise count rates for Quadrant A Data is divided into 100 sec bins |
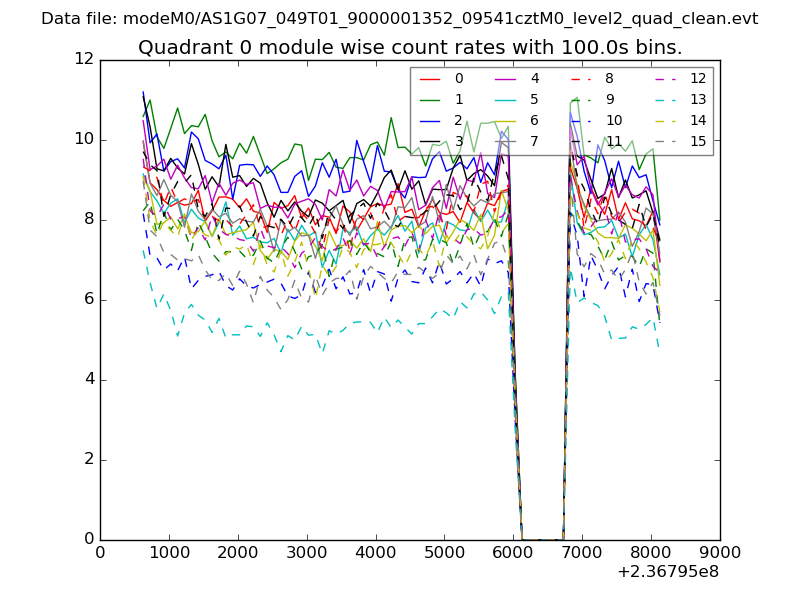 |
 |
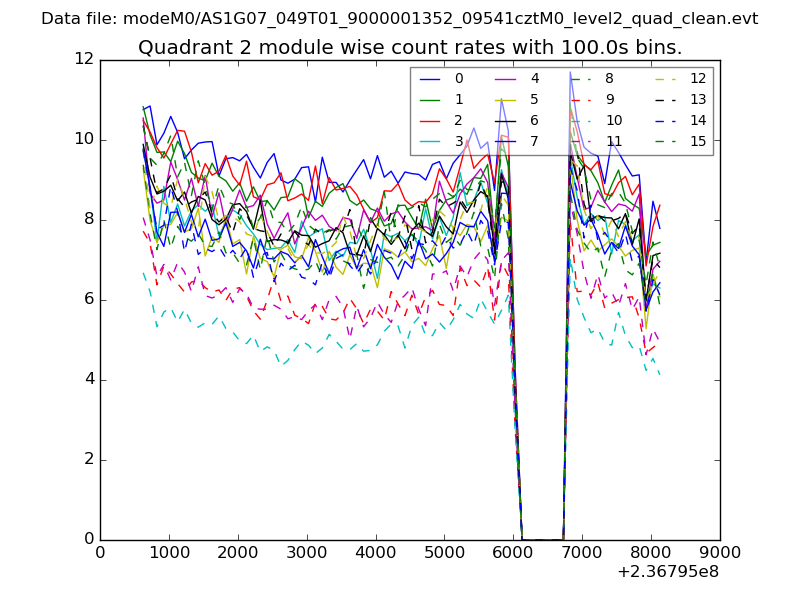
| Module-wise count rates for Quadrant B Data is divided into 100 sec bins |
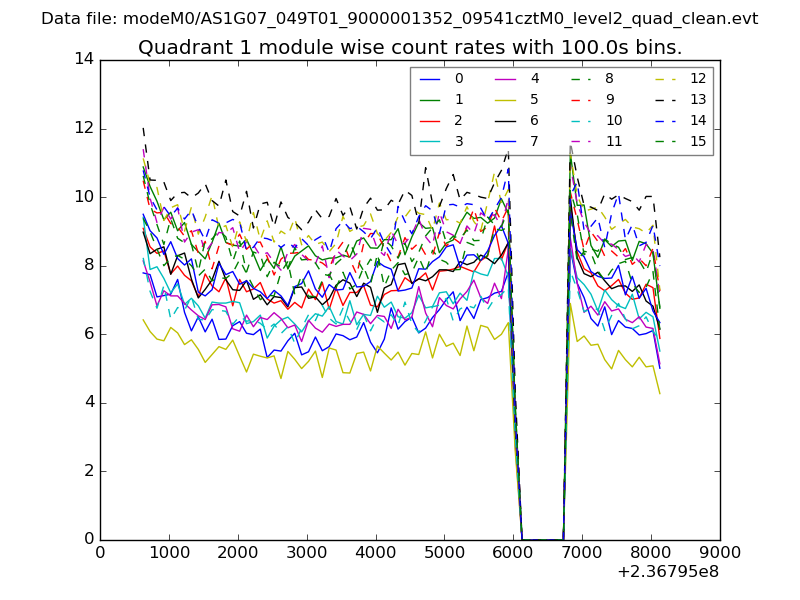 |
 |
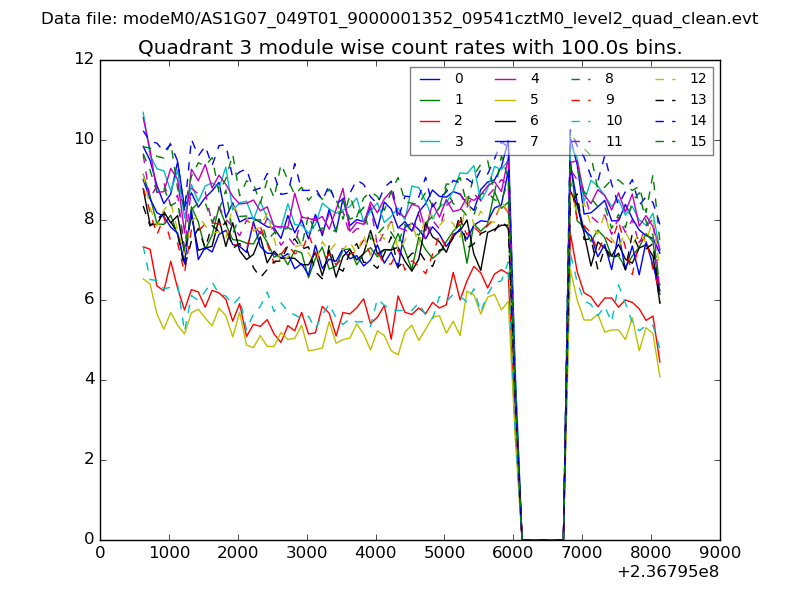
| Module-wise count rates for Quadrant C Data is divided into 100 sec bins |
 |
 |
| Module-wise count rates for Quadrant D Data is divided into 100 sec bins |
 |
 |
| Parameter | Plot |
|---|---|
| CZT HV Monitor | 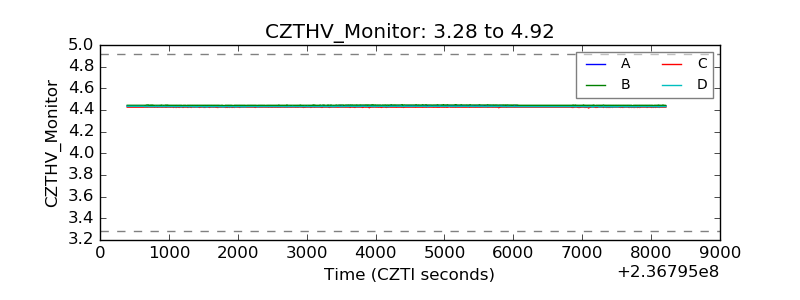 |
| D_VDD | 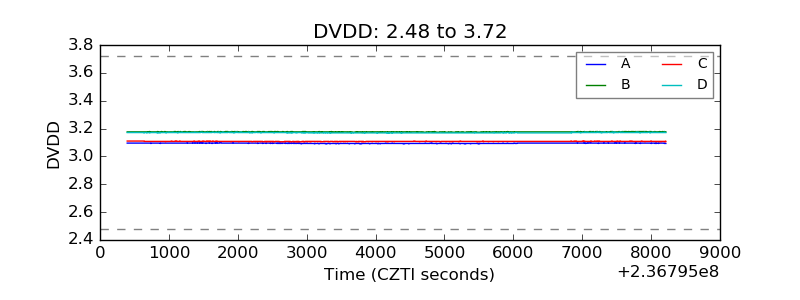 |
| Temperature 1 | 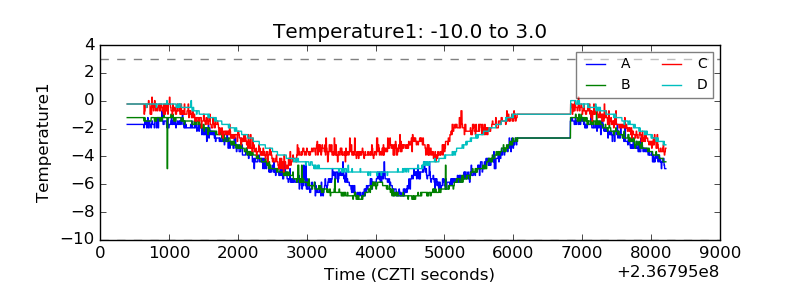 |
| Veto HV Monitor | 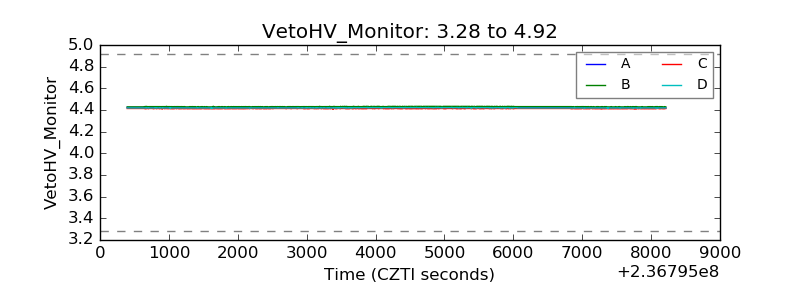 |
| Veto LLD |  |
| Alpha Counter | 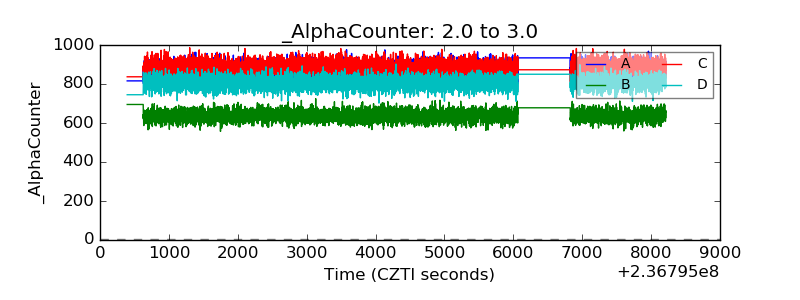 |
| _CPM_Rate | 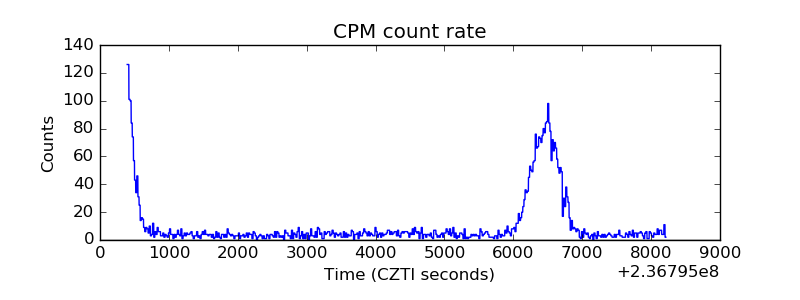 |
| CZT Counter | 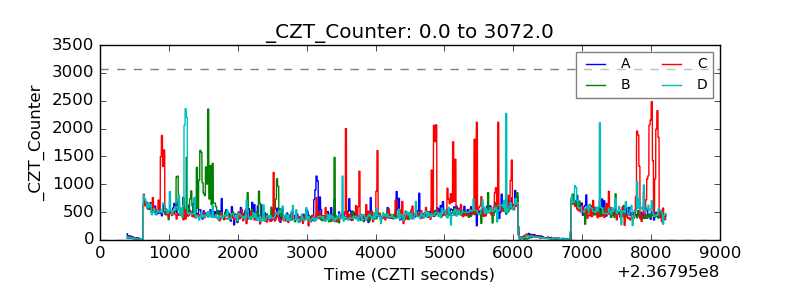 |
| +2.5 Volts monitor |  |
| +5 Volts monitor | 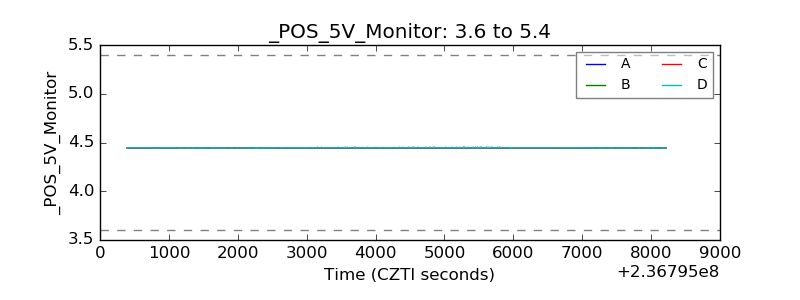 |
| _ROLL_ROT | 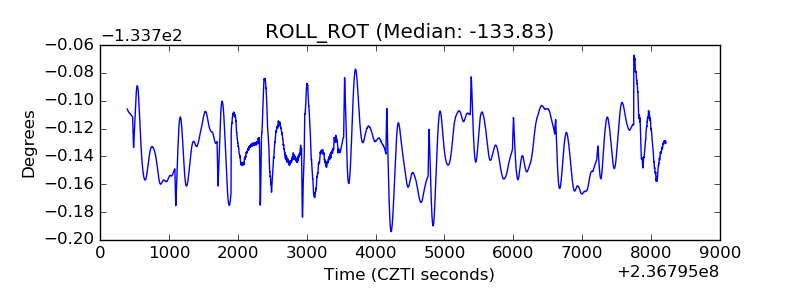 |
| _Roll_DEC | 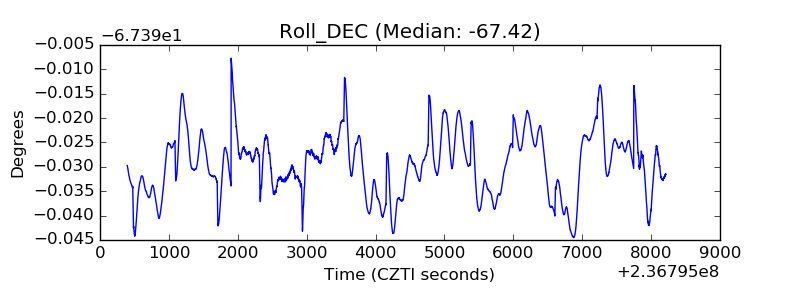 |
| _Roll_RA | 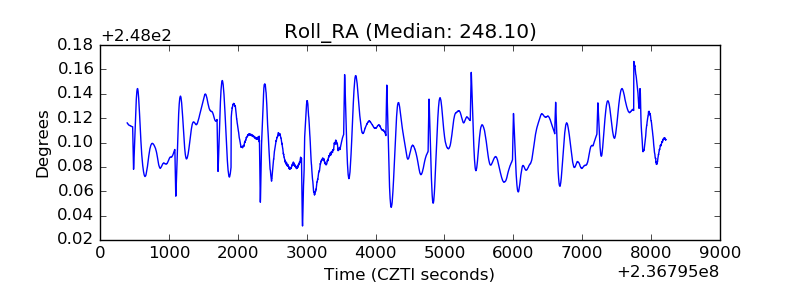 |
| Veto Counter | 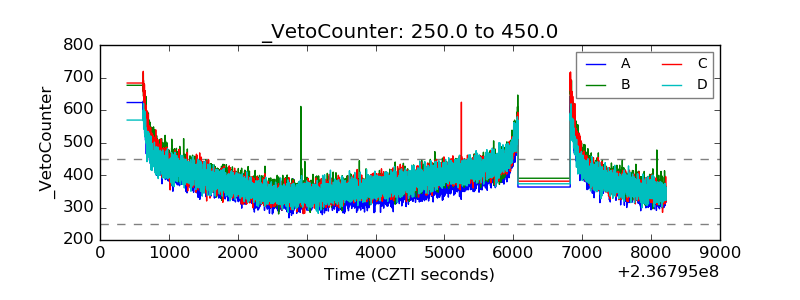 |