| Param | Original file | Final file |
|---|---|---|
| Filename | modeM0/AS1G07_049T02_9000001354cztM0_level2.fits | modeM0/AS1G07_049T02_9000001354cztM0_level2_quad_clean.evt |
| Size (bytes) | 330,016,320 | 385,663,680 |
| Size | 314.7 MB | 367.8 MB |
| Events in quadrant A | 1,719,710 | 2,293,998 |
| Events in quadrant B | 3,082,948 | 3,094,817 |
| Events in quadrant C | 1,687,898 | 2,213,061 |
| Events in quadrant D | 1,468,284 | 2,042,783 |
| Mode SS | |||
|---|---|---|---|
| Quadrant | BADHDUFLAG | Total packets | Discarded packets |
| A | 0 | 596 | 0 |
| B | 0 | 600 | 0 |
| C | 0 | 600 | 0 |
| D | 0 | 602 | 0 |
| Mode M9 | |||
|---|---|---|---|
| Quadrant | BADHDUFLAG | Total packets | Discarded packets |
| A | 0 | 54 | 0 |
| B | 0 | 53 | 0 |
| C | 0 | 53 | 0 |
| D | 0 | 54 | 0 |
| Mode M0 | |||
|---|---|---|---|
| Quadrant | BADHDUFLAG | Total packets | Discarded packets |
| A | 0 | 61836 | 0 |
| B | 0 | 63763 | 0 |
| C | 0 | 60610 | 0 |
| D | 0 | 68479 | 0 |
| Quadrant | Total seconds | Saturated seconds | Saturation percentage |
|---|---|---|---|
| A | 29632 | 229 | 0.772813% |
| B | 29632 | 327 | 1.103537% |
| C | 29638 | 197 | 0.664687% |
| D | 29651 | 448 | 1.510910% |
Noise dominated data is calculated using 1-second bins in cleaned event files. If a bin has >2000 counts, and if more than 50% of those come from <1% of pixels, then it is considered to be noise-dominated and hence unusable.
| Quadrant | # 1 sec bins | Bins with >0 counts | Bins with >2000 counts | High rate bins dominated by noise | Noise dominated (total time) | Noise dominated (detector-on time) | Marked lightcurve |
|---|---|---|---|---|---|---|---|
| A | 34876 | 29755 | 0 | 0 | 0.00% | 0.00% | 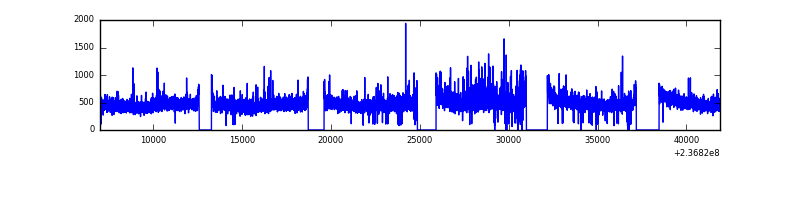 |
| B | 34876 | 29763 | 0 | 0 | 0.00% | 0.00% | 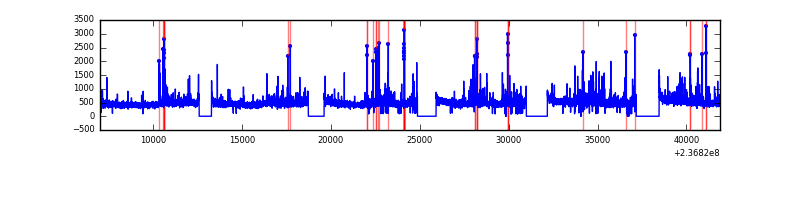 |
| C | 34876 | 29762 | 0 | 0 | 0.00% | 0.00% | 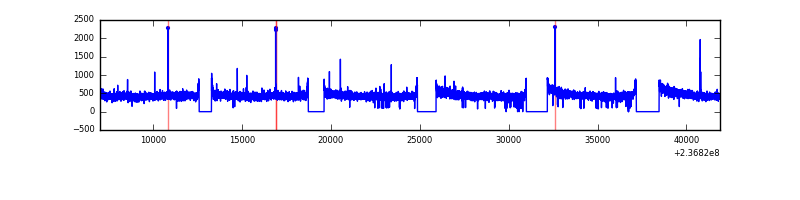 |
| D | 34876 | 29714 | 0 | 0 | 0.00% | 0.00% | 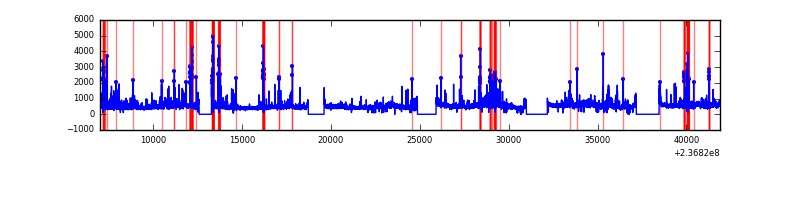 |
Top three noisy pixels from each quadrant. If the there are fewer than three noisy pixels in the level2.evt file, extra rows are filled as -1
| Pixel properties | Quadrant properties | ||||||
|---|---|---|---|---|---|---|---|
| Quadrant | DetID | PixID | Counts | Sigma | Mean | Median | Sigma |
| A | 0 | 29 | 1695 | 11.31 | 447 | 422 | 112.6 |
| A | 7 | 110 | 1374 | 8.46 | 447 | 422 | 112.6 |
| A | 0 | 30 | 1320 | 7.98 | 447 | 422 | 112.6 |
| B | 5 | 252 | 1572 | 5.54 | 825 | 801 | 139.2 |
| B | 2 | 9 | 1549 | 5.38 | 825 | 801 | 139.2 |
| B | 5 | 232 | 1525 | 5.2 | 825 | 801 | 139.2 |
| C | 1 | 80 | 1309 | 7.7 | 445 | 416 | 116.0 |
| C | 1 | 81 | 1224 | 6.97 | 445 | 416 | 116.0 |
| C | 12 | 241 | 1198 | 6.74 | 445 | 416 | 116.0 |
| D | 3 | 14 | 1107 | 6.46 | 417 | 382 | 112.2 |
| D | 6 | 231 | 1054 | 5.99 | 417 | 382 | 112.2 |
| D | 6 | 83 | 1043 | 5.89 | 417 | 382 | 112.2 |
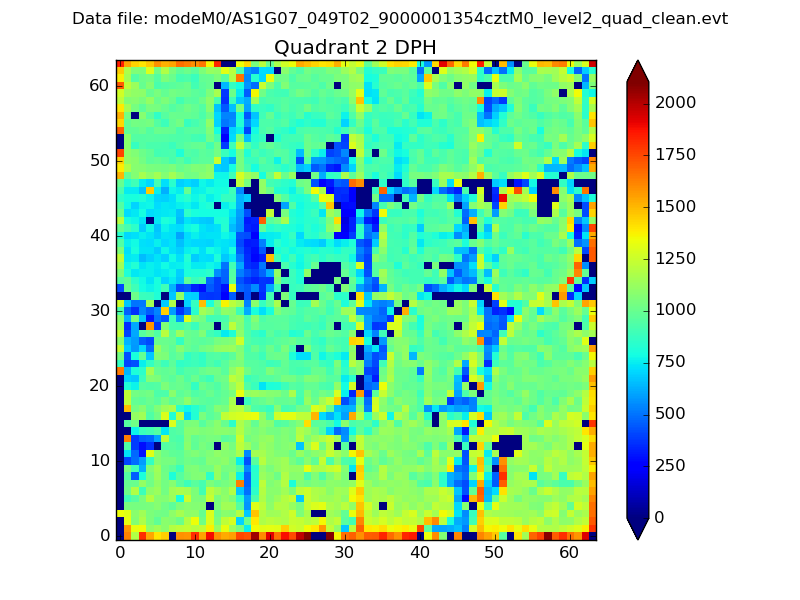
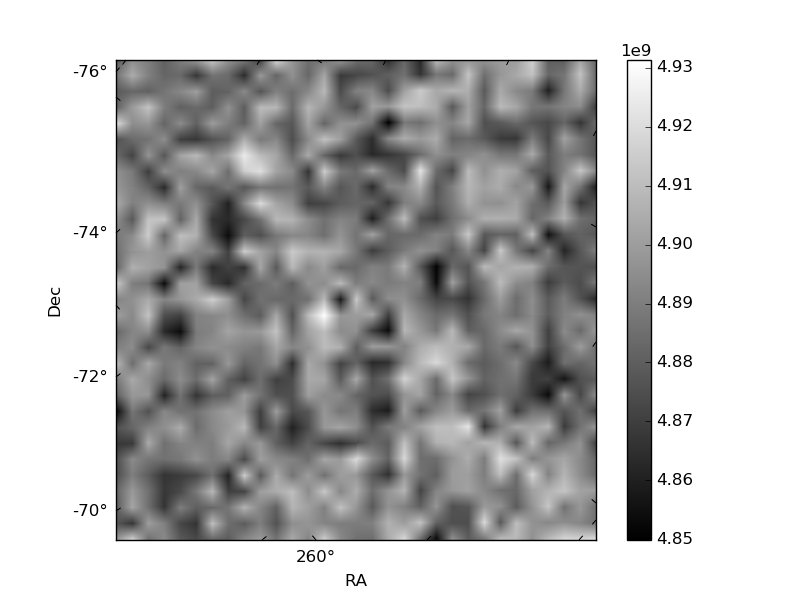
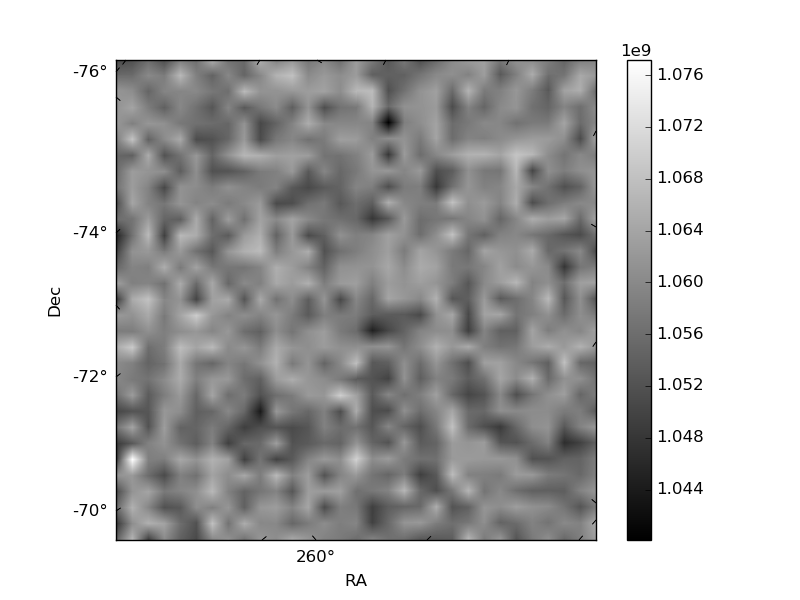
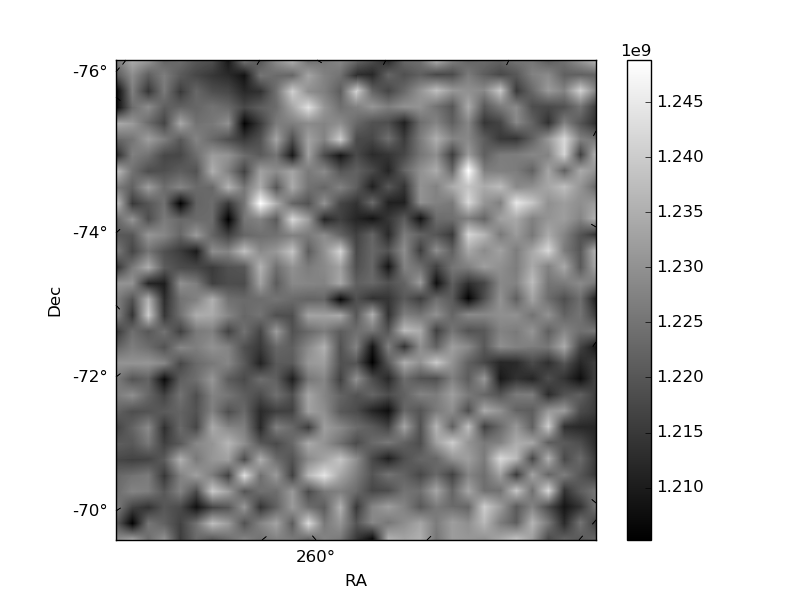
Histogram calculated using DETX and DETY for each event in the final _common_clean file
| Quadrant A | 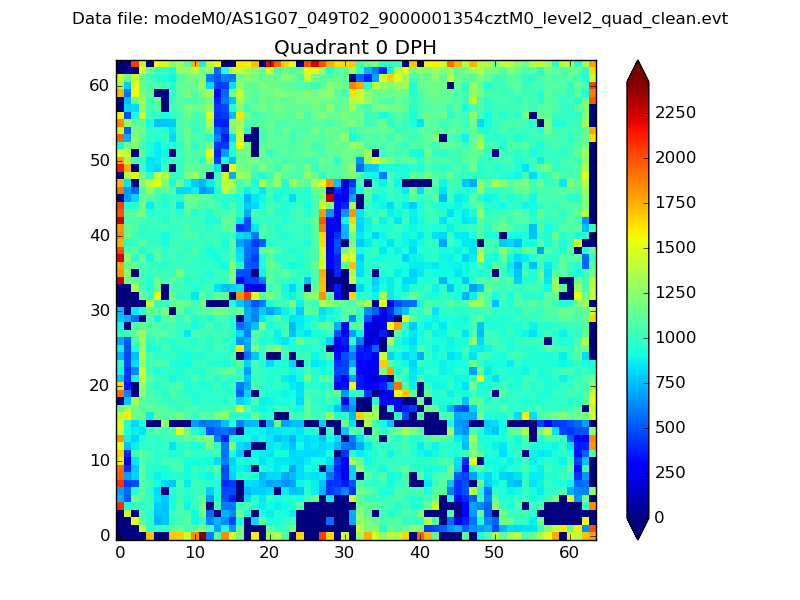 |
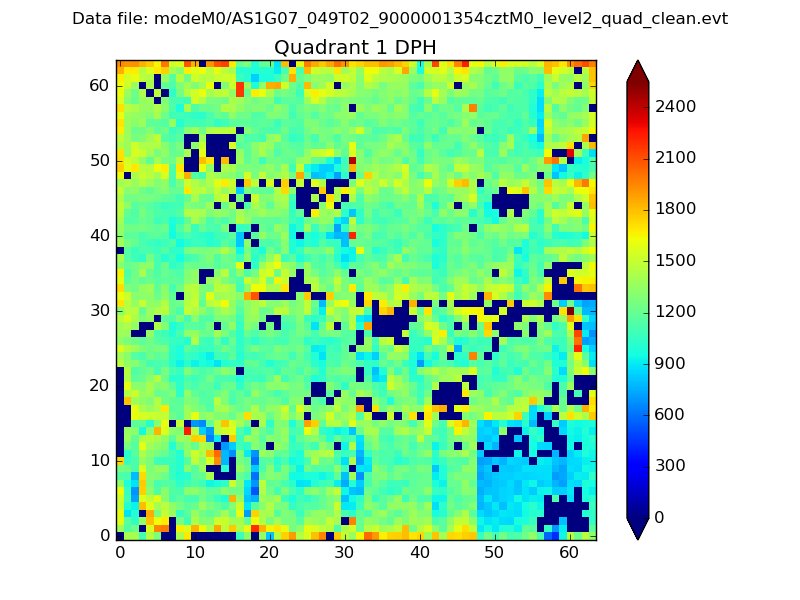 |
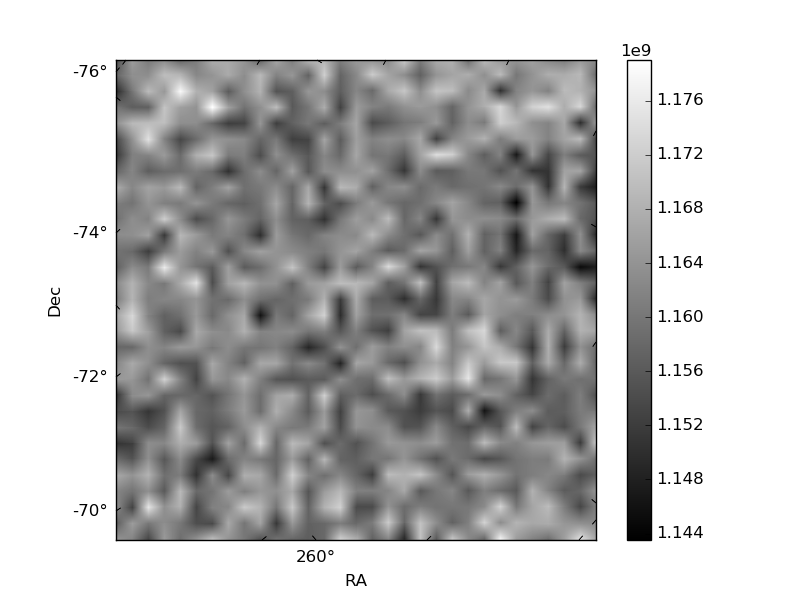
Quadrant B |
|---|---|---|---|
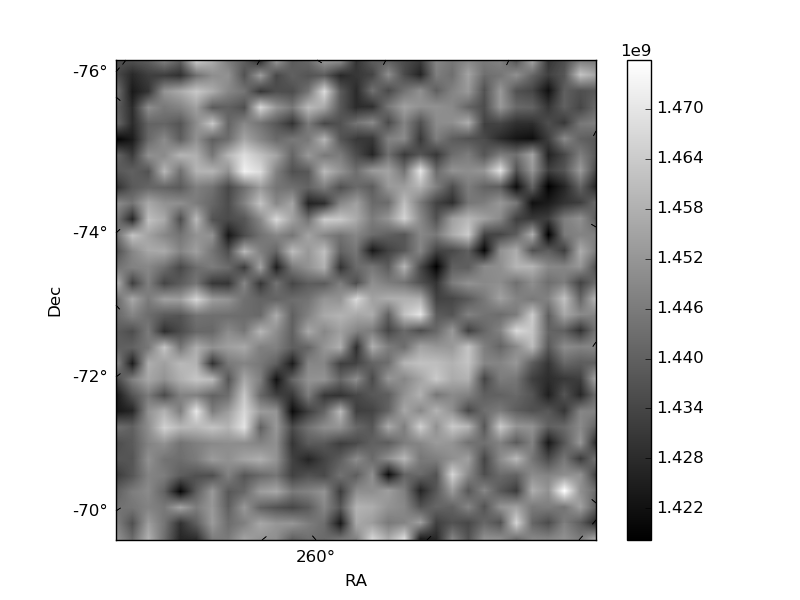
| Quadrant D | 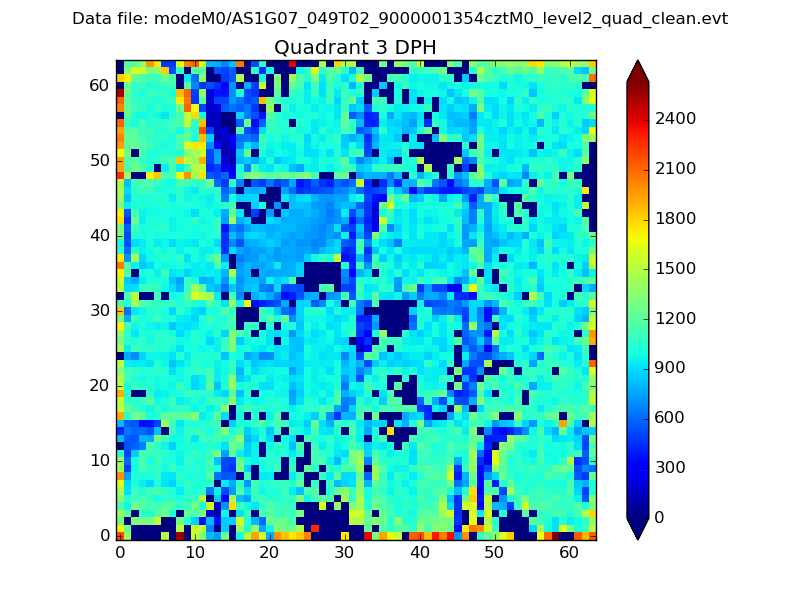 |
 |
Quadrant C |
| Plot type | Count rate plots | Images |
|---|---|---|
| Comparison with Poisson distribution Blue bars denote a histogram of data divided into 1 sec bins. Red curve is a Poisson curve with rate = median count rate of data. |
 |
 |
| Quadrant-wise count rates Data is divided into 100 sec bins |
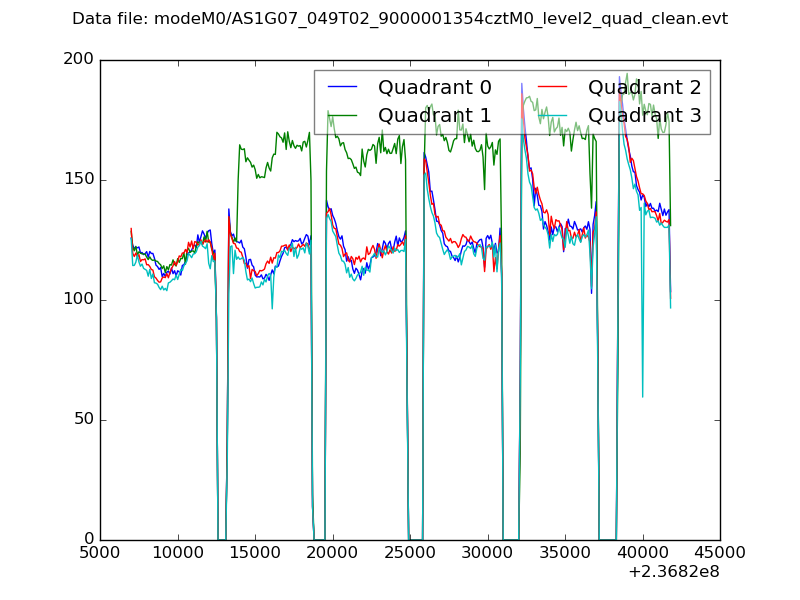 |
|
| Module-wise count rates for Quadrant A Data is divided into 100 sec bins |
 |
 |
| Module-wise count rates for Quadrant B Data is divided into 100 sec bins |
 |
 |
| Module-wise count rates for Quadrant C Data is divided into 100 sec bins |
 |
 |
| Module-wise count rates for Quadrant D Data is divided into 100 sec bins |
 |
 |
| Parameter | Plot |
|---|---|
| CZT HV Monitor | 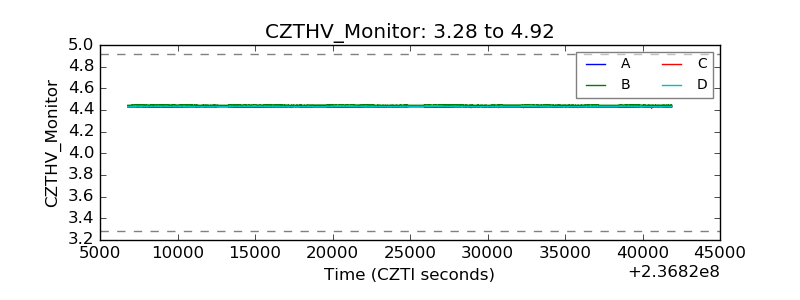 |
| D_VDD | 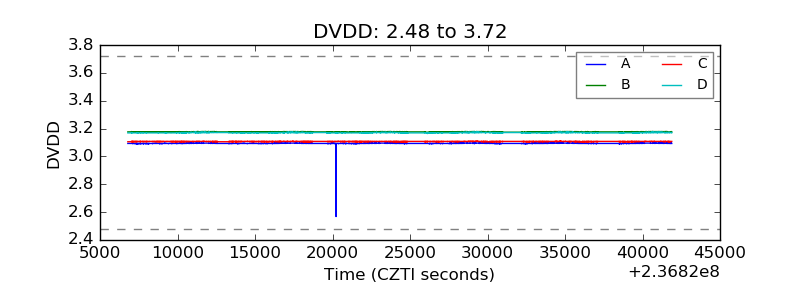 |
| Temperature 1 |  |
| Veto HV Monitor | 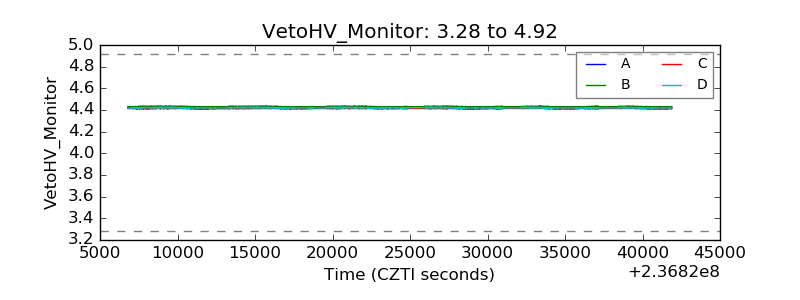 |
| Veto LLD | 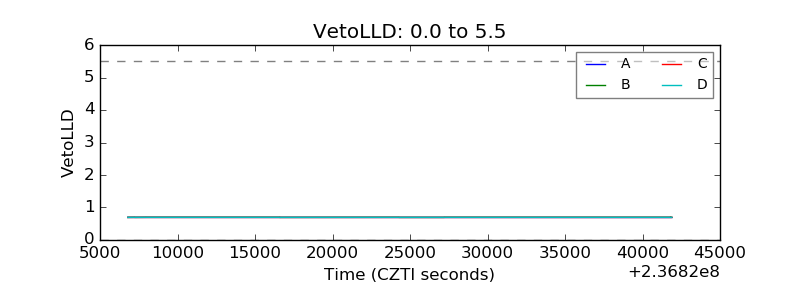 |
| Alpha Counter | 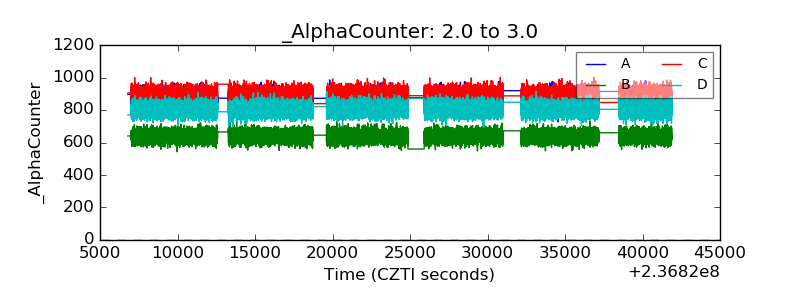 |
| _CPM_Rate | 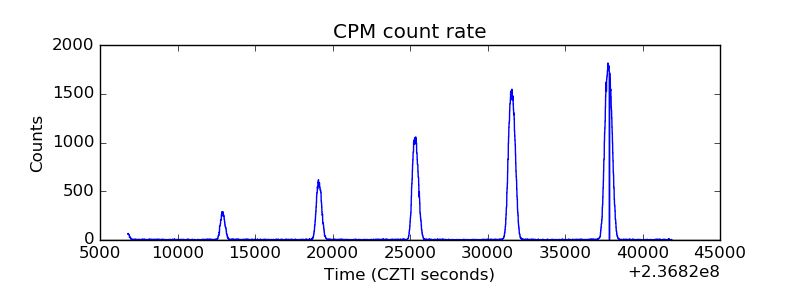 |
| CZT Counter | 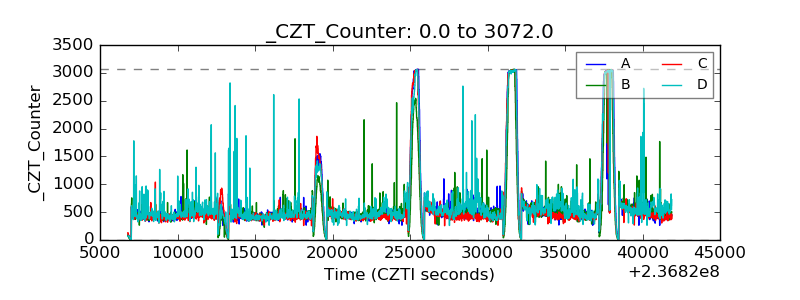 |
| +2.5 Volts monitor | 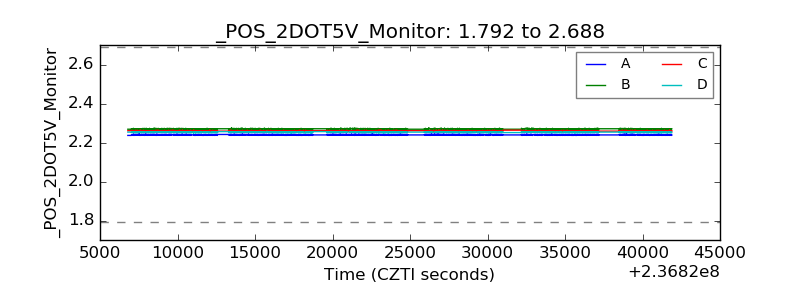 |
| +5 Volts monitor |  |
| _ROLL_ROT | 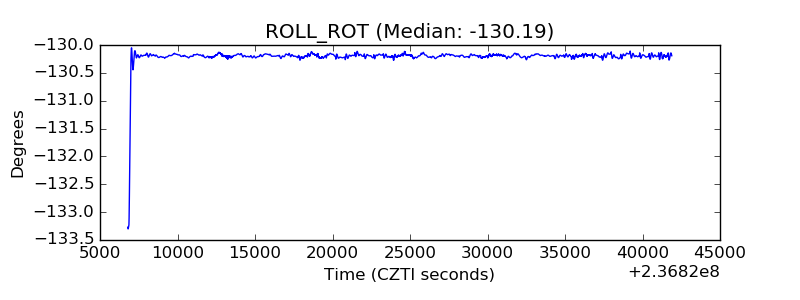 |
| _Roll_DEC | 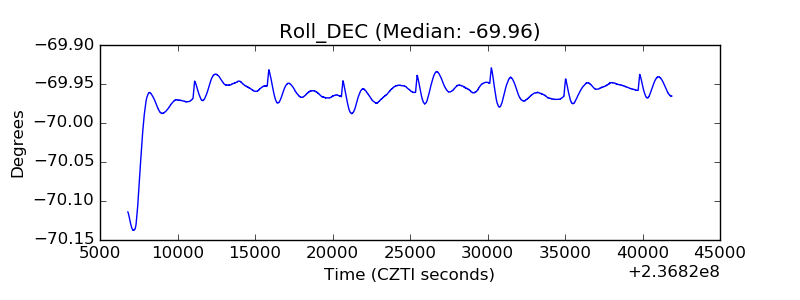 |
| _Roll_RA | 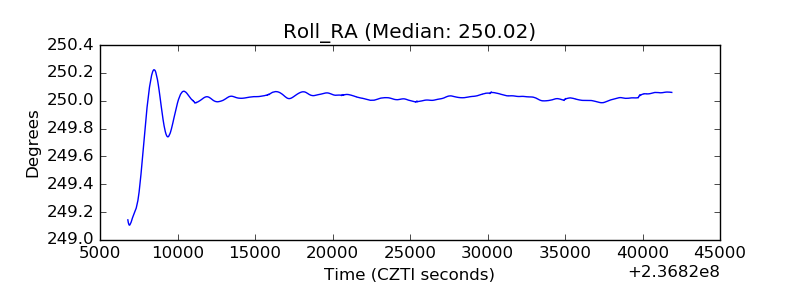 |
| Veto Counter | 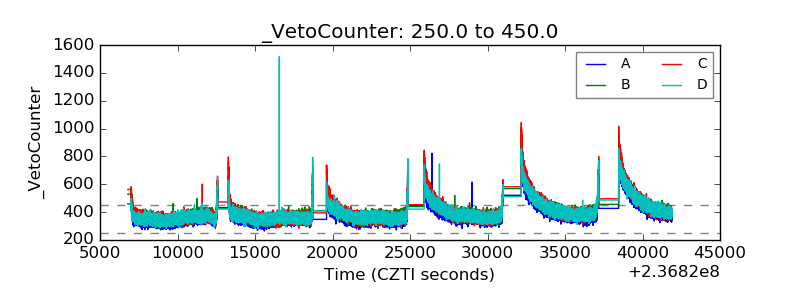 |