| Param | Original file | Final file |
|---|---|---|
| Filename | modeM0/AS1G07_049T02_9000001354_09546cztM0_level2.evt | modeM0/AS1G07_049T02_9000001354_09546cztM0_level2_quad_clean.evt |
| Size (bytes) | 464,382,720 | 128,280,960 |
| Size | 442.9 MB | 122.3 MB |
| Events in quadrant A | 3,211,027 | 852,107 |
| Events in quadrant B | 3,344,723 | 887,611 |
| Events in quadrant C | 3,090,114 | 840,783 |
| Events in quadrant D | 3,935,233 | 810,477 |
| Mode SS | |||
|---|---|---|---|
| Quadrant | BADHDUFLAG | Total packets | Discarded packets |
| A | 0 | 144 | 0 |
| B | 0 | 144 | 0 |
| C | 0 | 144 | 0 |
| D | 0 | 144 | 0 |
| Mode M9 | |||
|---|---|---|---|
| Quadrant | BADHDUFLAG | Total packets | Discarded packets |
| A | 0 | 10 | 0 |
| B | 0 | 10 | 0 |
| C | 0 | 10 | 0 |
| D | 0 | 10 | 0 |
| Mode M0 | |||
|---|---|---|---|
| Quadrant | BADHDUFLAG | Total packets | Discarded packets |
| A | 0 | 14455 | 25 |
| B | 0 | 14802 | 13 |
| C | 0 | 14370 | 12 |
| D | 0 | 16657 | 16 |
| Quadrant | Total seconds | Saturated seconds | Saturation percentage |
|---|---|---|---|
| A | 7097 | 46 | 0.648161% |
| B | 7103 | 74 | 1.041813% |
| C | 7103 | 40 | 0.563142% |
| D | 7101 | 158 | 2.225039% |
Noise dominated data is calculated using 1-second bins in cleaned event files. If a bin has >2000 counts, and if more than 50% of those come from <1% of pixels, then it is considered to be noise-dominated and hence unusable.
| Quadrant | # 1 sec bins | Bins with >0 counts | Bins with >2000 counts | High rate bins dominated by noise | Noise dominated (total time) | Noise dominated (detector-on time) | Marked lightcurve |
|---|---|---|---|---|---|---|---|
| A | 7803 | 7109 | 0 | 0 | 0.00% | 0.00% |  |
| B | 7803 | 7109 | 6 | 6 | 0.08% | 0.08% | 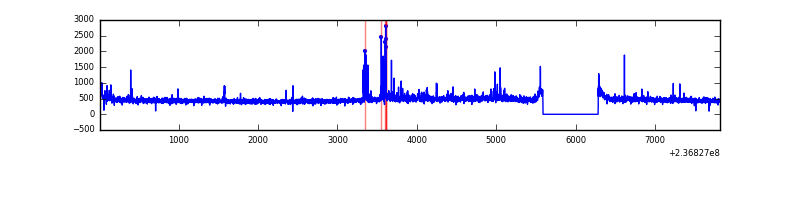 |
| C | 7803 | 7109 | 1 | 1 | 0.01% | 0.01% | 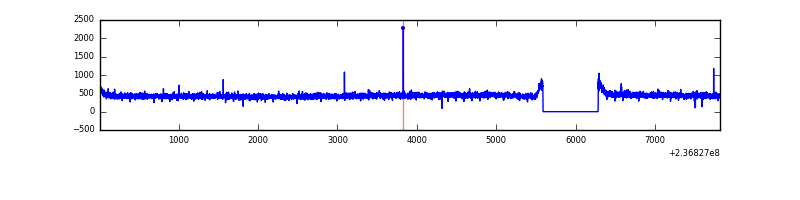 |
| D | 7803 | 7109 | 79 | 79 | 1.01% | 1.11% | 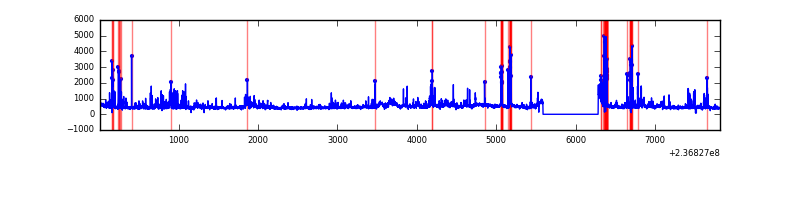 |
Top three noisy pixels from each quadrant. If the there are fewer than three noisy pixels in the level2.evt file, extra rows are filled as -1
| Pixel properties | Quadrant properties | ||||||
|---|---|---|---|---|---|---|---|
| Quadrant | DetID | PixID | Counts | Sigma | Mean | Median | Sigma |
| A | 1 | 162 | 49162 | 291.22 | 809 | 789 | 166.1 |
| A | 1 | 178 | 15647 | 89.45 | 809 | 789 | 166.1 |
| A | 1 | 161 | 14358 | 81.69 | 809 | 789 | 166.1 |
| B | 0 | 214 | 60398 | 384.83 | 813 | 794 | 154.9 |
| B | 0 | 187 | 35592 | 224.67 | 813 | 794 | 154.9 |
| B | 4 | 80 | 28401 | 178.24 | 813 | 794 | 154.9 |
| C | 13 | 61 | 6032 | 28.58 | 790 | 791 | 183.4 |
| C | 14 | 234 | 5072 | 23.35 | 790 | 791 | 183.4 |
| C | 8 | 222 | 2013 | 6.66 | 790 | 791 | 183.4 |
| D | 1 | 52 | 457413 | 2304.44 | 774 | 754 | 198.2 |
| D | 13 | 122 | 185983 | 934.72 | 774 | 754 | 198.2 |
| D | 12 | 227 | 173466 | 871.56 | 774 | 754 | 198.2 |
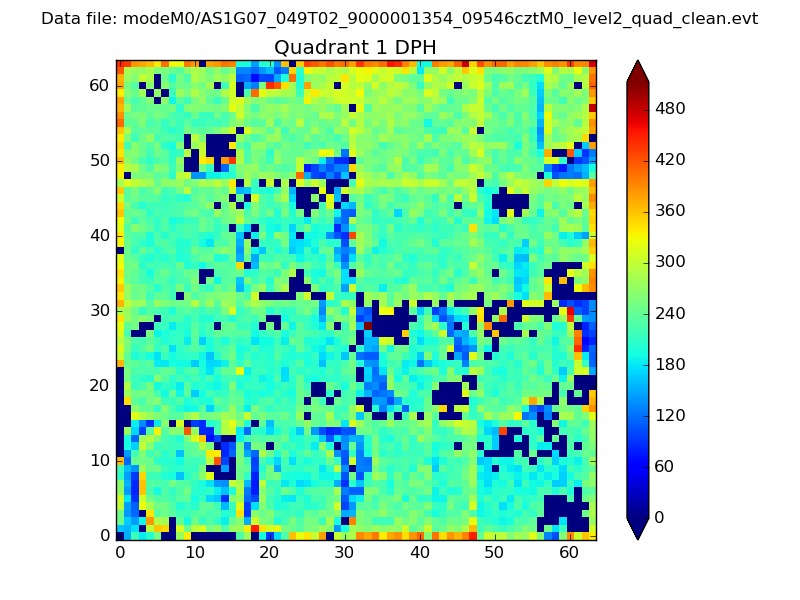
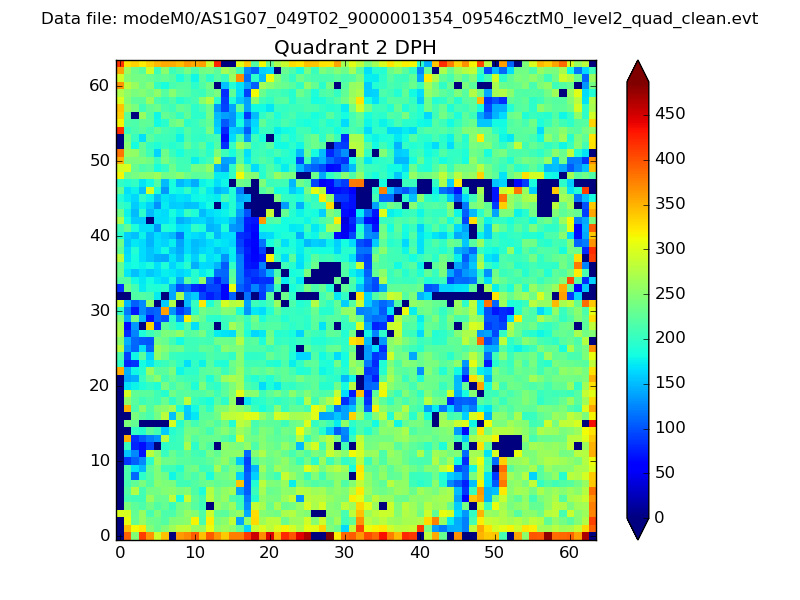
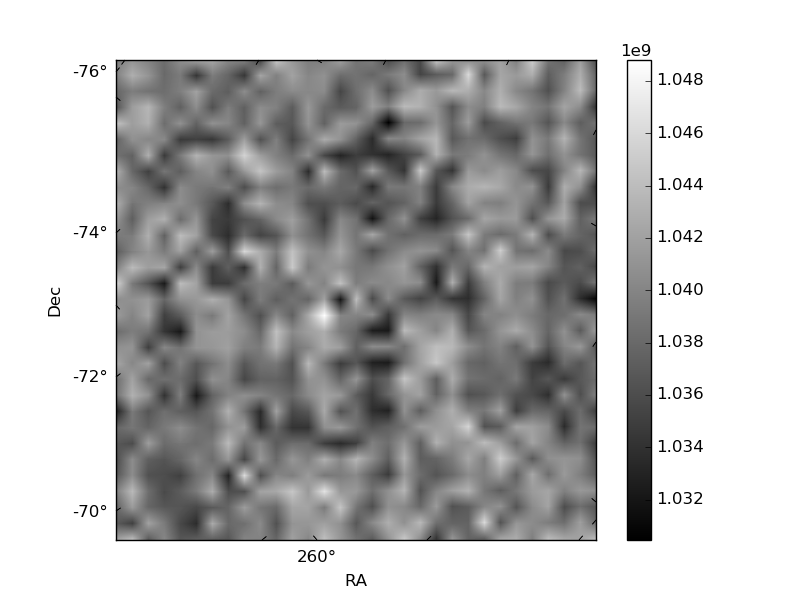
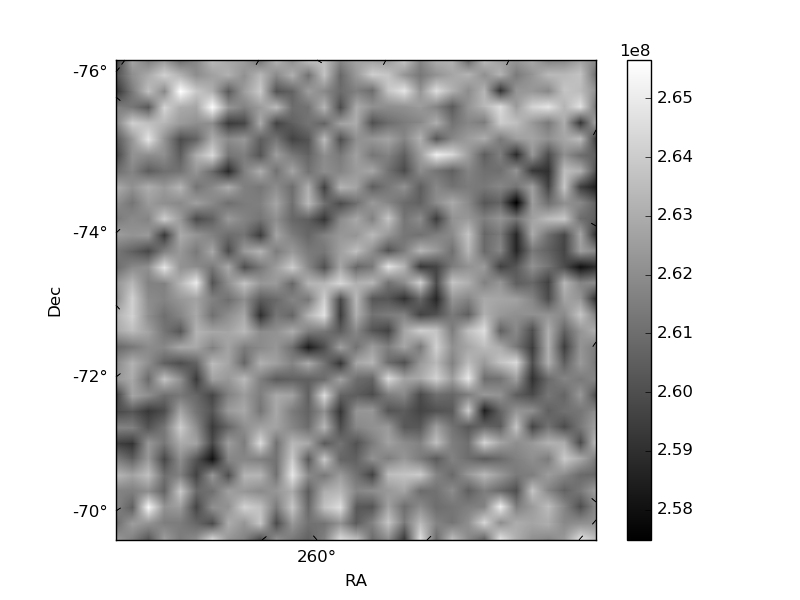
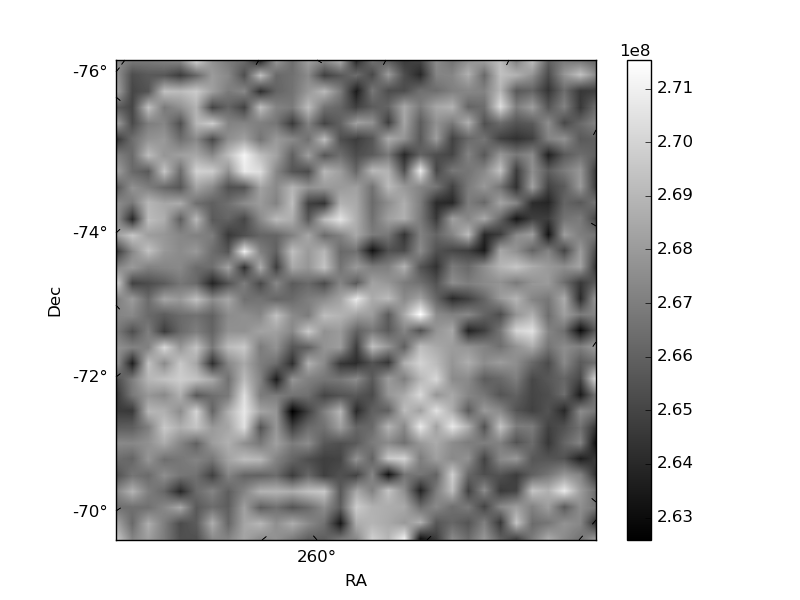
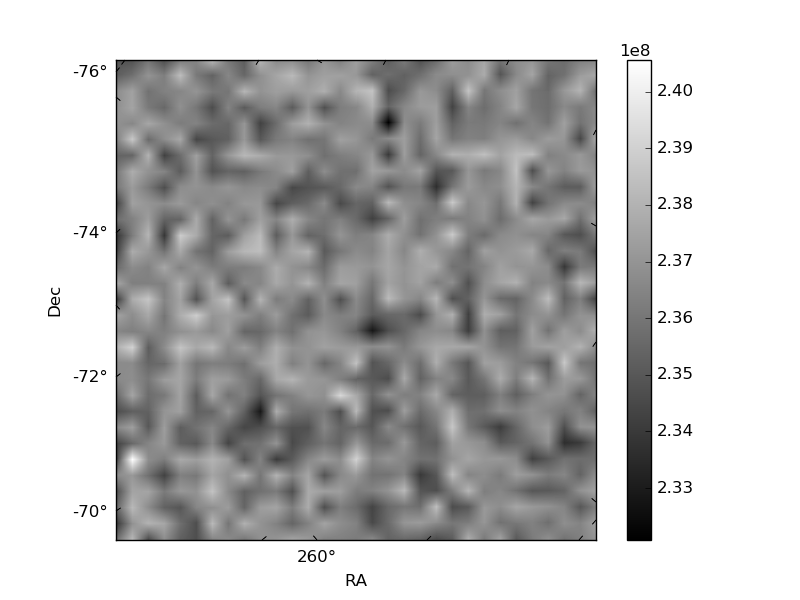
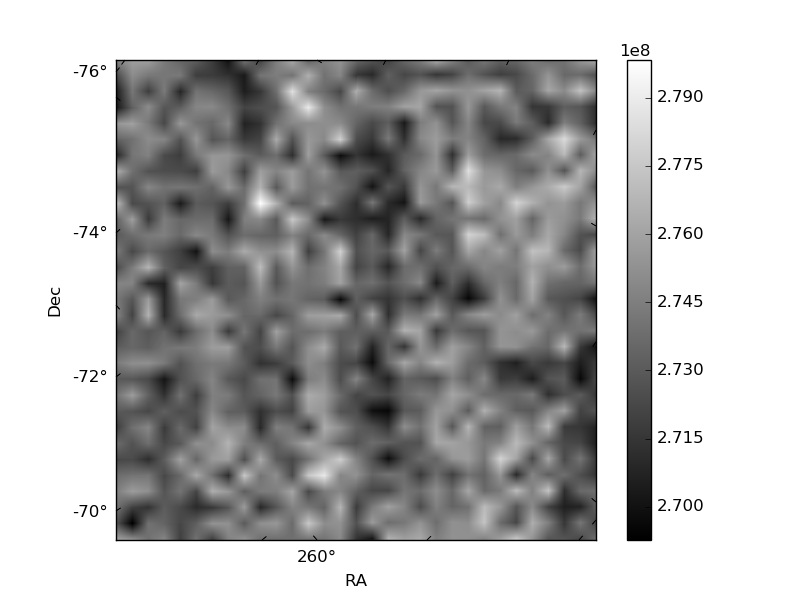
Histogram calculated using DETX and DETY for each event in the final _common_clean file
| Quadrant A | 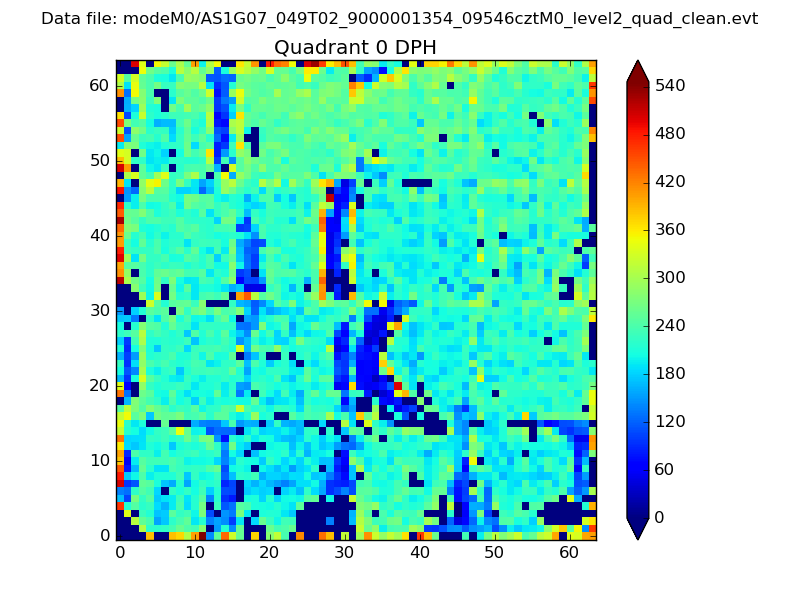 |
 |
Quadrant B |
|---|---|---|---|
| Quadrant D | 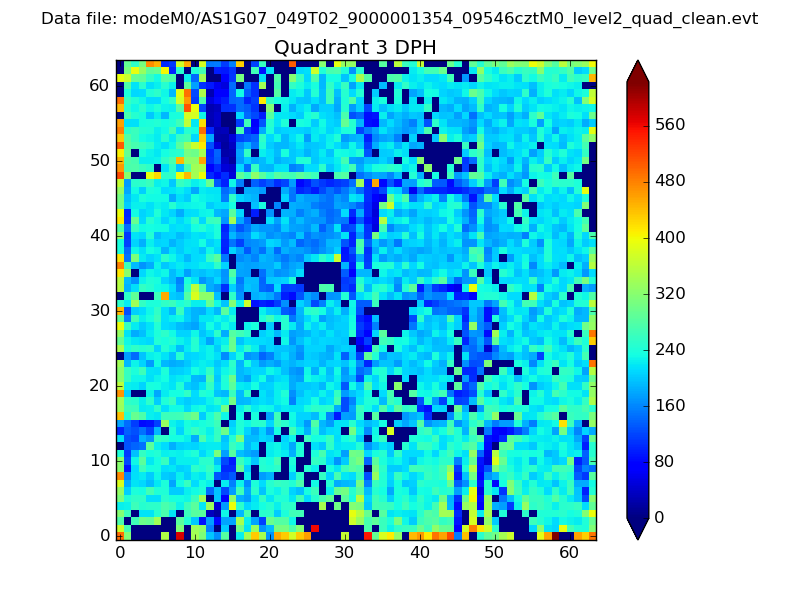 |
 |
Quadrant C |
| Plot type | Count rate plots | Images |
|---|---|---|
| Comparison with Poisson distribution Blue bars denote a histogram of data divided into 1 sec bins. Red curve is a Poisson curve with rate = median count rate of data. |
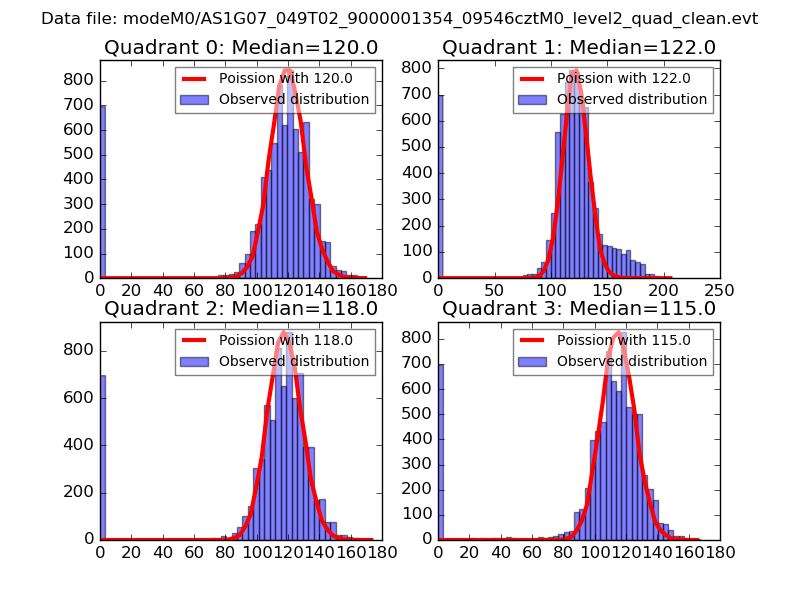 |
 |
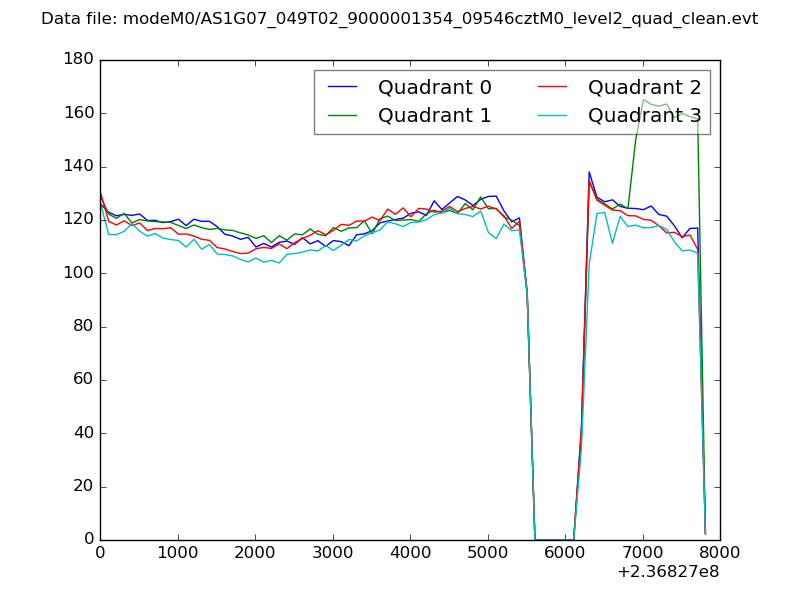
| Quadrant-wise count rates Data is divided into 100 sec bins |
 |
|
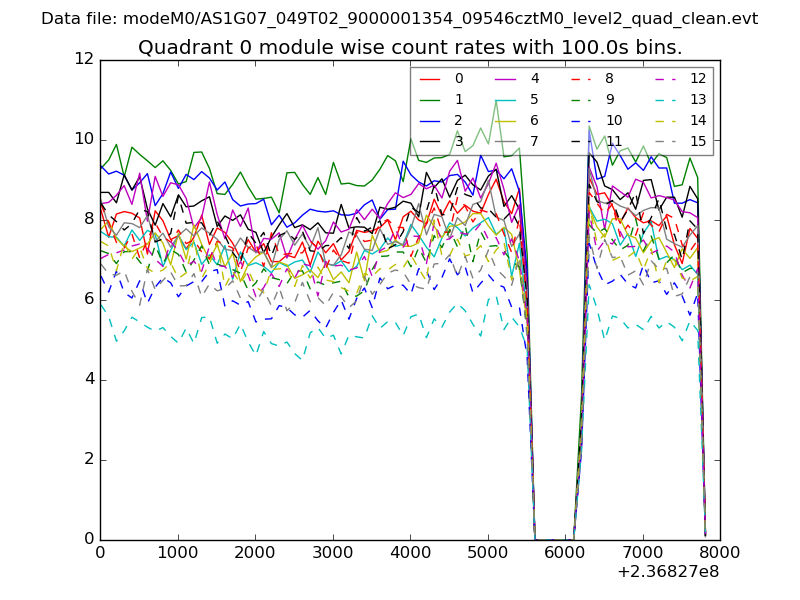
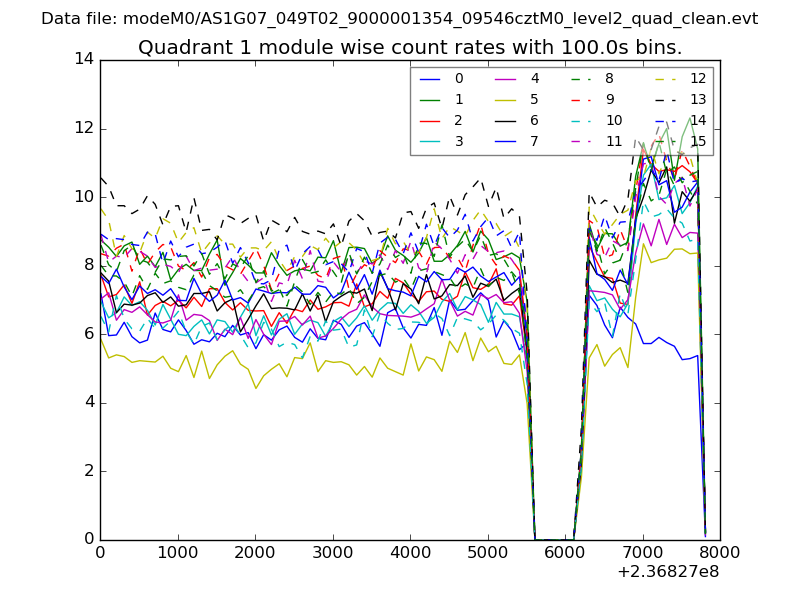
| Module-wise count rates for Quadrant A Data is divided into 100 sec bins |
 |
 |
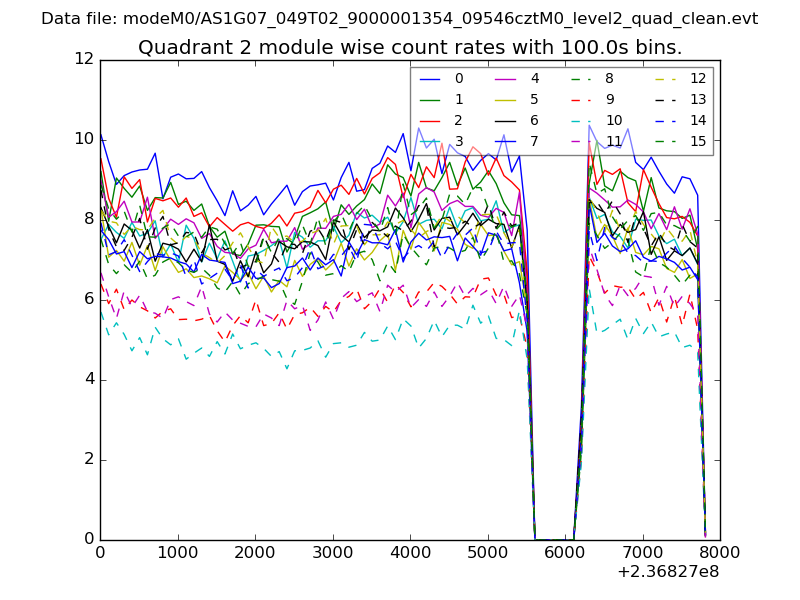
| Module-wise count rates for Quadrant B Data is divided into 100 sec bins |
 |
 |
| Module-wise count rates for Quadrant C Data is divided into 100 sec bins |
 |
 |
| Module-wise count rates for Quadrant D Data is divided into 100 sec bins |
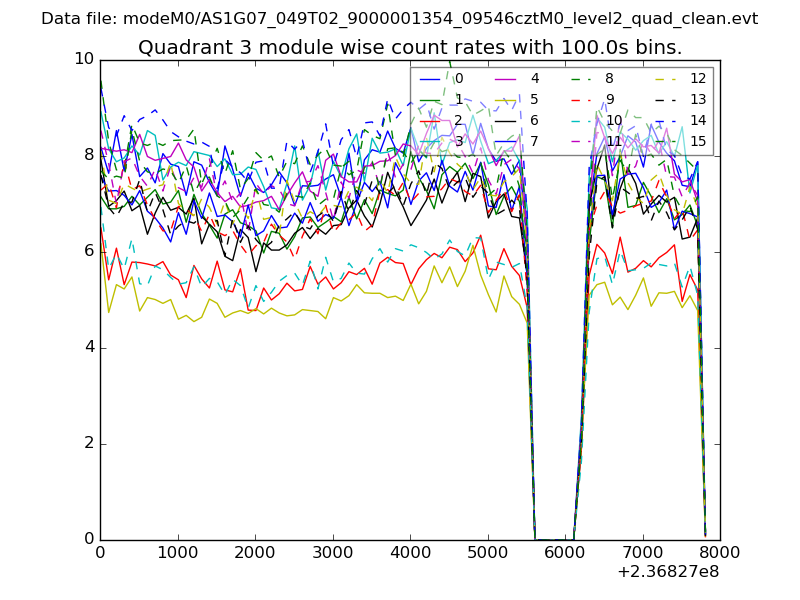 |
 |
| Parameter | Plot |
|---|---|
| CZT HV Monitor | 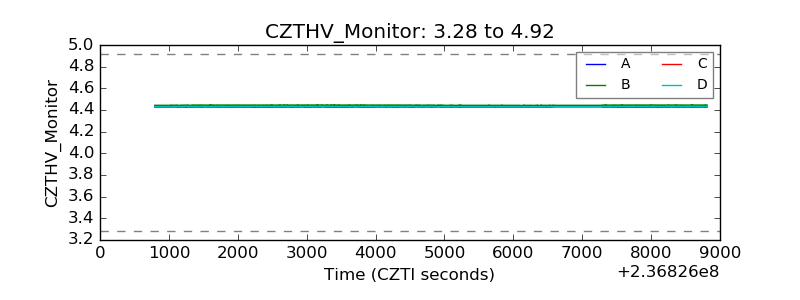 |
| D_VDD | 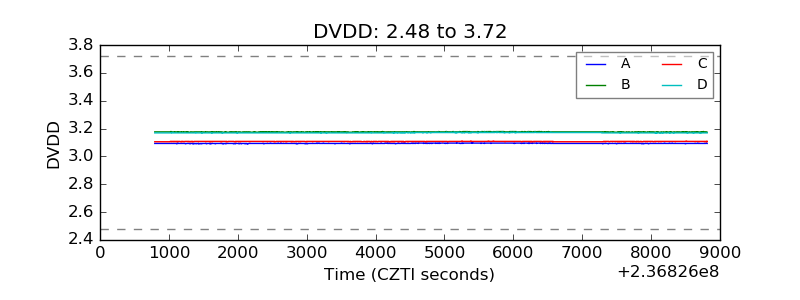 |
| Temperature 1 | 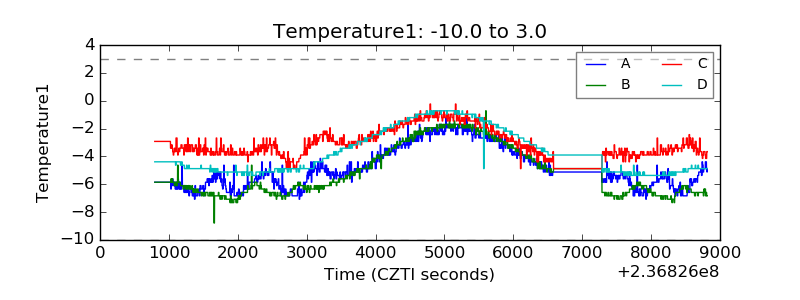 |
| Veto HV Monitor | 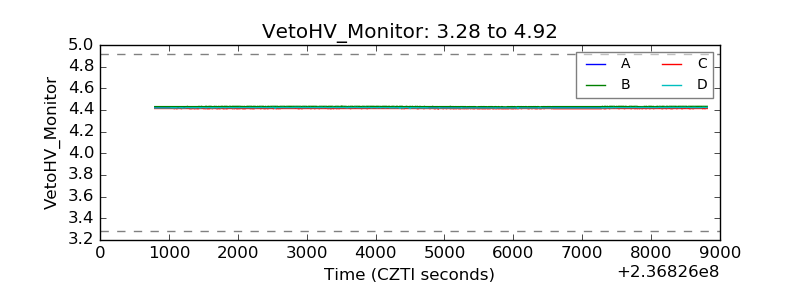 |
| Veto LLD | 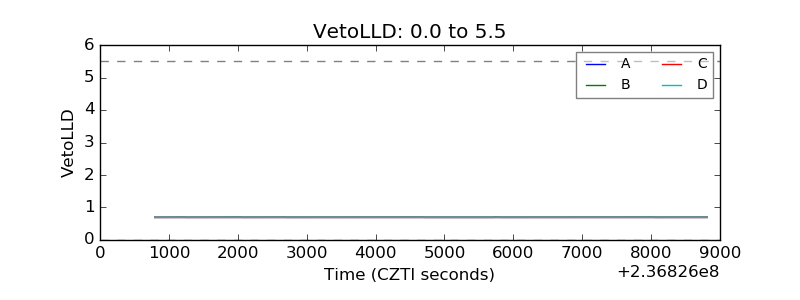 |
| Alpha Counter | 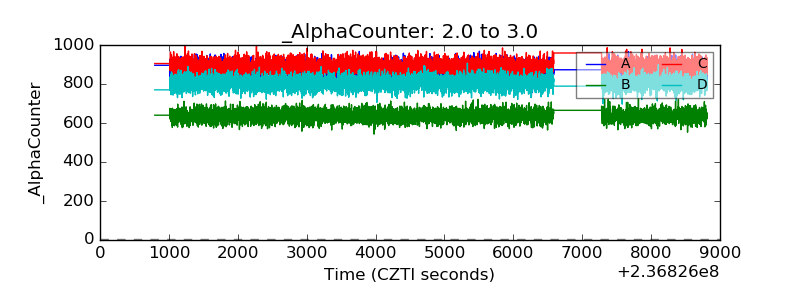 |
| _CPM_Rate | 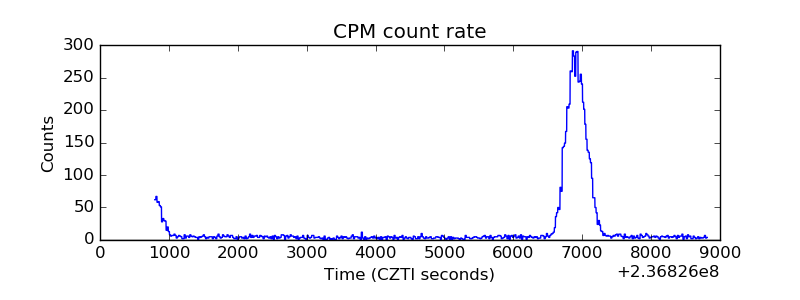 |
| CZT Counter |  |
| +2.5 Volts monitor |  |
| +5 Volts monitor |  |
| _ROLL_ROT | 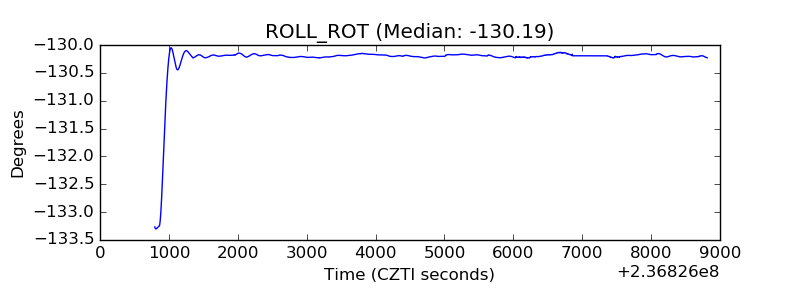 |
| _Roll_DEC | 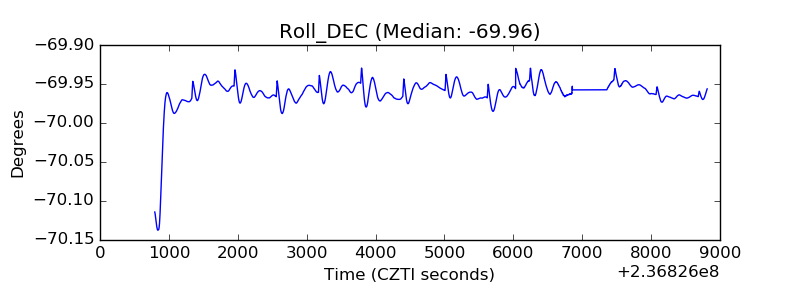 |
| _Roll_RA | 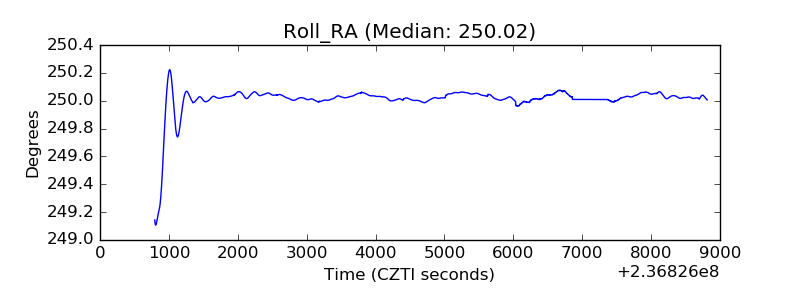 |
| Veto Counter | 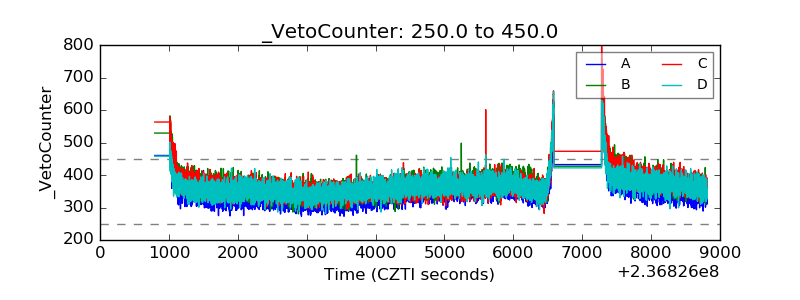 |