| Param | Original file | Final file |
|---|---|---|
| Filename | modeM0/AS1G07_049T02_9000001354_09547cztM0_level2.evt | modeM0/AS1G07_049T02_9000001354_09547cztM0_level2_quad_clean.evt |
| Size (bytes) | 474,171,840 | 133,165,440 |
| Size | 452.2 MB | 127.0 MB |
| Events in quadrant A | 3,369,148 | 890,520 |
| Events in quadrant B | 3,492,334 | 894,840 |
| Events in quadrant C | 3,258,972 | 884,342 |
| Events in quadrant D | 3,743,274 | 855,111 |
| Mode SS | |||
|---|---|---|---|
| Quadrant | BADHDUFLAG | Total packets | Discarded packets |
| A | 0 | 150 | 0 |
| B | 0 | 150 | 2 |
| C | 0 | 150 | 0 |
| D | 0 | 150 | 0 |
| Mode M9 | |||
|---|---|---|---|
| Quadrant | BADHDUFLAG | Total packets | Discarded packets |
| A | 0 | 16 | 0 |
| B | 0 | 16 | 0 |
| C | 0 | 16 | 0 |
| D | 0 | 16 | 0 |
| Mode M0 | |||
|---|---|---|---|
| Quadrant | BADHDUFLAG | Total packets | Discarded packets |
| A | 0 | 14932 | 3 |
| B | 0 | 15216 | 2 |
| C | 0 | 14866 | 2 |
| D | 0 | 16203 | 2 |
| Quadrant | Total seconds | Saturated seconds | Saturation percentage |
|---|---|---|---|
| A | 7308 | 78 | 1.067323% |
| B | 7308 | 106 | 1.450465% |
| C | 7308 | 80 | 1.094691% |
| D | 7308 | 184 | 2.517789% |
Noise dominated data is calculated using 1-second bins in cleaned event files. If a bin has >2000 counts, and if more than 50% of those come from <1% of pixels, then it is considered to be noise-dominated and hence unusable.
| Quadrant | # 1 sec bins | Bins with >0 counts | Bins with >2000 counts | High rate bins dominated by noise | Noise dominated (total time) | Noise dominated (detector-on time) | Marked lightcurve |
|---|---|---|---|---|---|---|---|
| A | 8893 | 7310 | 0 | 0 | 0.00% | 0.00% | 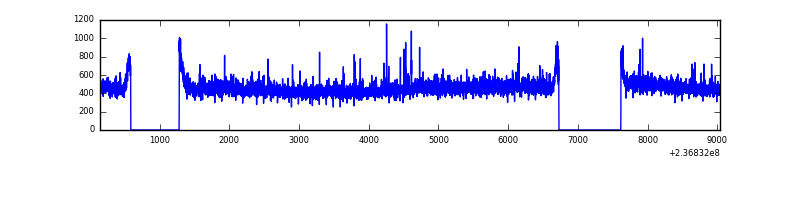 |
| B | 8893 | 7310 | 2 | 2 | 0.02% | 0.03% | 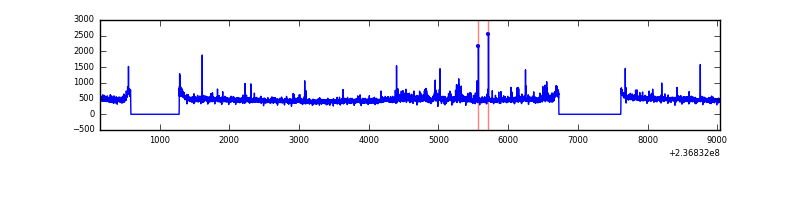 |
| C | 8893 | 7310 | 2 | 2 | 0.02% | 0.03% | 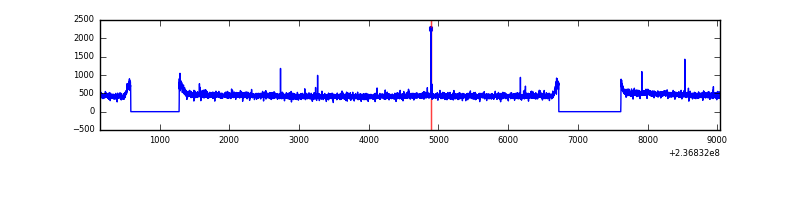 |
| D | 8893 | 7310 | 75 | 75 | 0.84% | 1.03% | 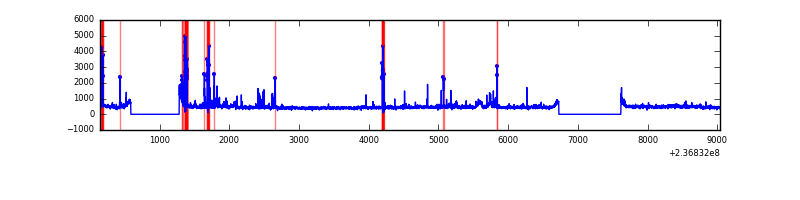 |
Top three noisy pixels from each quadrant. If the there are fewer than three noisy pixels in the level2.evt file, extra rows are filled as -1
| Pixel properties | Quadrant properties | ||||||
|---|---|---|---|---|---|---|---|
| Quadrant | DetID | PixID | Counts | Sigma | Mean | Median | Sigma |
| A | 1 | 162 | 58536 | 331.94 | 849 | 830 | 173.8 |
| A | 1 | 178 | 15142 | 82.33 | 849 | 830 | 173.8 |
| A | 1 | 161 | 14482 | 78.53 | 849 | 830 | 173.8 |
| B | 4 | 80 | 55129 | 335.8 | 854 | 832 | 161.7 |
| B | 0 | 214 | 47968 | 291.51 | 854 | 832 | 161.7 |
| B | 0 | 187 | 23271 | 138.77 | 854 | 832 | 161.7 |
| C | 14 | 234 | 6922 | 31.92 | 832 | 834 | 190.8 |
| C | 13 | 61 | 6245 | 28.37 | 832 | 834 | 190.8 |
| C | 14 | 67 | 2963 | 11.16 | 832 | 834 | 190.8 |
| D | 13 | 122 | 221353 | 1095.91 | 815 | 794 | 201.3 |
| D | 1 | 52 | 204468 | 1012.01 | 815 | 794 | 201.3 |
| D | 12 | 227 | 83039 | 408.66 | 815 | 794 | 201.3 |
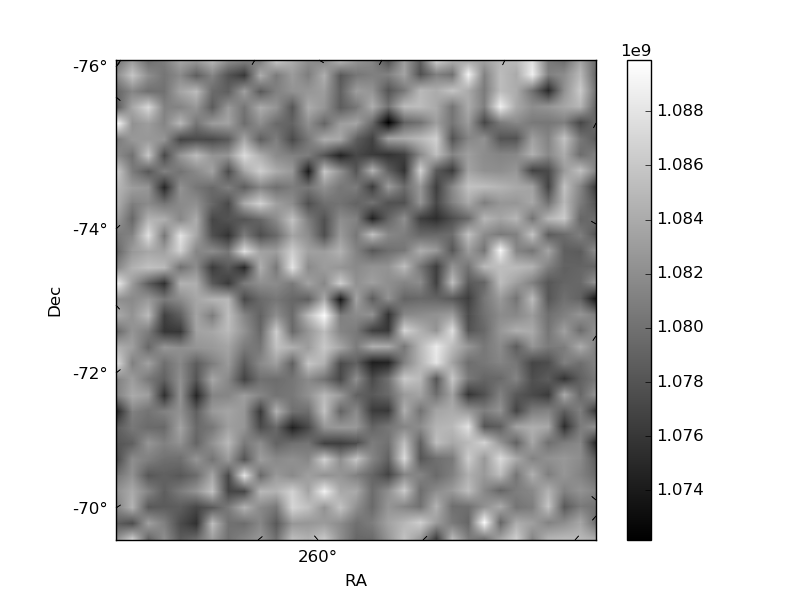
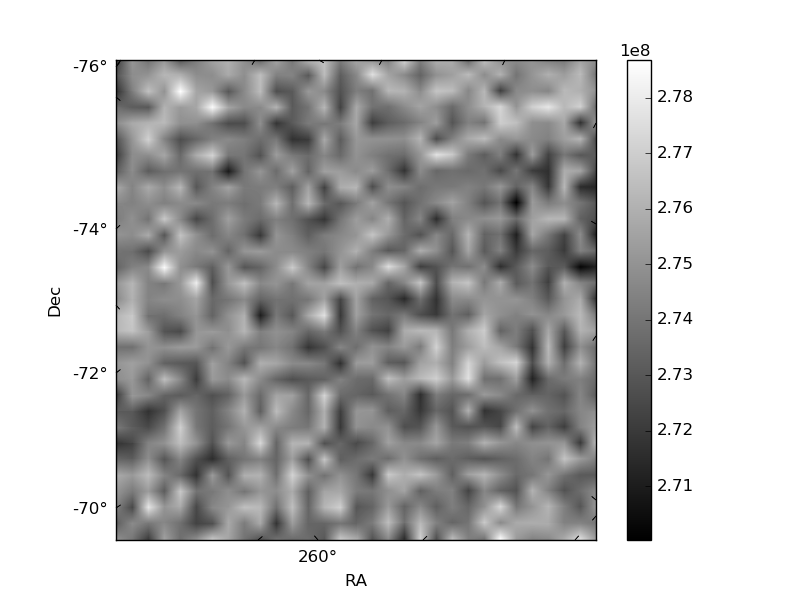
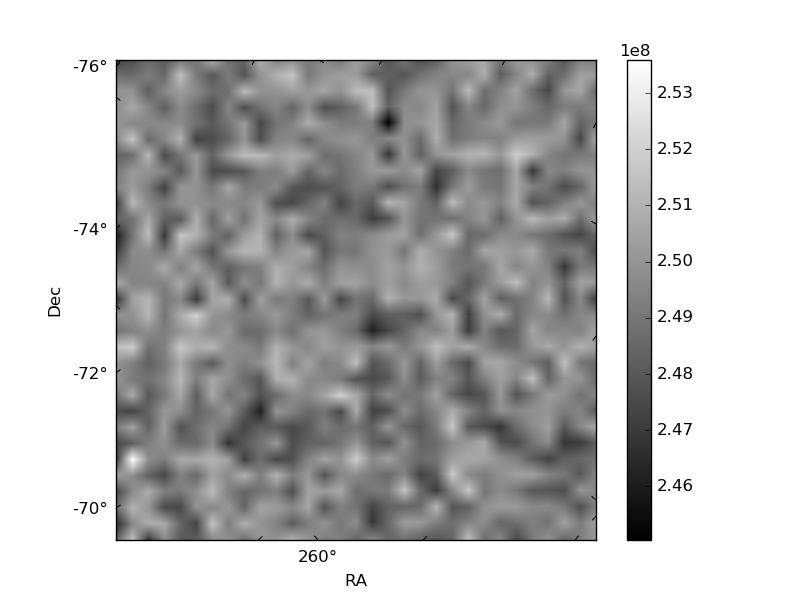
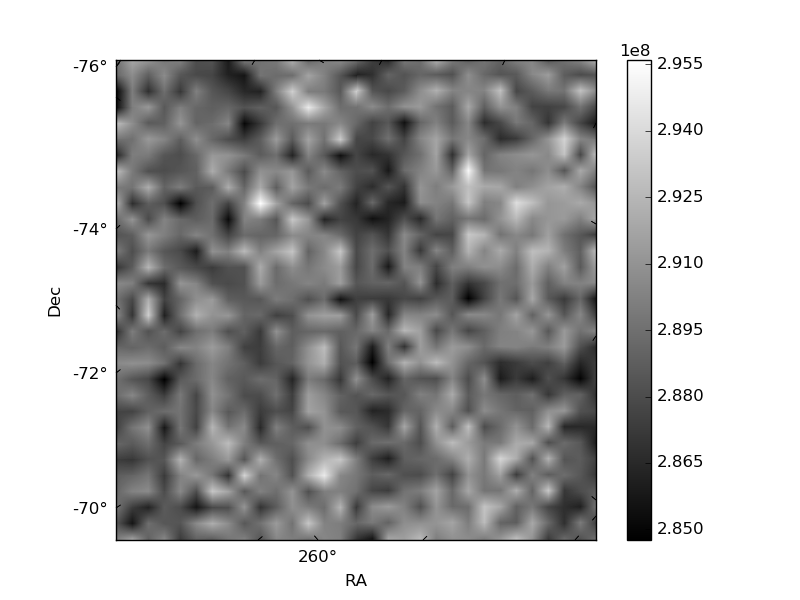
Histogram calculated using DETX and DETY for each event in the final _common_clean file
| Quadrant A |  |
 |
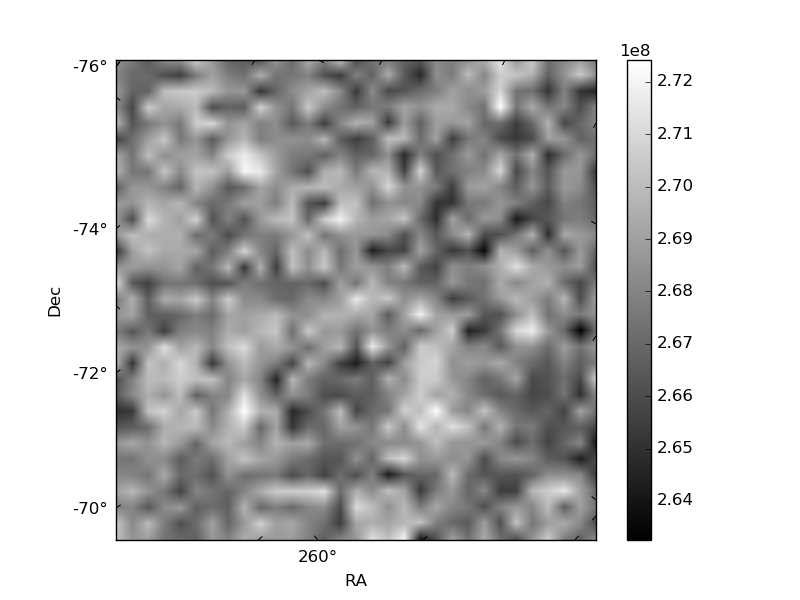
Quadrant B |
|---|---|---|---|
| Quadrant D |  |
 |
Quadrant C |
| Plot type | Count rate plots | Images |
|---|---|---|
| Comparison with Poisson distribution Blue bars denote a histogram of data divided into 1 sec bins. Red curve is a Poisson curve with rate = median count rate of data. |
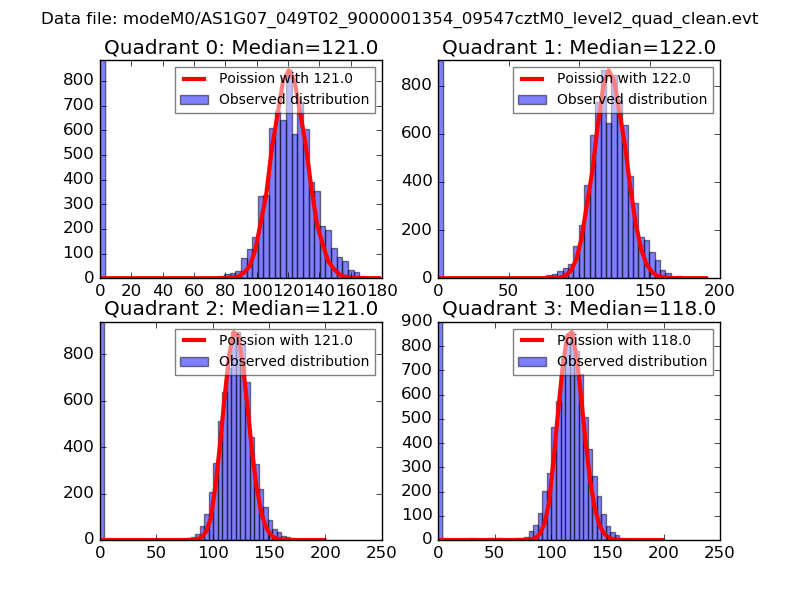 |
 |
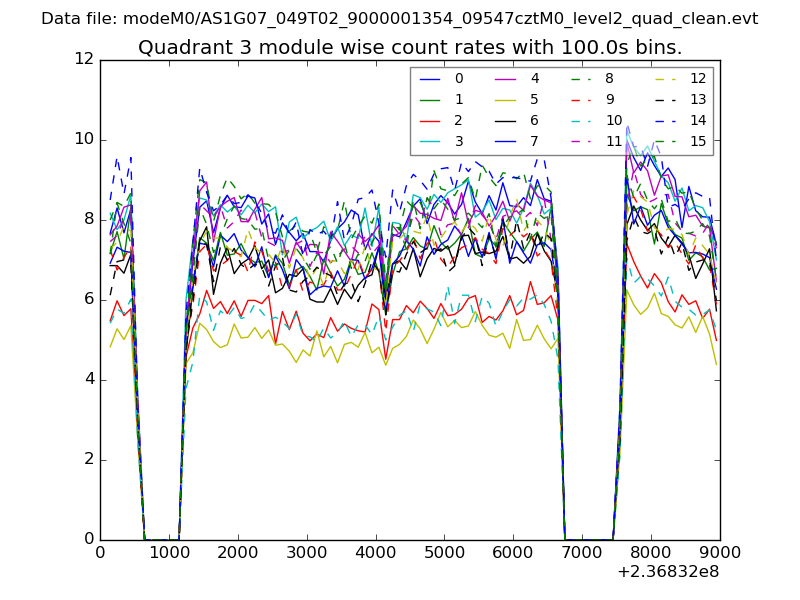
| Quadrant-wise count rates Data is divided into 100 sec bins |
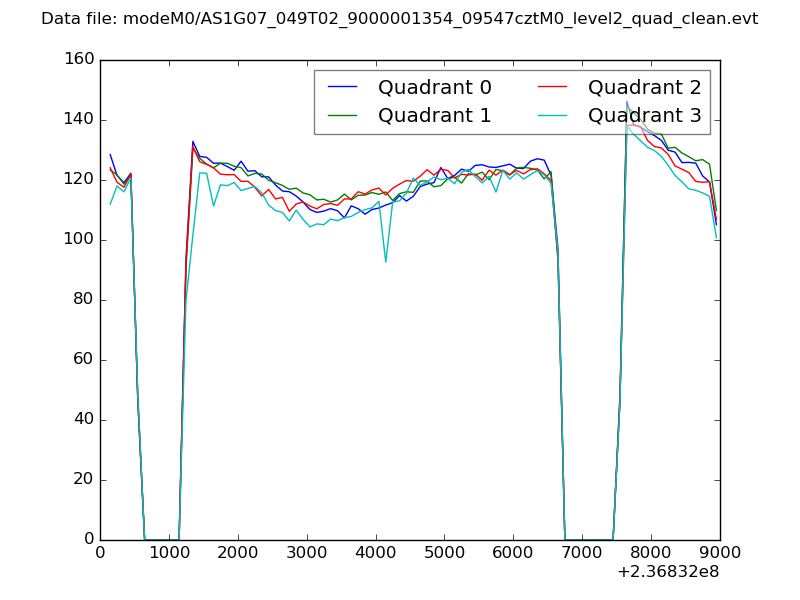 |
|
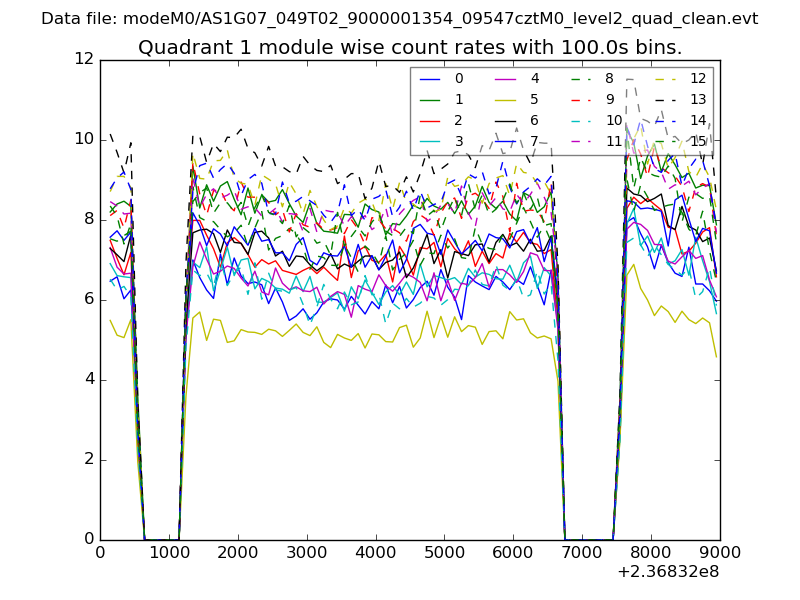
| Module-wise count rates for Quadrant A Data is divided into 100 sec bins |
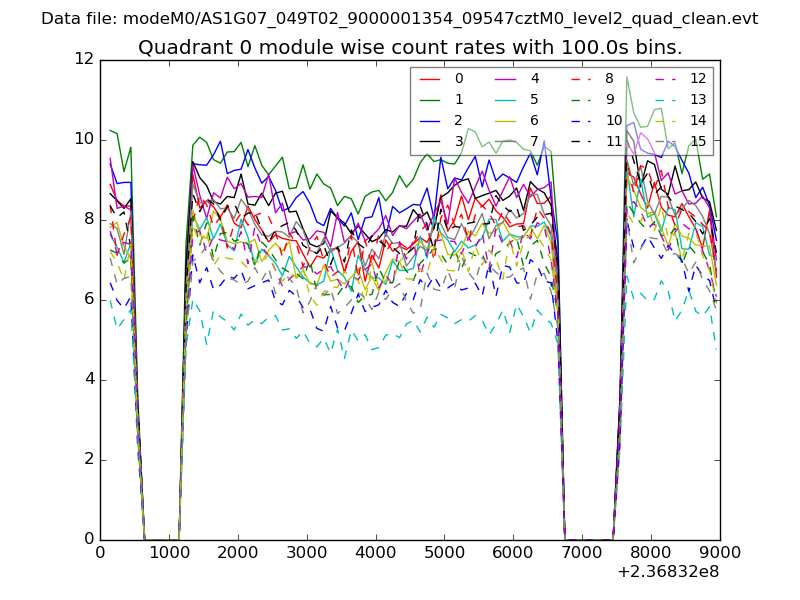 |
 |
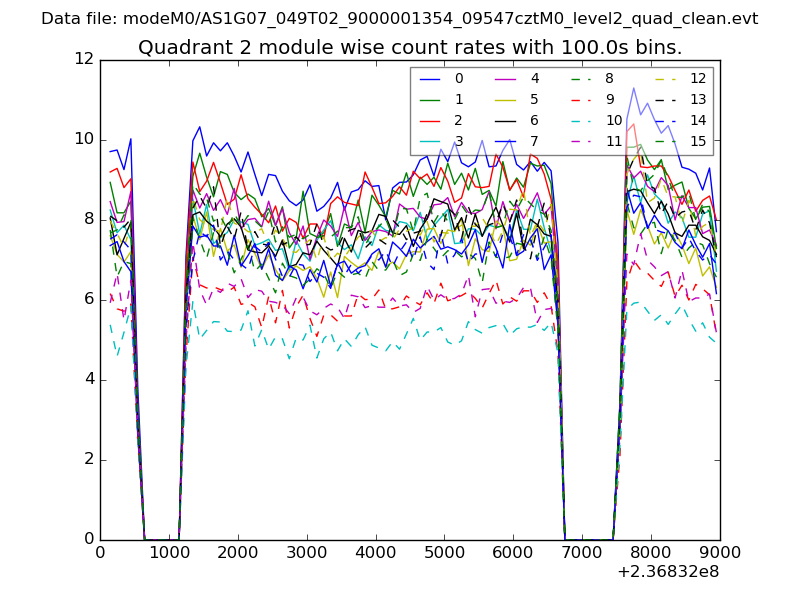
| Module-wise count rates for Quadrant B Data is divided into 100 sec bins |
 |
 |
| Module-wise count rates for Quadrant C Data is divided into 100 sec bins |
 |
 |
| Module-wise count rates for Quadrant D Data is divided into 100 sec bins |
 |
 |
| Parameter | Plot |
|---|---|
| CZT HV Monitor | 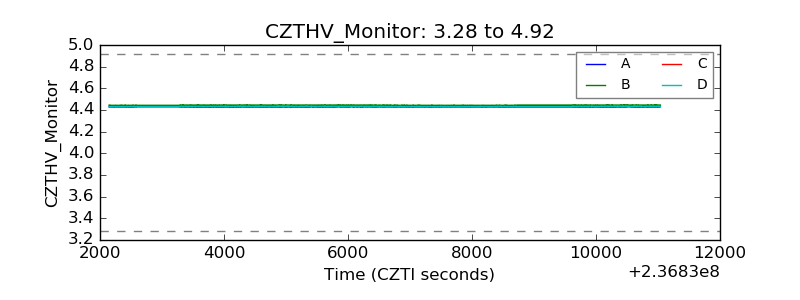 |
| D_VDD | 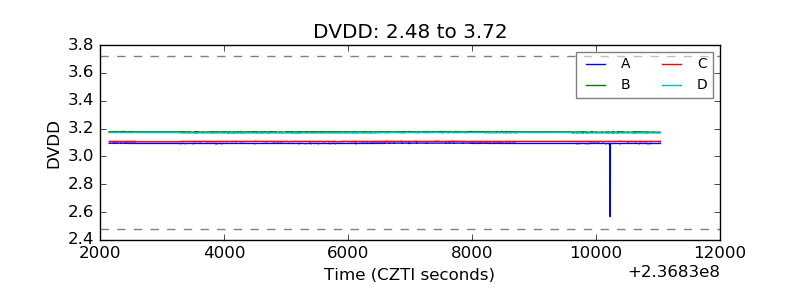 |
| Temperature 1 | 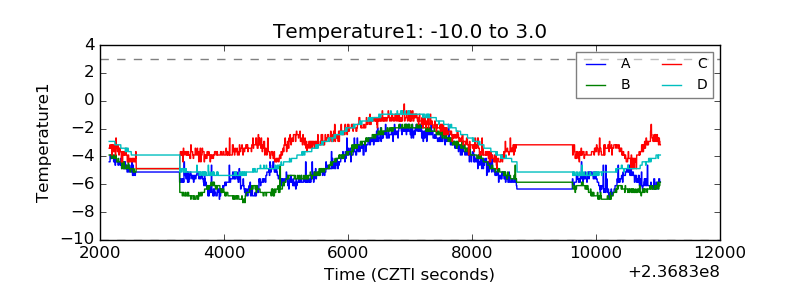 |
| Veto HV Monitor | 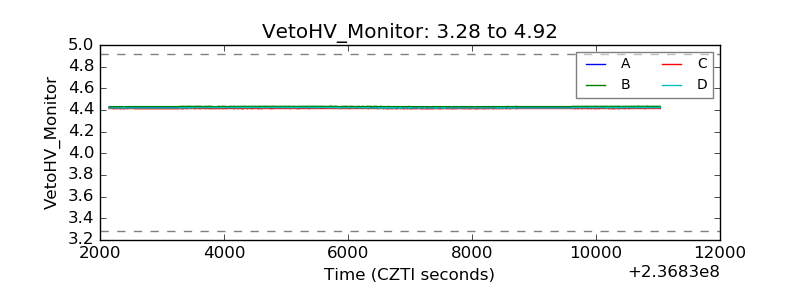 |
| Veto LLD | 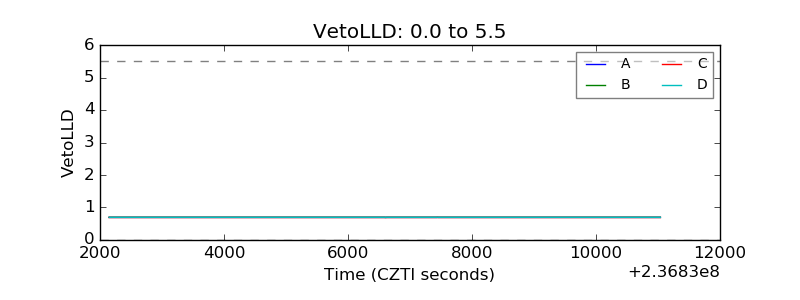 |
| Alpha Counter | 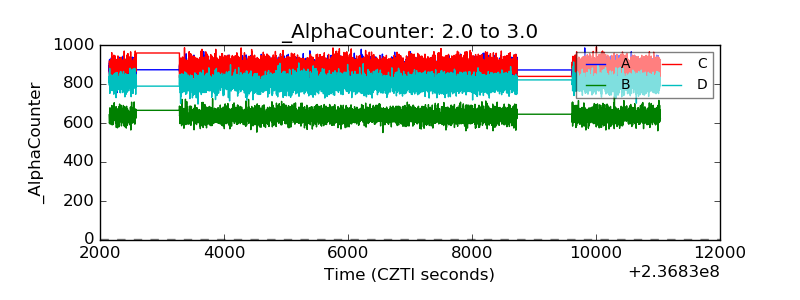 |
| _CPM_Rate | 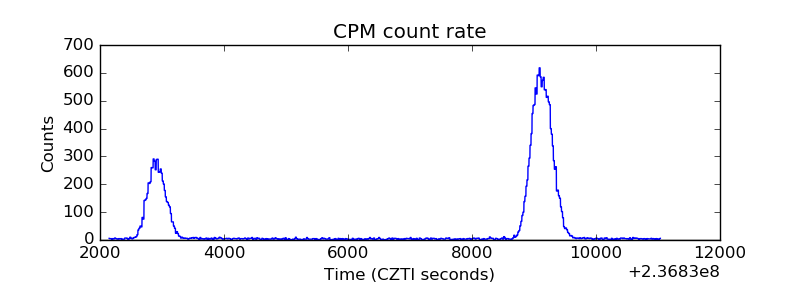 |
| CZT Counter | 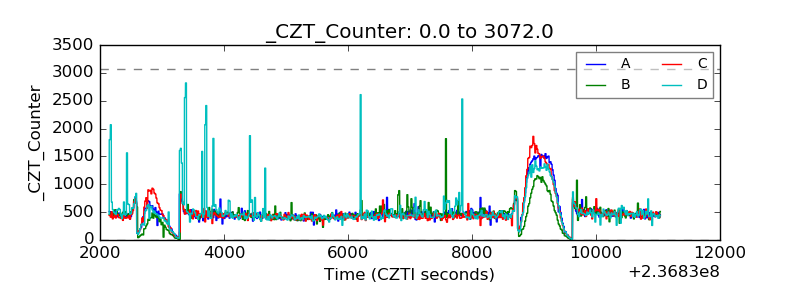 |
| +2.5 Volts monitor |  |
| +5 Volts monitor |  |
| _ROLL_ROT | 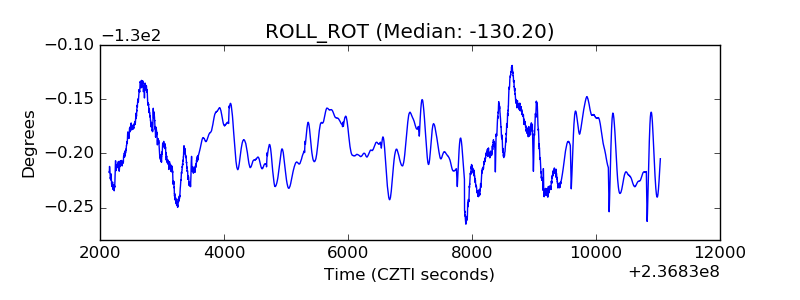 |
| _Roll_DEC | 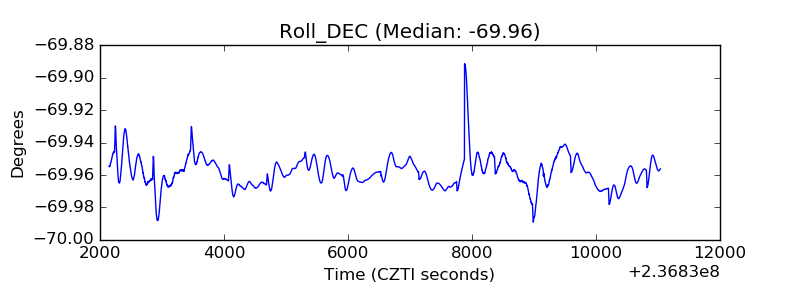 |
| _Roll_RA | 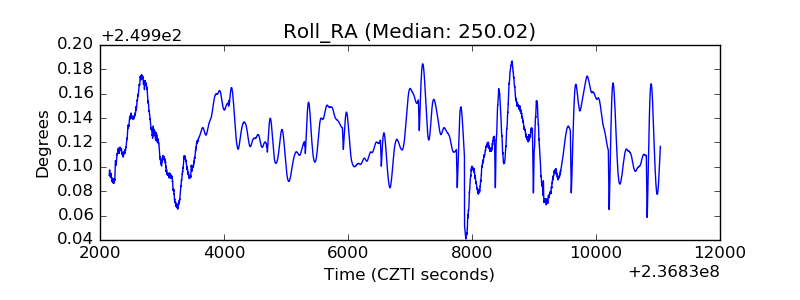 |
| Veto Counter | 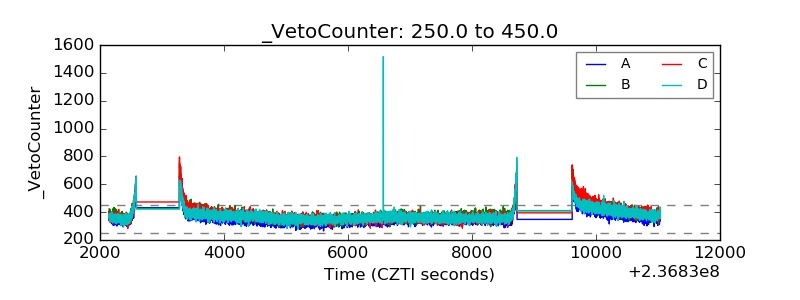 |