| Param | Original file | Final file |
|---|---|---|
| Filename | modeM0/AS1G07_049T02_9000001354_09550cztM0_level2.evt | modeM0/AS1G07_049T02_9000001354_09550cztM0_level2_quad_clean.evt |
| Size (bytes) | 442,255,680 | 124,260,480 |
| Size | 421.8 MB | 118.5 MB |
| Events in quadrant A | 3,274,423 | 835,708 |
| Events in quadrant B | 3,198,600 | 846,210 |
| Events in quadrant C | 2,903,132 | 838,074 |
| Events in quadrant D | 3,595,429 | 810,211 |
| Mode SS | |||
|---|---|---|---|
| Quadrant | BADHDUFLAG | Total packets | Discarded packets |
| A | 0 | 128 | 8 |
| B | 0 | 128 | 0 |
| C | 0 | 128 | 0 |
| D | 0 | 128 | 0 |
| Mode M9 | |||
|---|---|---|---|
| Quadrant | BADHDUFLAG | Total packets | Discarded packets |
| A | 0 | 12 | 0 |
| B | 0 | 12 | 0 |
| C | 0 | 12 | 0 |
| D | 0 | 12 | 0 |
| Mode M0 | |||
|---|---|---|---|
| Quadrant | BADHDUFLAG | Total packets | Discarded packets |
| A | 0 | 13894 | 192 |
| B | 0 | 13546 | 141 |
| C | 0 | 13038 | 169 |
| D | 0 | 15020 | 162 |
| Quadrant | Total seconds | Saturated seconds | Saturation percentage |
|---|---|---|---|
| A | 6203 | 38 | 0.612607% |
| B | 6223 | 51 | 0.819540% |
| C | 6205 | 23 | 0.370669% |
| D | 6220 | 50 | 0.803859% |
Noise dominated data is calculated using 1-second bins in cleaned event files. If a bin has >2000 counts, and if more than 50% of those come from <1% of pixels, then it is considered to be noise-dominated and hence unusable.
| Quadrant | # 1 sec bins | Bins with >0 counts | Bins with >2000 counts | High rate bins dominated by noise | Noise dominated (total time) | Noise dominated (detector-on time) | Marked lightcurve |
|---|---|---|---|---|---|---|---|
| A | 7471 | 6281 | 0 | 0 | 0.00% | 0.00% | 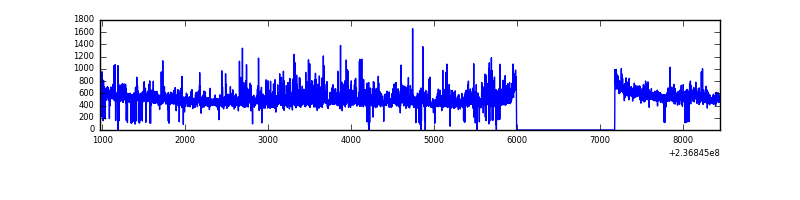 |
| B | 7471 | 6283 | 8 | 8 | 0.11% | 0.13% | 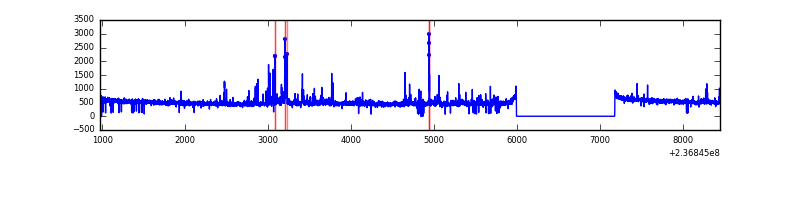 |
| C | 7471 | 6280 | 1 | 1 | 0.01% | 0.02% | 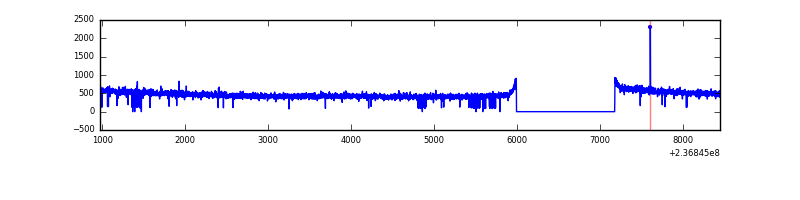 |
| D | 7471 | 6284 | 30 | 30 | 0.40% | 0.48% | 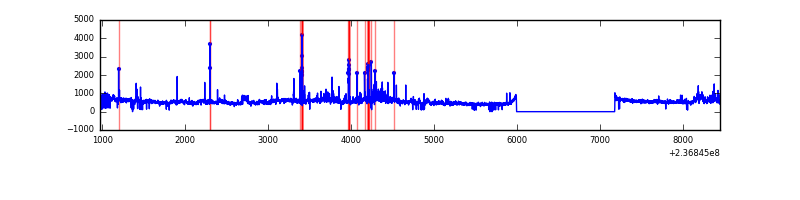 |
Top three noisy pixels from each quadrant. If the there are fewer than three noisy pixels in the level2.evt file, extra rows are filled as -1
| Pixel properties | Quadrant properties | ||||||
|---|---|---|---|---|---|---|---|
| Quadrant | DetID | PixID | Counts | Sigma | Mean | Median | Sigma |
| A | 1 | 162 | 163723 | 1078.14 | 759 | 744 | 151.2 |
| A | 1 | 178 | 68911 | 450.94 | 759 | 744 | 151.2 |
| A | 1 | 161 | 66909 | 437.7 | 759 | 744 | 151.2 |
| B | 15 | 85 | 74675 | 523.36 | 761 | 743 | 141.3 |
| B | 0 | 214 | 44488 | 309.67 | 761 | 743 | 141.3 |
| B | 4 | 81 | 34695 | 240.35 | 761 | 743 | 141.3 |
| C | 13 | 61 | 5596 | 28.81 | 742 | 748 | 168.3 |
| C | 14 | 234 | 5337 | 27.27 | 742 | 748 | 168.3 |
| C | 8 | 222 | 2059 | 7.79 | 742 | 748 | 168.3 |
| D | 12 | 227 | 520141 | 2921.66 | 739 | 723 | 177.8 |
| D | 1 | 52 | 120402 | 673.18 | 739 | 723 | 177.8 |
| D | 13 | 122 | 49458 | 274.13 | 739 | 723 | 177.8 |
Histogram calculated using DETX and DETY for each event in the final _common_clean file
| Quadrant A | 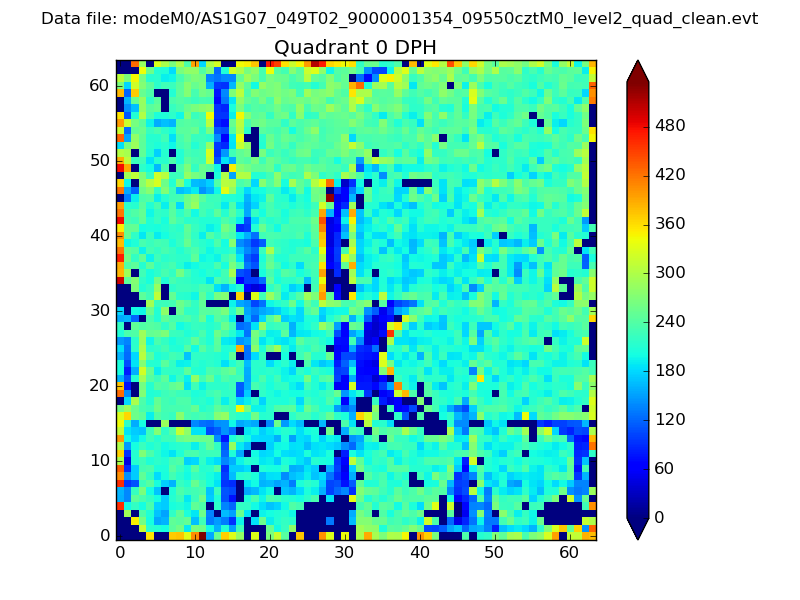 |
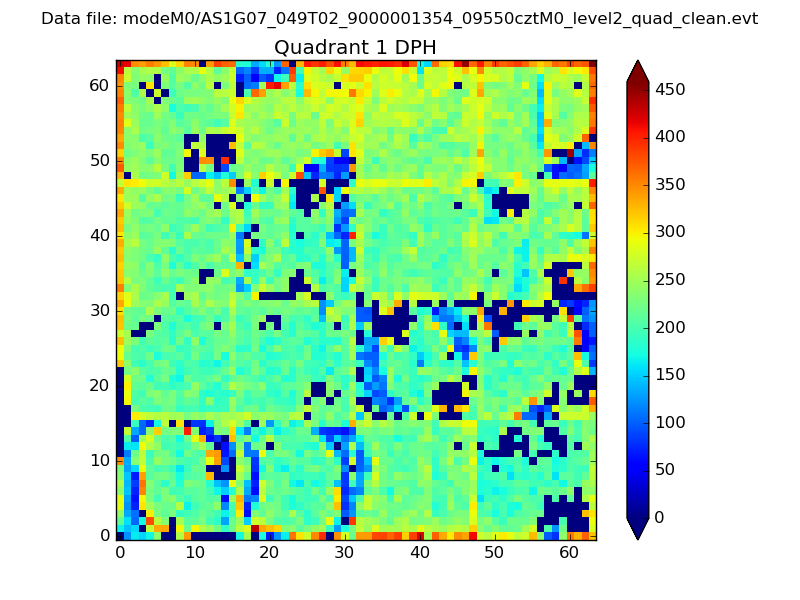 |
Quadrant B |
|---|---|---|---|
| Quadrant D | 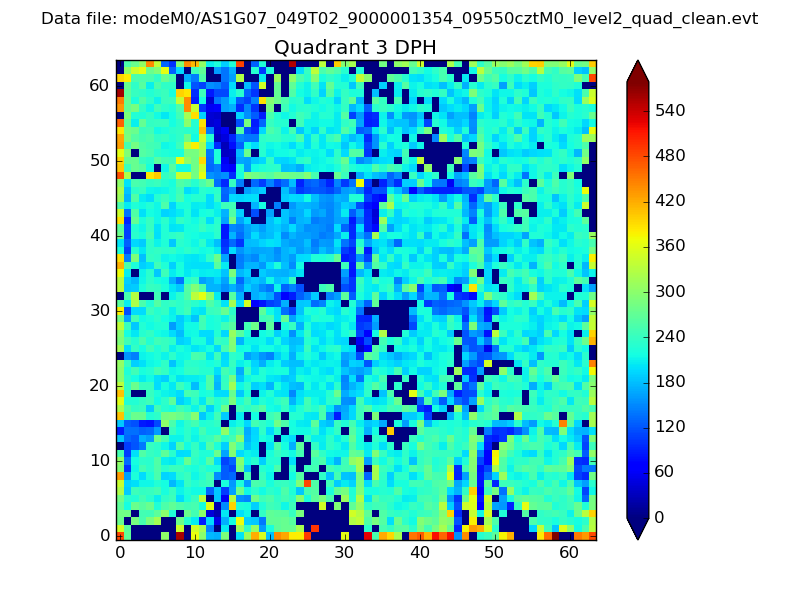 |
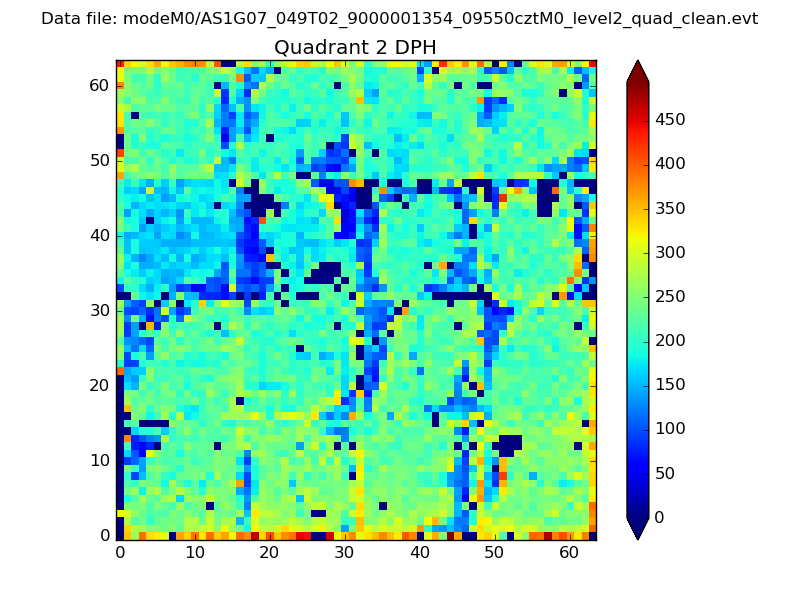 |
Quadrant C |
| Plot type | Count rate plots | Images |
|---|---|---|
| Comparison with Poisson distribution Blue bars denote a histogram of data divided into 1 sec bins. Red curve is a Poisson curve with rate = median count rate of data. |
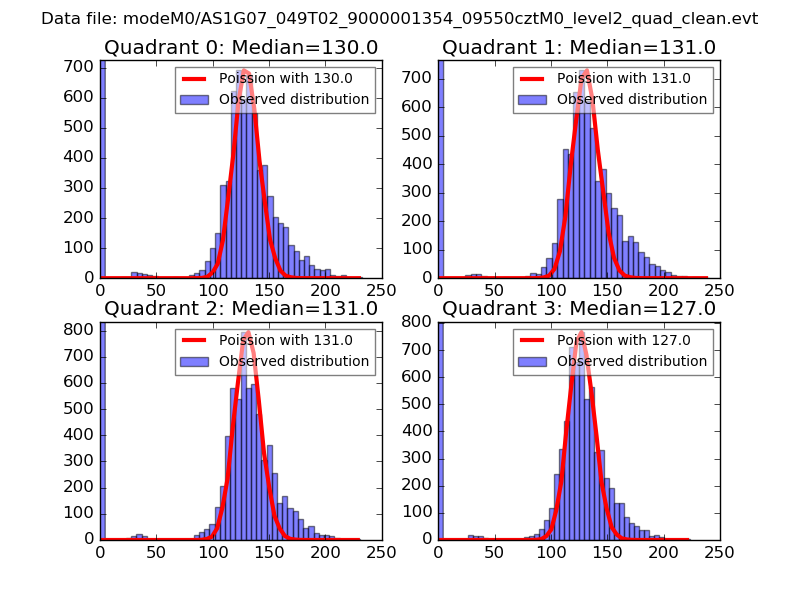 |
 |
| Quadrant-wise count rates Data is divided into 100 sec bins |
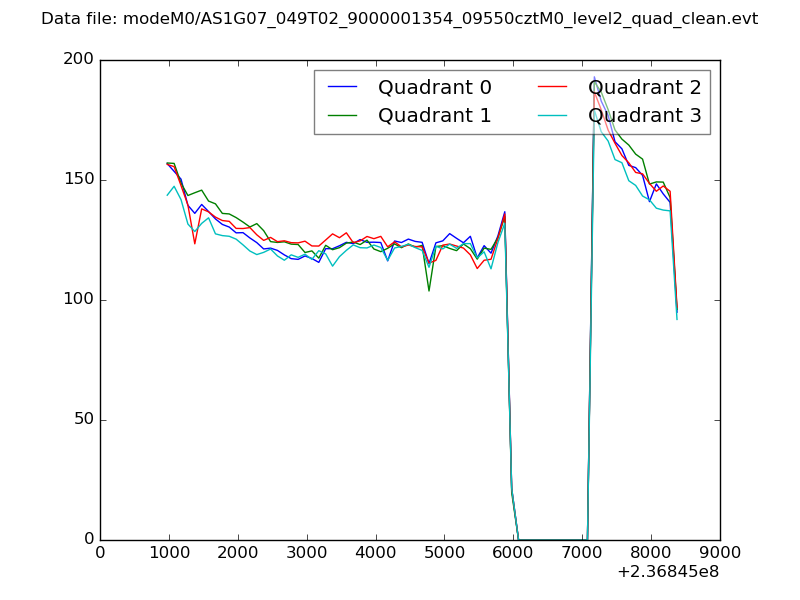 |
|
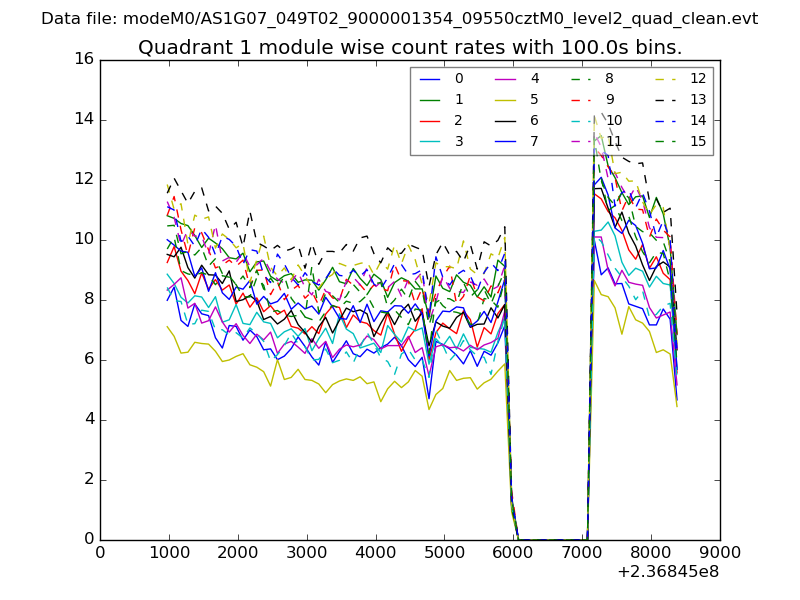
| Module-wise count rates for Quadrant A Data is divided into 100 sec bins |
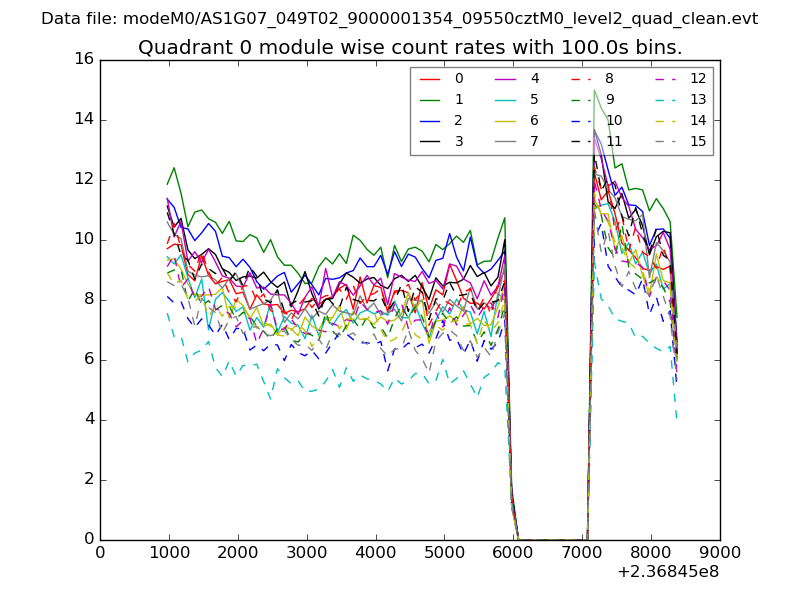 |
 |
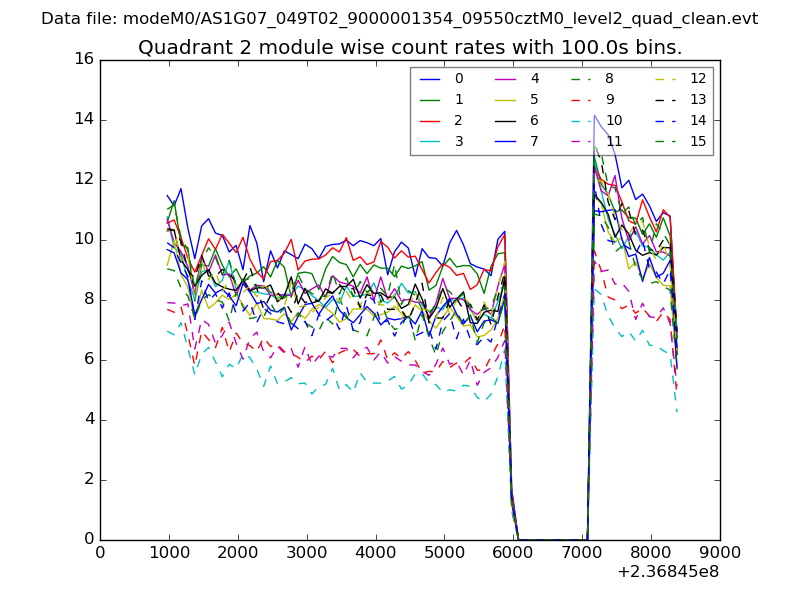
| Module-wise count rates for Quadrant B Data is divided into 100 sec bins |
 |
 |
| Module-wise count rates for Quadrant C Data is divided into 100 sec bins |
 |
 |
| Module-wise count rates for Quadrant D Data is divided into 100 sec bins |
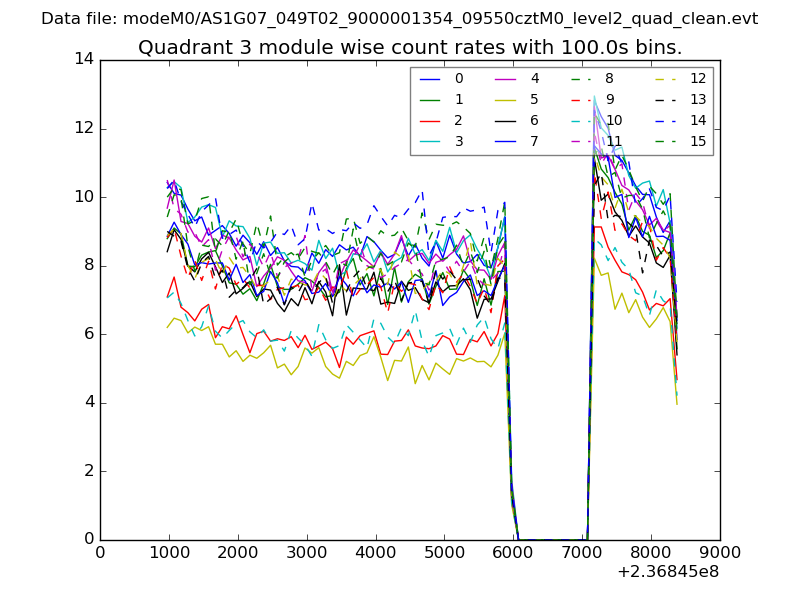 |
 |
| Parameter | Plot |
|---|---|
| CZT HV Monitor | 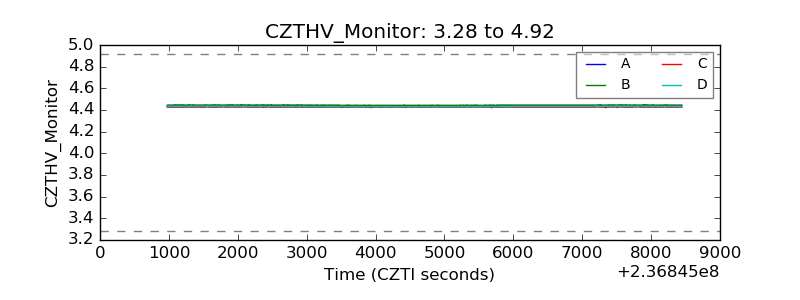 |
| D_VDD | 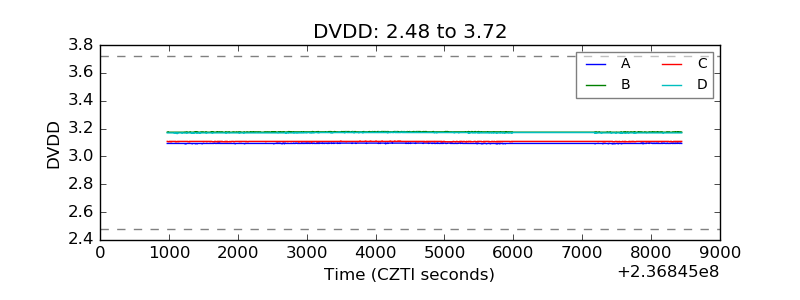 |
| Temperature 1 | 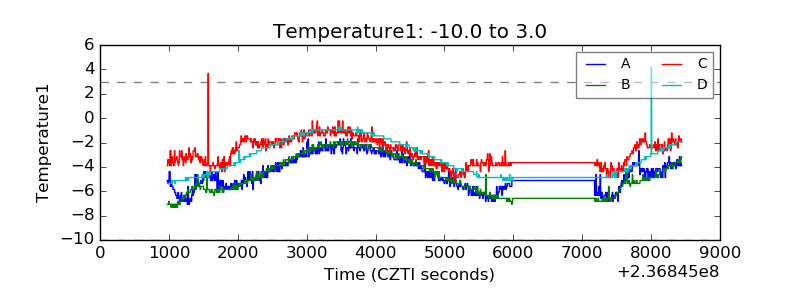 |
| Veto HV Monitor | 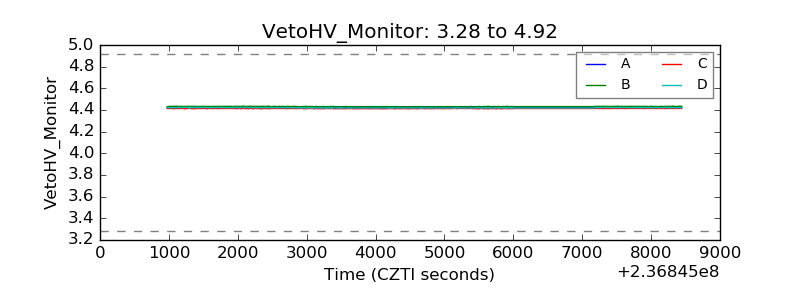 |
| Veto LLD | 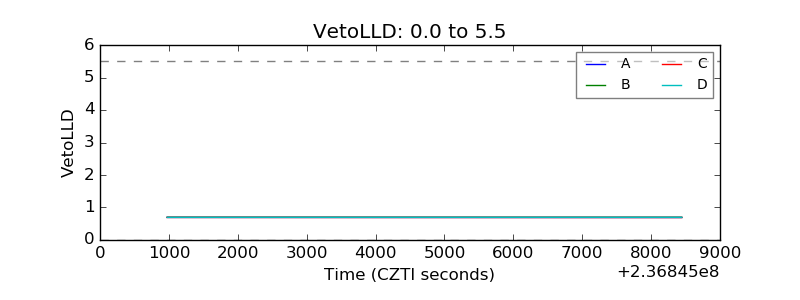 |
| Alpha Counter | 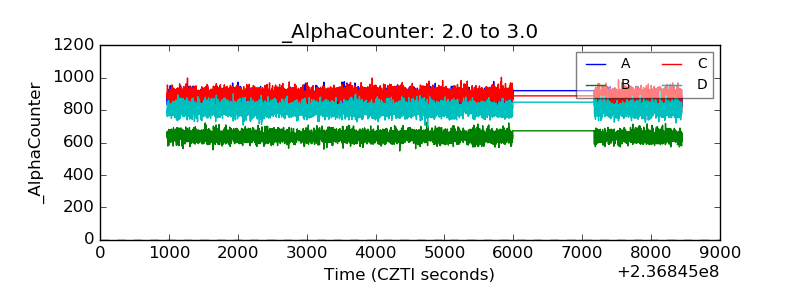 |
| _CPM_Rate |  |
| CZT Counter |  |
| +2.5 Volts monitor |  |
| +5 Volts monitor |  |
| _ROLL_ROT | 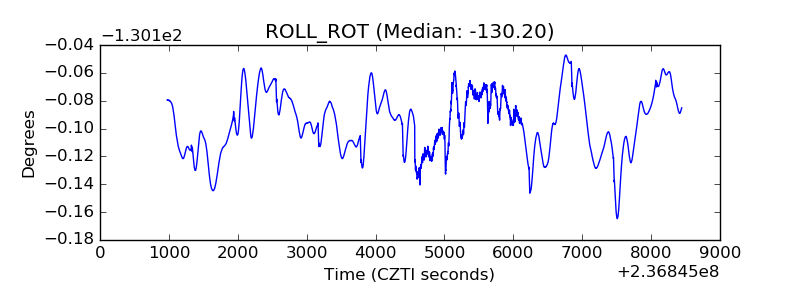 |
| _Roll_DEC | 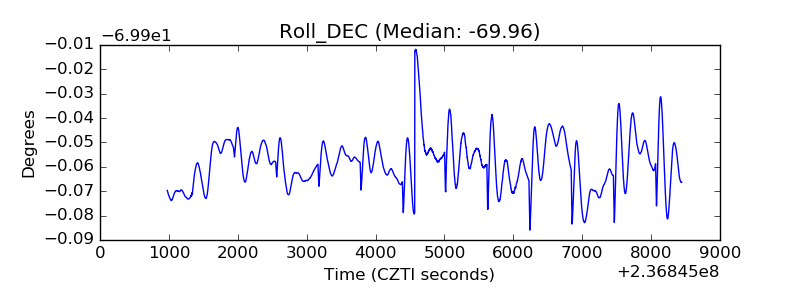 |
| _Roll_RA |  |
| Veto Counter | 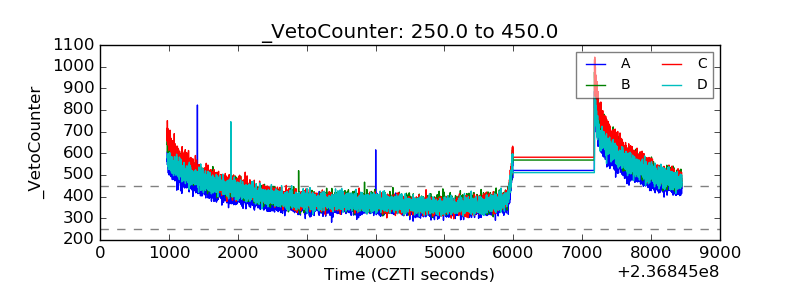 |