| Param | Original file | Final file |
|---|---|---|
| Filename | modeM0/AS1G07_049T02_9000001354_09552cztM0_level2.evt | modeM0/AS1G07_049T02_9000001354_09552cztM0_level2_quad_clean.evt |
| Size (bytes) | 253,644,480 | 74,888,640 |
| Size | 241.9 MB | 71.4 MB |
| Events in quadrant A | 1,734,847 | 514,479 |
| Events in quadrant B | 1,936,515 | 515,102 |
| Events in quadrant C | 1,661,645 | 509,778 |
| Events in quadrant D | 2,114,415 | 485,675 |
| Mode SS | |||
|---|---|---|---|
| Quadrant | BADHDUFLAG | Total packets | Discarded packets |
| A | 0 | 68 | 0 |
| B | 0 | 68 | 0 |
| C | 0 | 68 | 0 |
| D | 0 | 68 | 0 |
| Mode M0 | |||
|---|---|---|---|
| Quadrant | BADHDUFLAG | Total packets | Discarded packets |
| A | 0 | 7326 | 1 |
| B | 0 | 7971 | 1 |
| C | 0 | 7248 | 1 |
| D | 0 | 8447 | 1 |
| Quadrant | Total seconds | Saturated seconds | Saturation percentage |
|---|---|---|---|
| A | 3426 | 10 | 0.291886% |
| B | 3426 | 22 | 0.642148% |
| C | 3426 | 5 | 0.145943% |
| D | 3427 | 81 | 2.363583% |
Noise dominated data is calculated using 1-second bins in cleaned event files. If a bin has >2000 counts, and if more than 50% of those come from <1% of pixels, then it is considered to be noise-dominated and hence unusable.
| Quadrant | # 1 sec bins | Bins with >0 counts | Bins with >2000 counts | High rate bins dominated by noise | Noise dominated (total time) | Noise dominated (detector-on time) | Marked lightcurve |
|---|---|---|---|---|---|---|---|
| A | 3426 | 3426 | 0 | 0 | 0.00% | 0.00% |  |
| B | 3426 | 3426 | 5 | 5 | 0.15% | 0.15% | 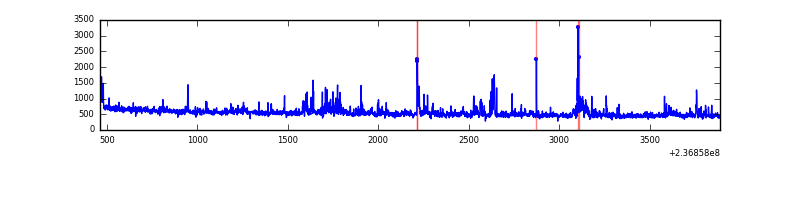 |
| C | 3426 | 3426 | 0 | 0 | 0.00% | 0.00% | 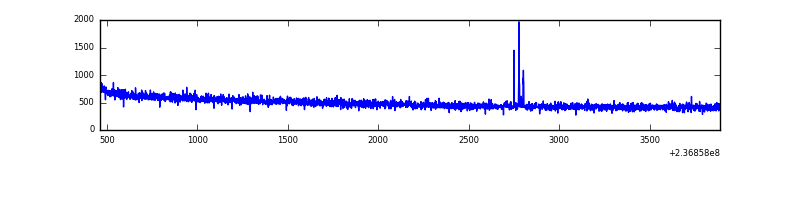 |
| D | 3427 | 3427 | 41 | 41 | 1.20% | 1.20% |  |
Top three noisy pixels from each quadrant. If the there are fewer than three noisy pixels in the level2.evt file, extra rows are filled as -1
| Pixel properties | Quadrant properties | ||||||
|---|---|---|---|---|---|---|---|
| Quadrant | DetID | PixID | Counts | Sigma | Mean | Median | Sigma |
| A | 1 | 162 | 17885 | 197.45 | 443 | 435 | 88.4 |
| A | 1 | 178 | 5024 | 51.93 | 443 | 435 | 88.4 |
| A | 1 | 161 | 4710 | 48.37 | 443 | 435 | 88.4 |
| B | 4 | 80 | 110591 | 1358.88 | 437 | 428 | 81.1 |
| B | 4 | 81 | 54778 | 670.42 | 437 | 428 | 81.1 |
| B | 0 | 214 | 50223 | 614.23 | 437 | 428 | 81.1 |
| C | 14 | 234 | 10973 | 108.33 | 423 | 425 | 97.4 |
| C | 13 | 61 | 3128 | 27.76 | 423 | 425 | 97.4 |
| C | 8 | 222 | 1459 | 10.62 | 423 | 425 | 97.4 |
| D | 12 | 227 | 245071 | 2360.12 | 418 | 410 | 103.7 |
| D | 7 | 71 | 162056 | 1559.32 | 418 | 410 | 103.7 |
| D | 12 | 233 | 32302 | 307.65 | 418 | 410 | 103.7 |
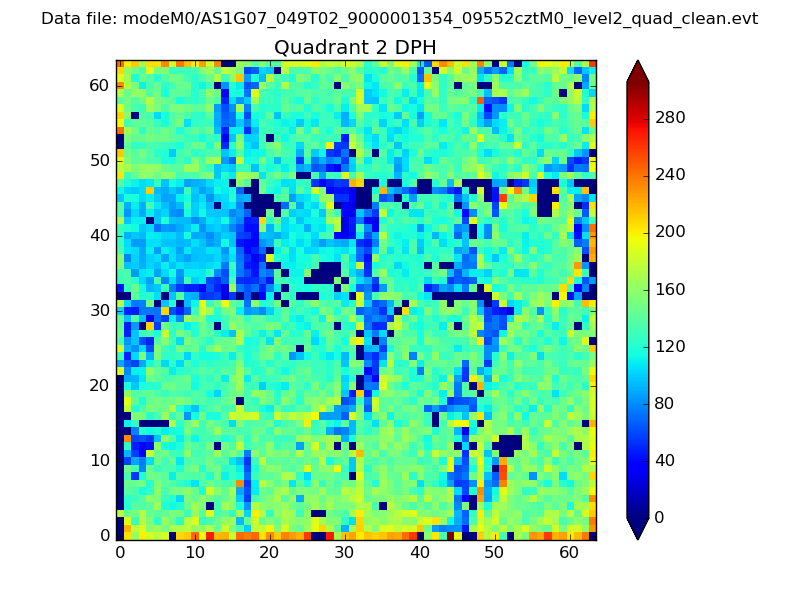
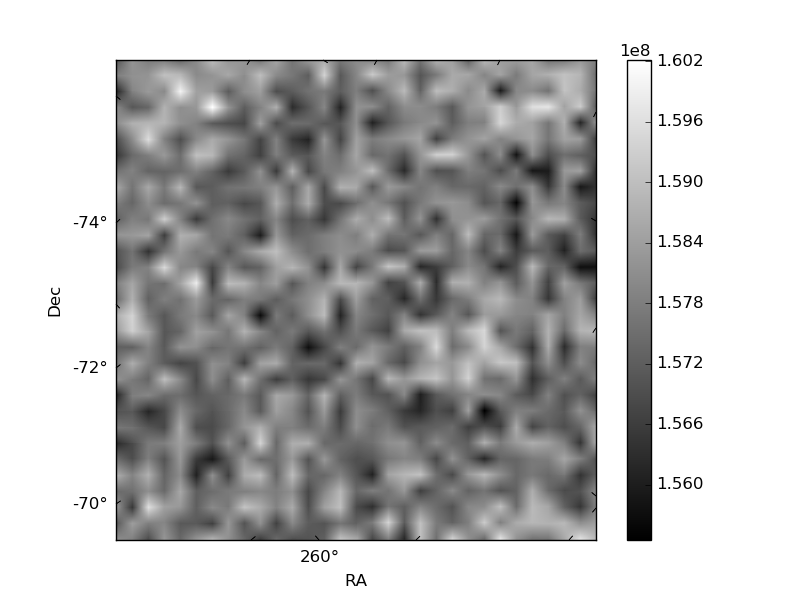
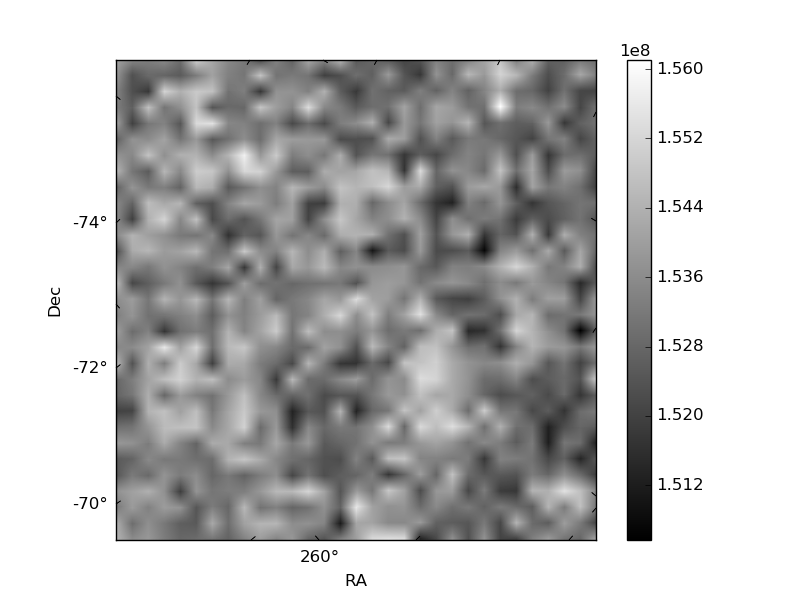
Histogram calculated using DETX and DETY for each event in the final _common_clean file
| Quadrant A | 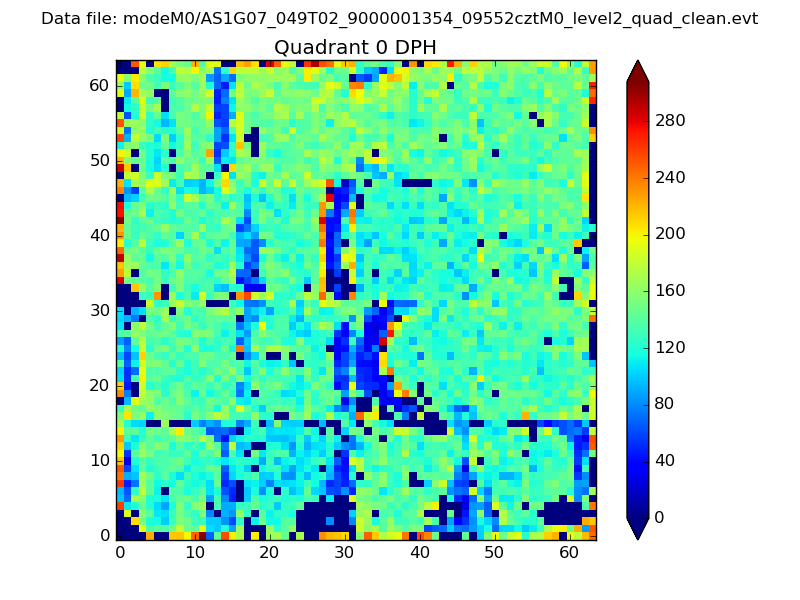 |
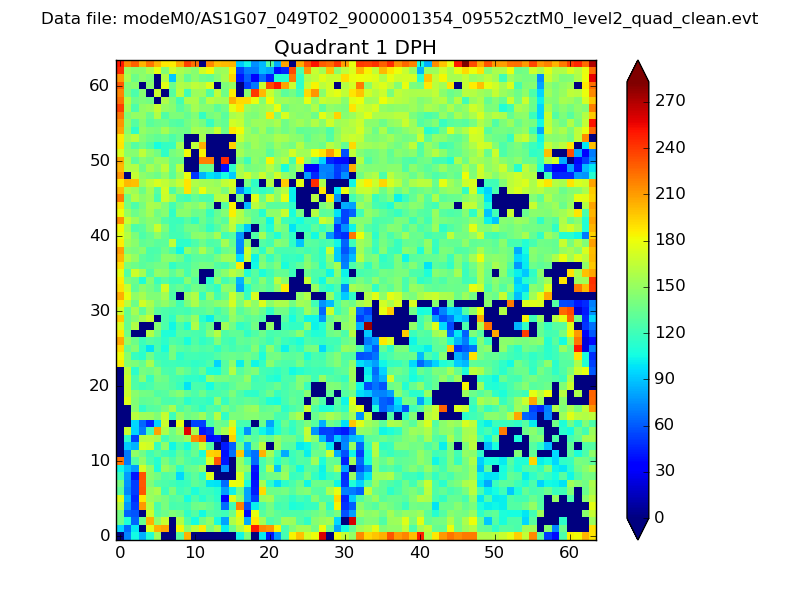 |
Quadrant B |
|---|---|---|---|
| Quadrant D | 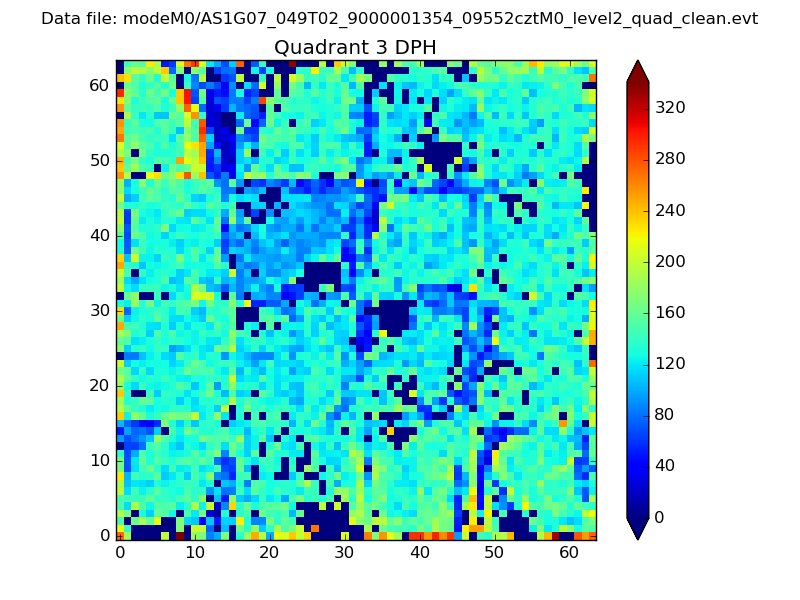 |
 |
Quadrant C |
| Plot type | Count rate plots | Images |
|---|---|---|
| Comparison with Poisson distribution Blue bars denote a histogram of data divided into 1 sec bins. Red curve is a Poisson curve with rate = median count rate of data. |
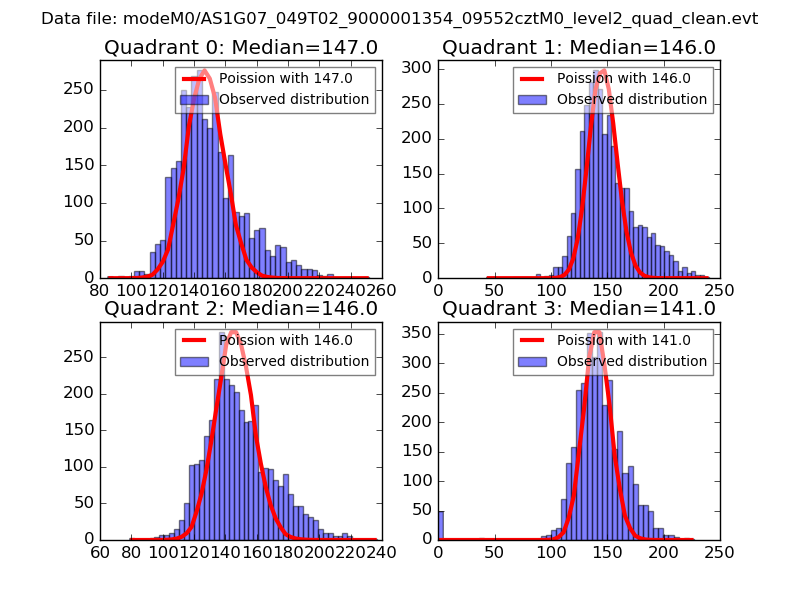 |
 |
| Quadrant-wise count rates Data is divided into 100 sec bins |
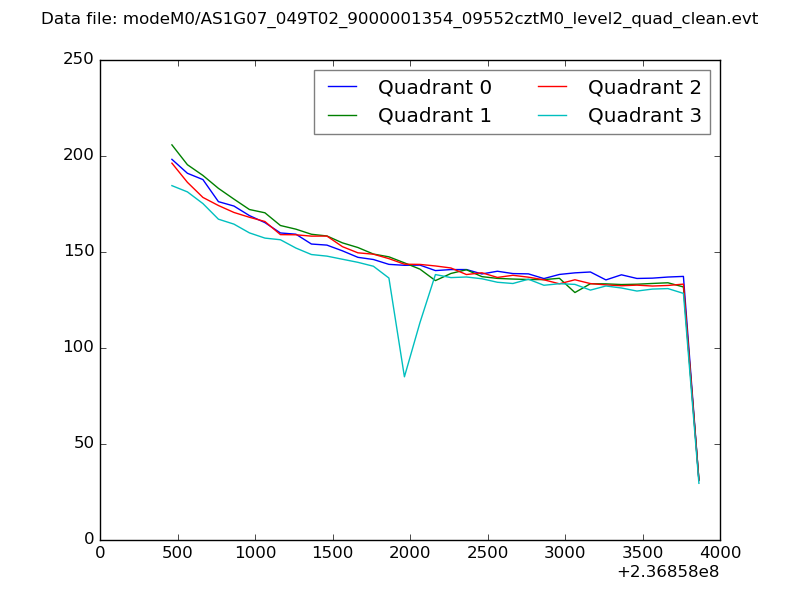 |
|
| Module-wise count rates for Quadrant A Data is divided into 100 sec bins |
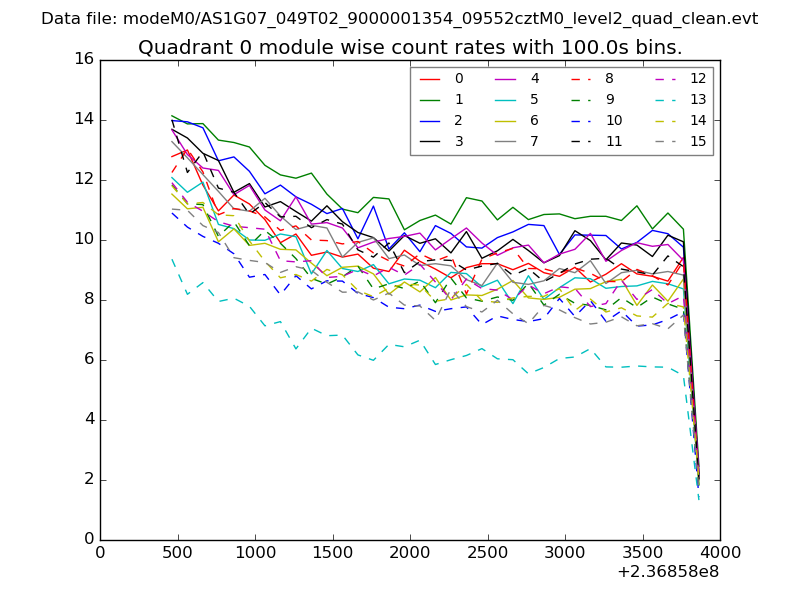 |
 |
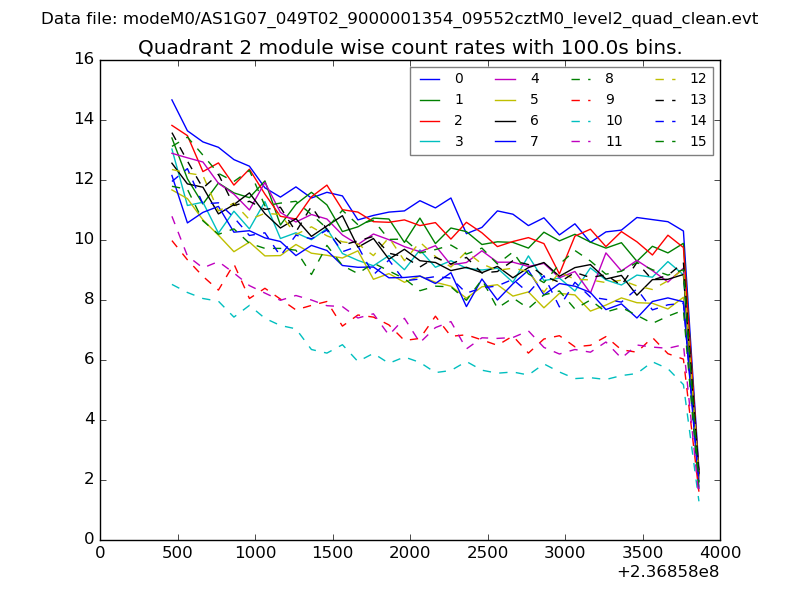
| Module-wise count rates for Quadrant B Data is divided into 100 sec bins |
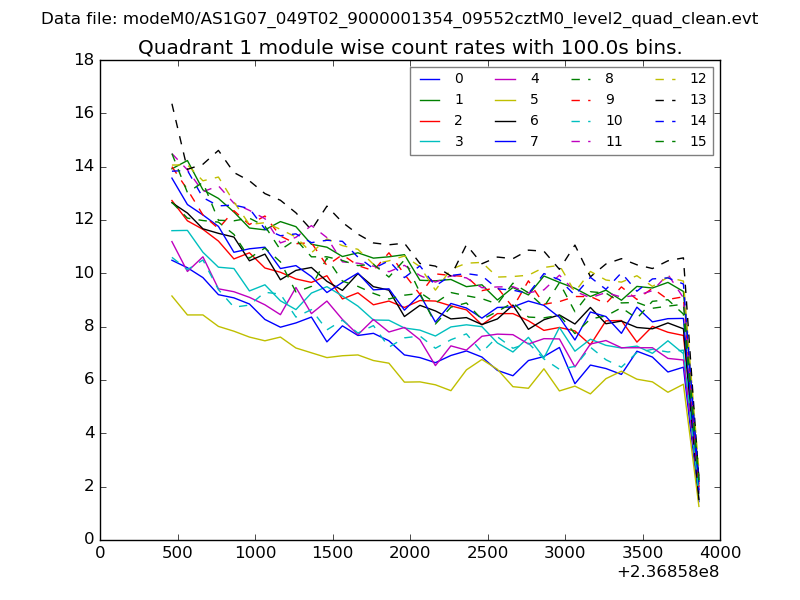 |
 |
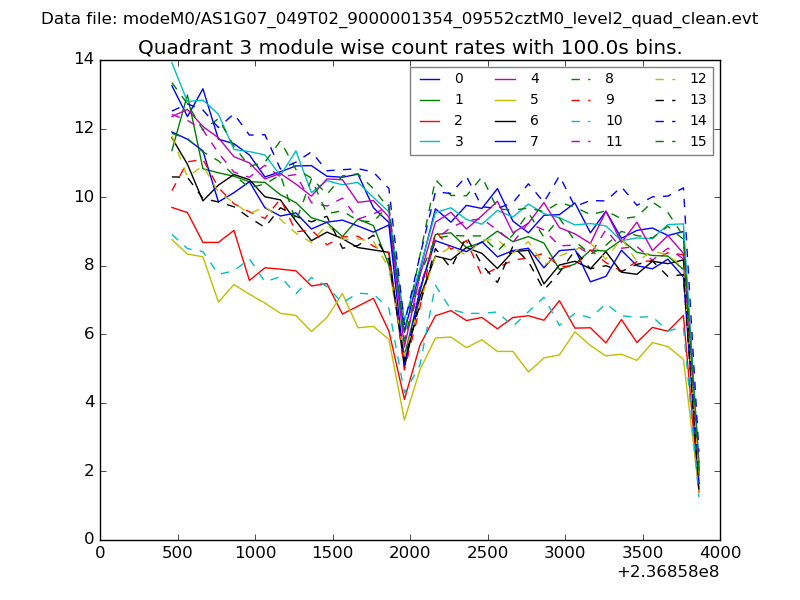
| Module-wise count rates for Quadrant C Data is divided into 100 sec bins |
 |
 |
| Module-wise count rates for Quadrant D Data is divided into 100 sec bins |
 |
 |
| Parameter | Plot |
|---|---|
| CZT HV Monitor | 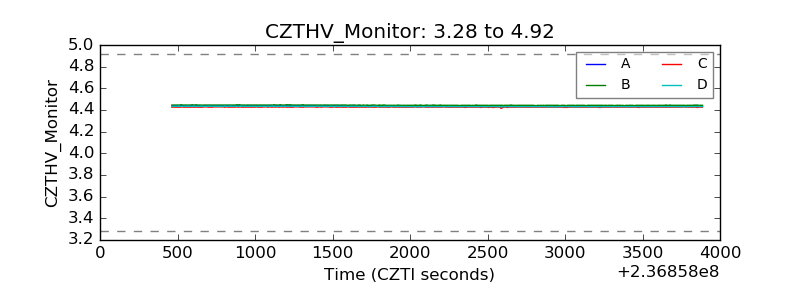 |
| D_VDD | 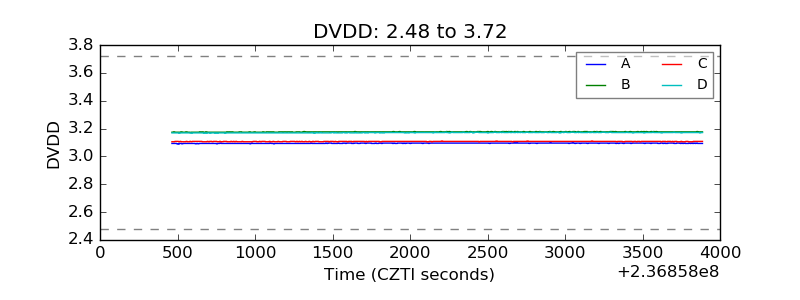 |
| Temperature 1 | 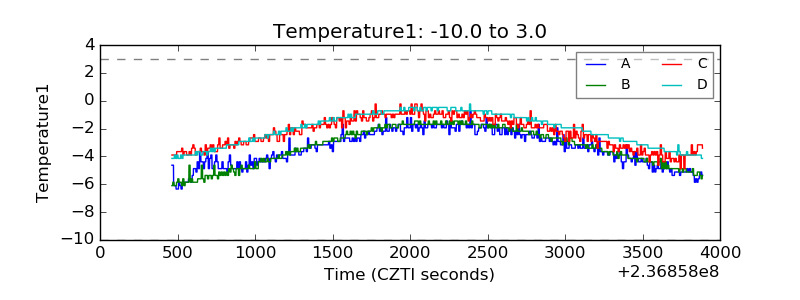 |
| Veto HV Monitor | 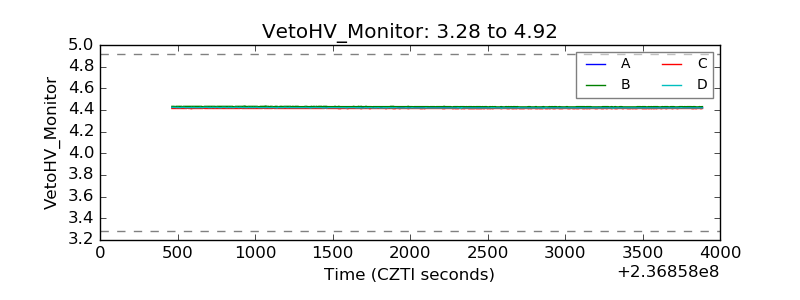 |
| Veto LLD | 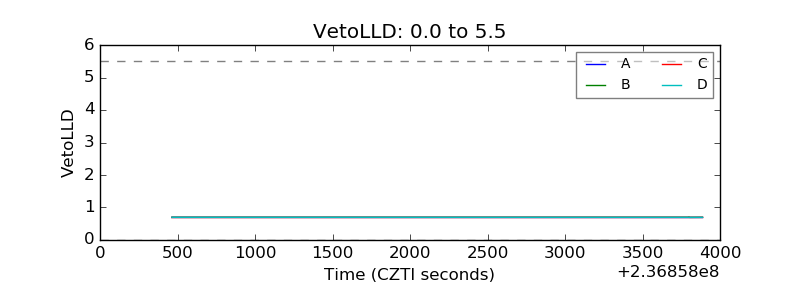 |
| Alpha Counter | 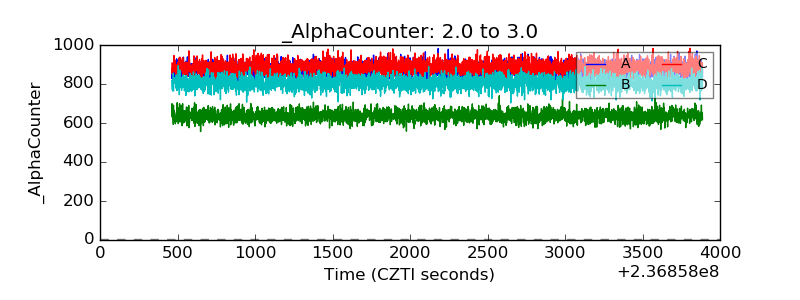 |
| _CPM_Rate | 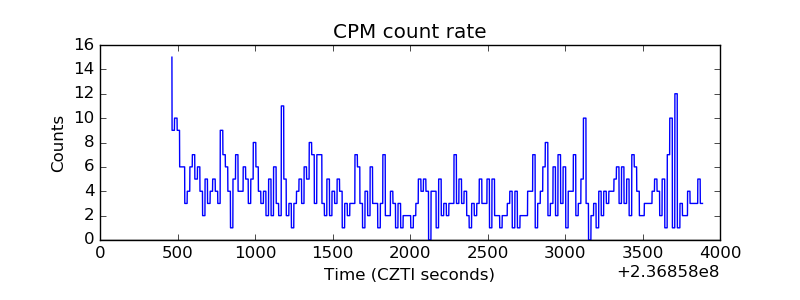 |
| CZT Counter | 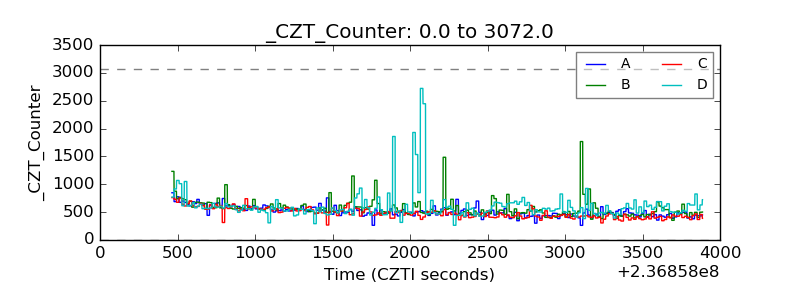 |
| +2.5 Volts monitor |  |
| +5 Volts monitor | 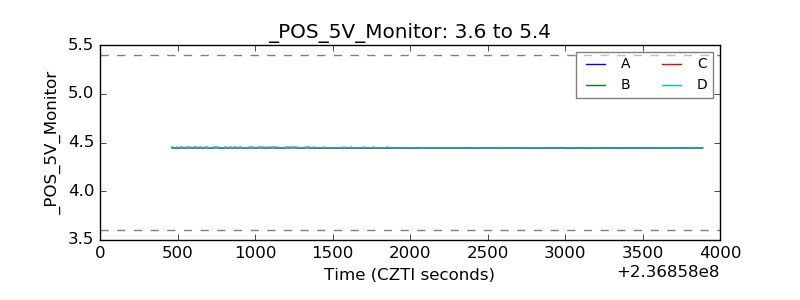 |
| _ROLL_ROT | 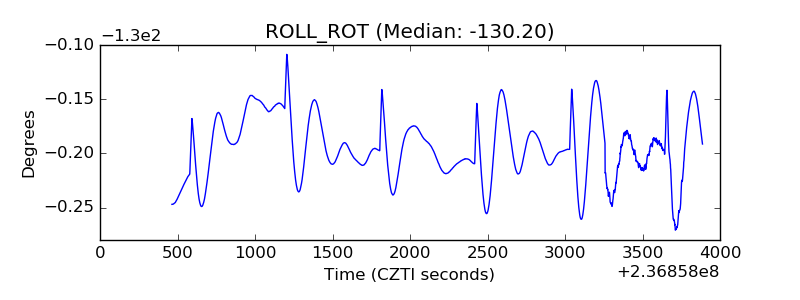 |
| _Roll_DEC |  |
| _Roll_RA | 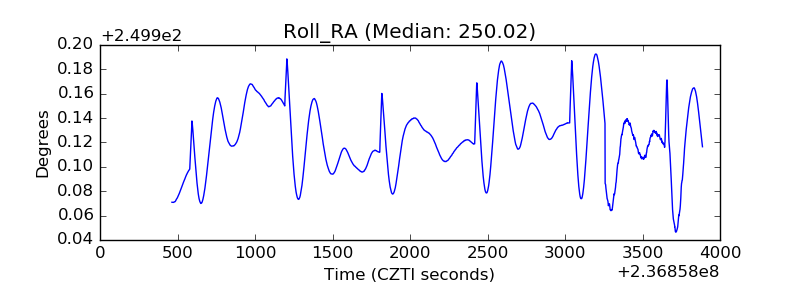 |
| Veto Counter | 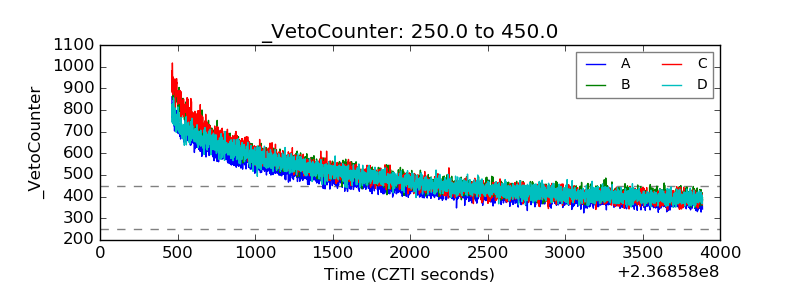 |