| Param | Original file | Final file |
|---|---|---|
| Filename | modeM0/AS1G07_069T01_9000001356_09552cztM0_level2.evt | modeM0/AS1G07_069T01_9000001356_09552cztM0_level2_quad_clean.evt |
| Size (bytes) | 140,348,160 | 24,552,000 |
| Size | 133.8 MB | 23.4 MB |
| Events in quadrant A | 1,008,560 | 157,893 |
| Events in quadrant B | 1,054,941 | 158,496 |
| Events in quadrant C | 940,318 | 154,301 |
| Events in quadrant D | 1,129,787 | 148,422 |
| Mode SS | |||
|---|---|---|---|
| Quadrant | BADHDUFLAG | Total packets | Discarded packets |
| A | 0 | 36 | 0 |
| B | 0 | 36 | 0 |
| C | 0 | 36 | 0 |
| D | 0 | 36 | 0 |
| Mode M9 | |||
|---|---|---|---|
| Quadrant | BADHDUFLAG | Total packets | Discarded packets |
| A | 0 | 13 | 0 |
| B | 0 | 13 | 0 |
| C | 0 | 13 | 0 |
| D | 0 | 13 | 0 |
| Mode M0 | |||
|---|---|---|---|
| Quadrant | BADHDUFLAG | Total packets | Discarded packets |
| A | 0 | 4050 | 2 |
| B | 0 | 4213 | 1 |
| C | 0 | 3741 | 1 |
| D | 0 | 4578 | 1 |
| Quadrant | Total seconds | Saturated seconds | Saturation percentage |
|---|---|---|---|
| A | 1683 | 109 | 6.476530% |
| B | 1683 | 117 | 6.951872% |
| C | 1683 | 87 | 5.169340% |
| D | 1683 | 104 | 6.179441% |
Noise dominated data is calculated using 1-second bins in cleaned event files. If a bin has >2000 counts, and if more than 50% of those come from <1% of pixels, then it is considered to be noise-dominated and hence unusable.
| Quadrant | # 1 sec bins | Bins with >0 counts | Bins with >2000 counts | High rate bins dominated by noise | Noise dominated (total time) | Noise dominated (detector-on time) | Marked lightcurve |
|---|---|---|---|---|---|---|---|
| A | 2973 | 1684 | 0 | 0 | 0.00% | 0.00% | 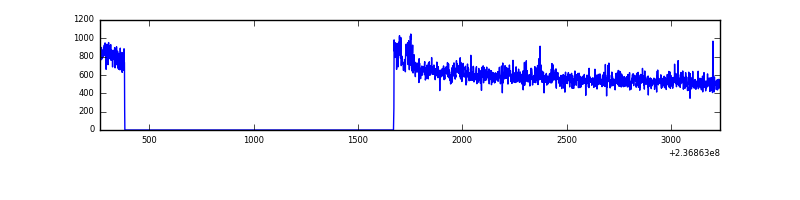 |
| B | 2973 | 1684 | 4 | 4 | 0.13% | 0.24% | 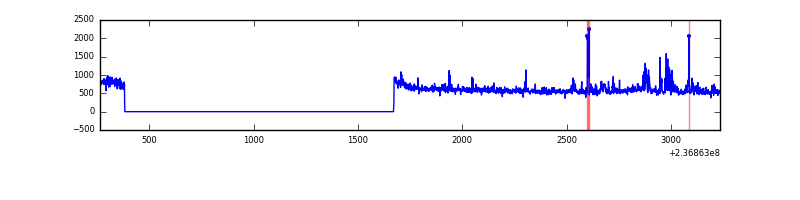 |
| C | 2973 | 1684 | 0 | 0 | 0.00% | 0.00% | 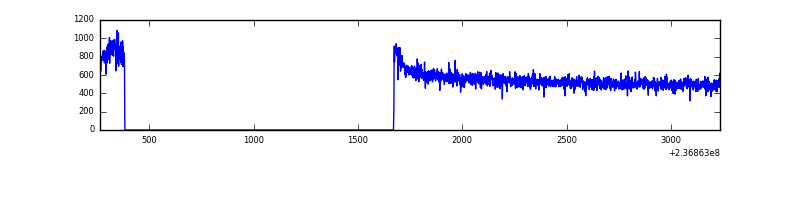 |
| D | 2973 | 1684 | 7 | 7 | 0.24% | 0.42% | 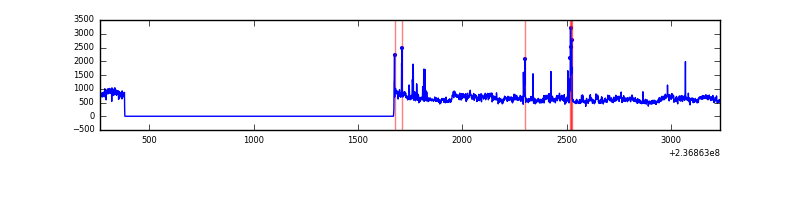 |
Top three noisy pixels from each quadrant. If the there are fewer than three noisy pixels in the level2.evt file, extra rows are filled as -1
| Pixel properties | Quadrant properties | ||||||
|---|---|---|---|---|---|---|---|
| Quadrant | DetID | PixID | Counts | Sigma | Mean | Median | Sigma |
| A | 1 | 162 | 19843 | 374.78 | 253 | 248 | 52.3 |
| A | 1 | 178 | 5611 | 102.57 | 253 | 248 | 52.3 |
| A | 1 | 161 | 5456 | 99.61 | 253 | 248 | 52.3 |
| B | 4 | 80 | 42889 | 874.61 | 247 | 242 | 48.8 |
| B | 0 | 214 | 24699 | 501.57 | 247 | 242 | 48.8 |
| B | 0 | 219 | 10600 | 212.42 | 247 | 242 | 48.8 |
| C | 13 | 61 | 1736 | 26.82 | 240 | 241 | 55.7 |
| C | 9 | 68 | 1183 | 16.9 | 240 | 241 | 55.7 |
| C | 3 | 202 | 572 | 5.94 | 240 | 241 | 55.7 |
| D | 12 | 227 | 125860 | 2133.23 | 243 | 236 | 58.9 |
| D | 1 | 52 | 24376 | 409.92 | 243 | 236 | 58.9 |
| D | 7 | 71 | 22990 | 386.39 | 243 | 236 | 58.9 |
Histogram calculated using DETX and DETY for each event in the final _common_clean file
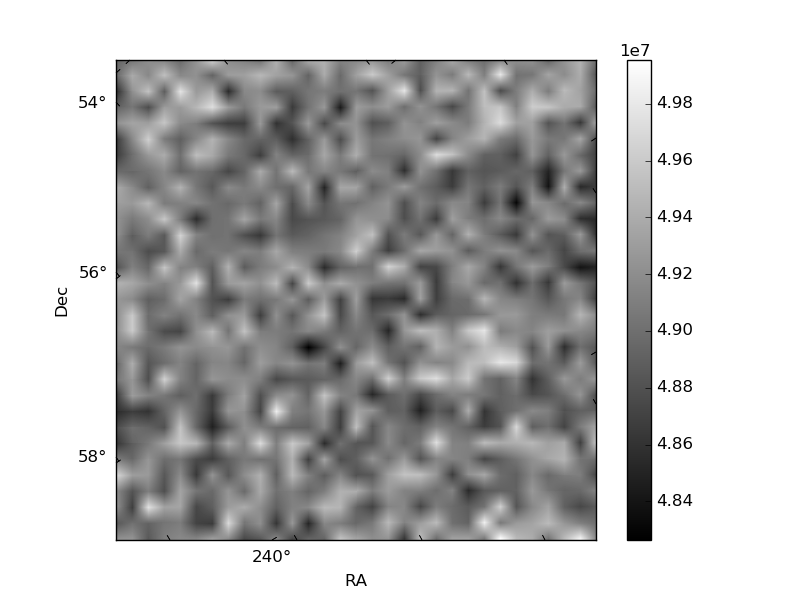
| Quadrant A |  |
 |
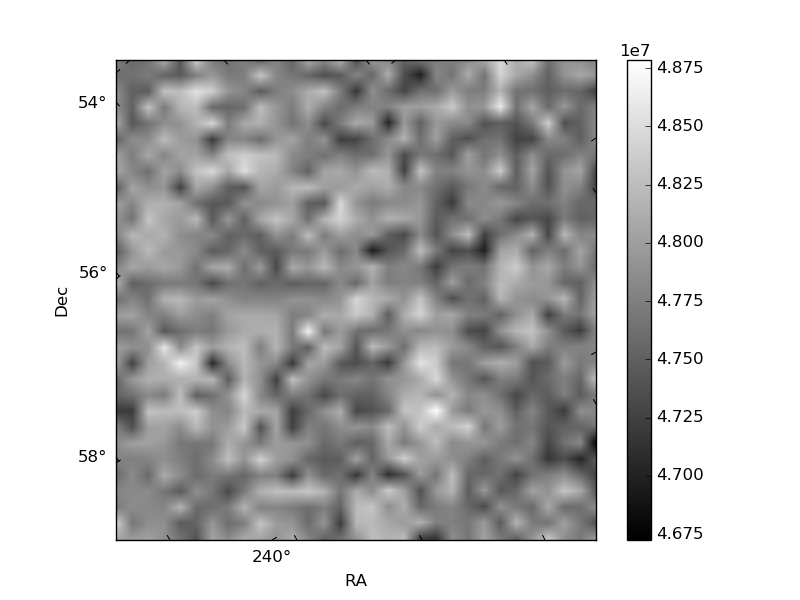
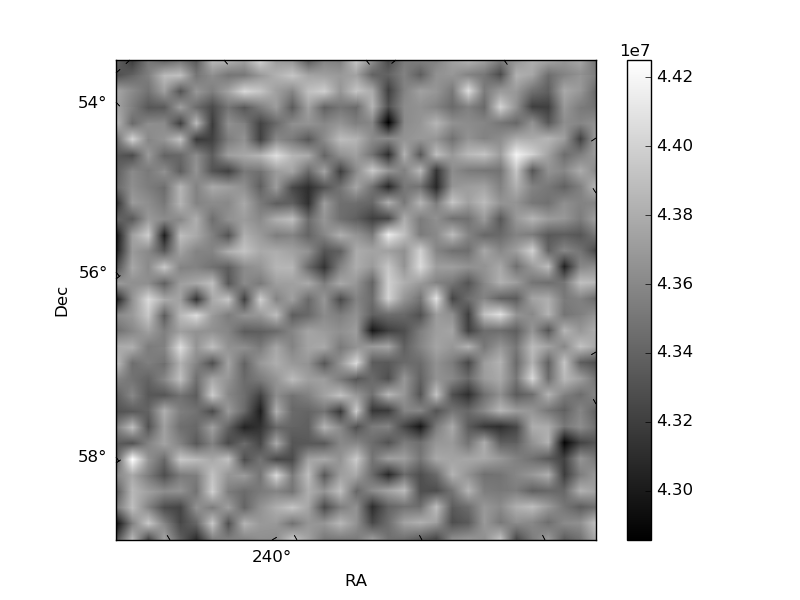
Quadrant B |
|---|---|---|---|
| Quadrant D | 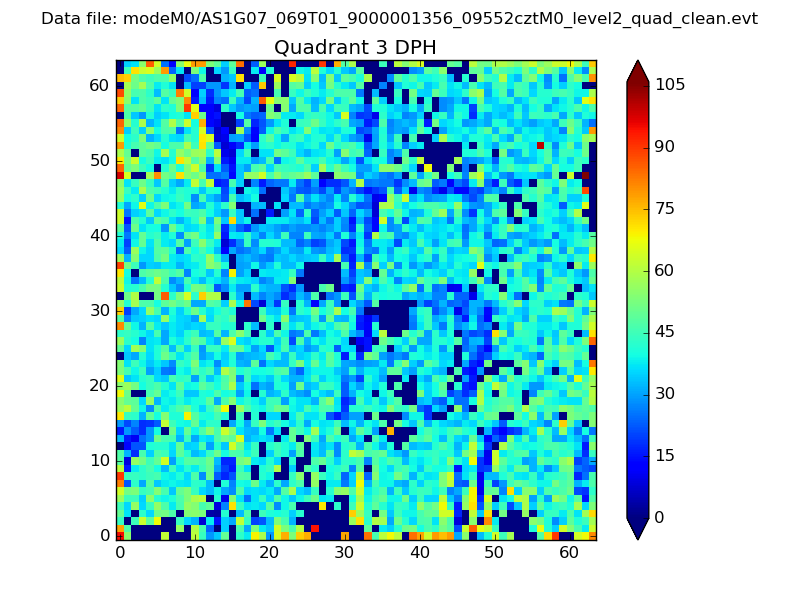 |
 |
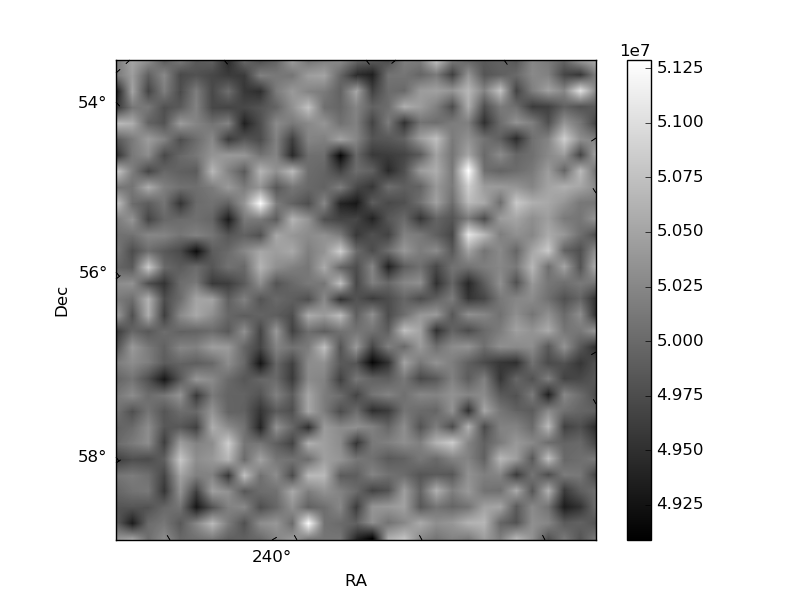
Quadrant C |
| Plot type | Count rate plots | Images |
|---|---|---|
| Comparison with Poisson distribution Blue bars denote a histogram of data divided into 1 sec bins. Red curve is a Poisson curve with rate = median count rate of data. |
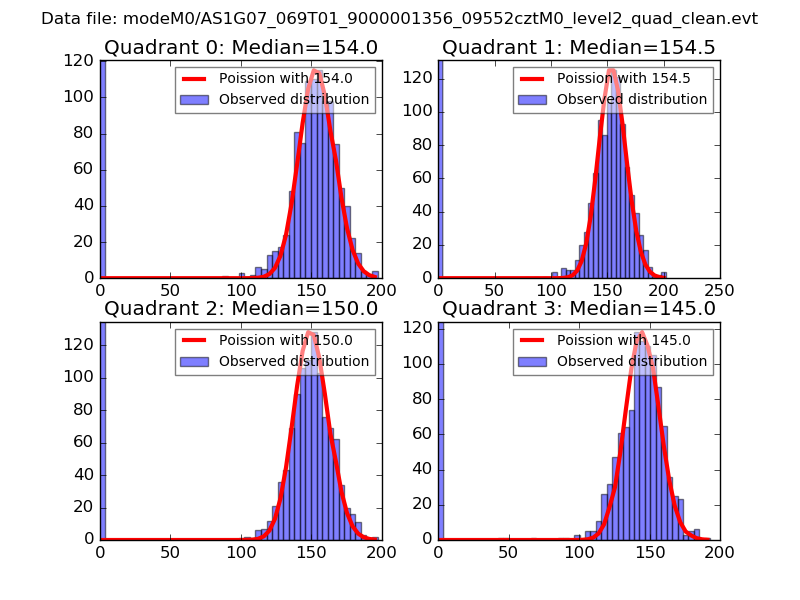 |
 |
| Quadrant-wise count rates Data is divided into 100 sec bins |
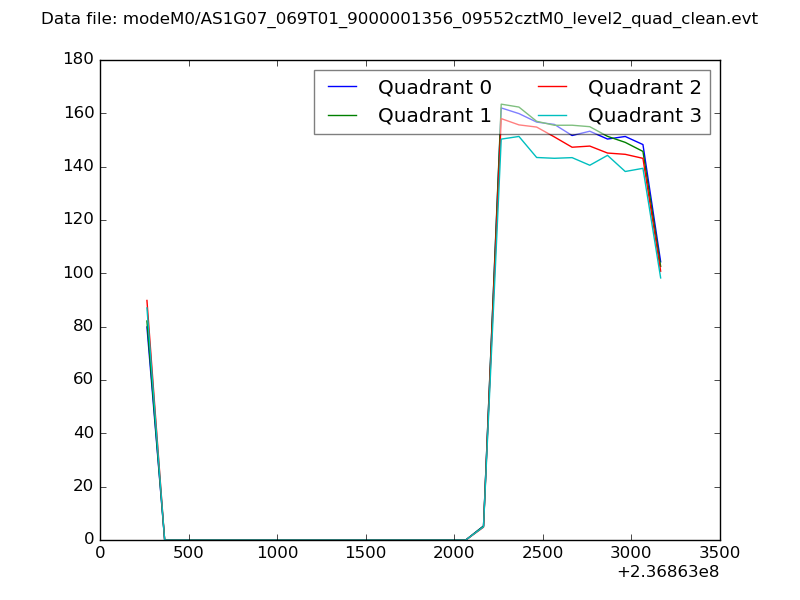 |
|
| Module-wise count rates for Quadrant A Data is divided into 100 sec bins |
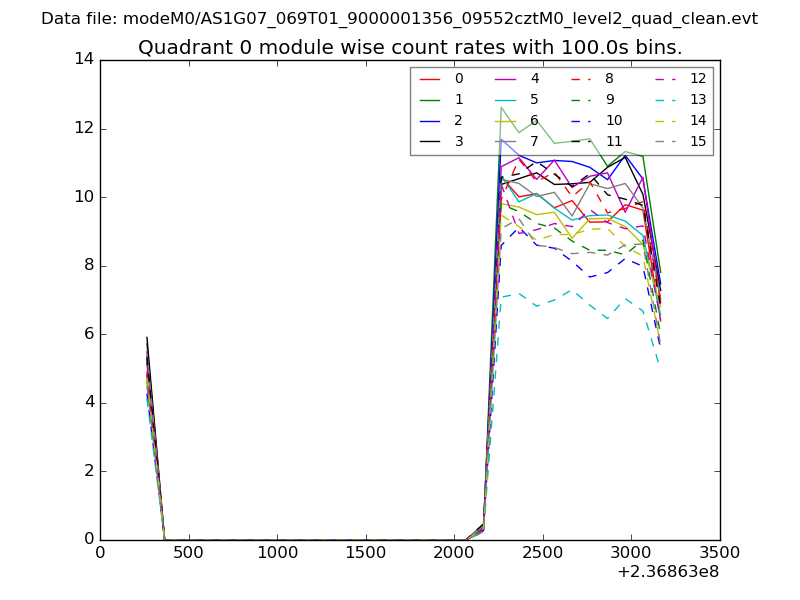 |
 |
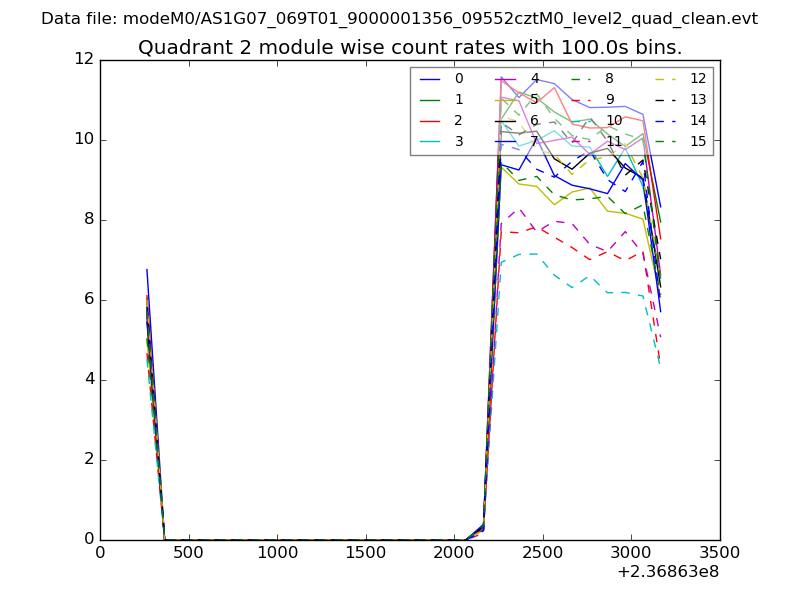
| Module-wise count rates for Quadrant B Data is divided into 100 sec bins |
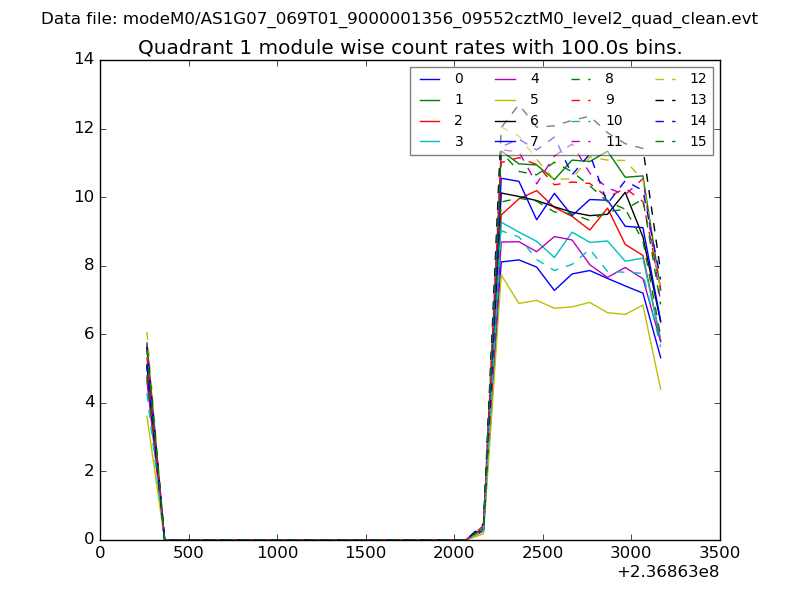 |
 |
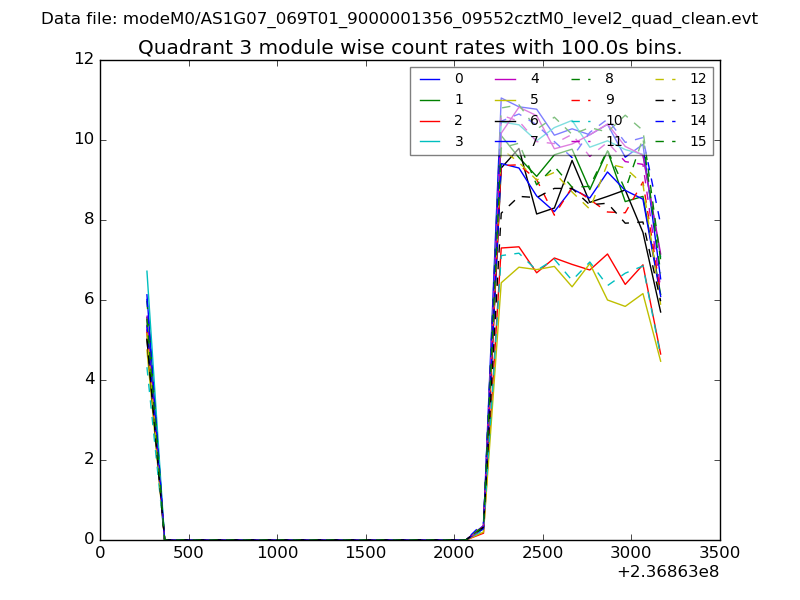
| Module-wise count rates for Quadrant C Data is divided into 100 sec bins |
 |
 |
| Module-wise count rates for Quadrant D Data is divided into 100 sec bins |
 |
 |
| Parameter | Plot |
|---|---|
| CZT HV Monitor | 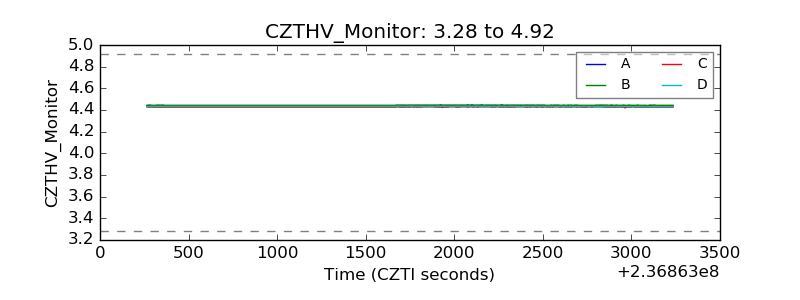 |
| D_VDD | 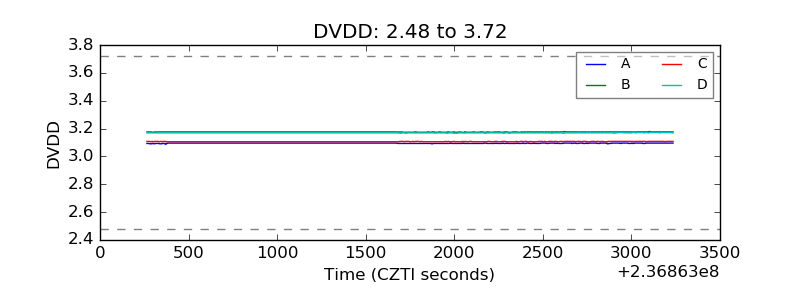 |
| Temperature 1 | 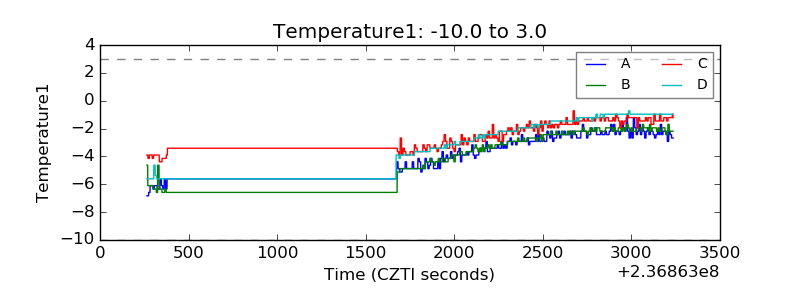 |
| Veto HV Monitor | 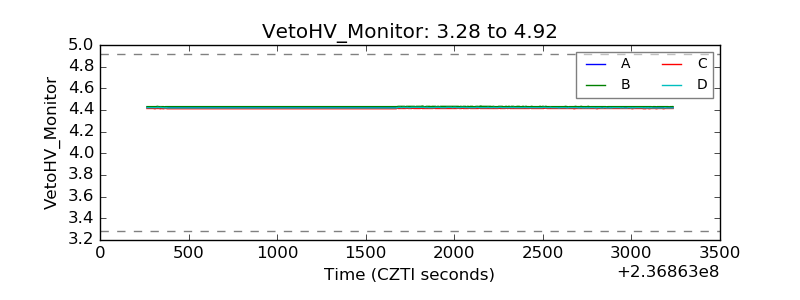 |
| Veto LLD | 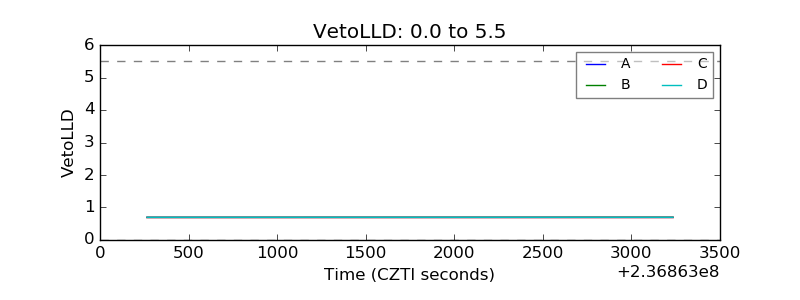 |
| Alpha Counter | 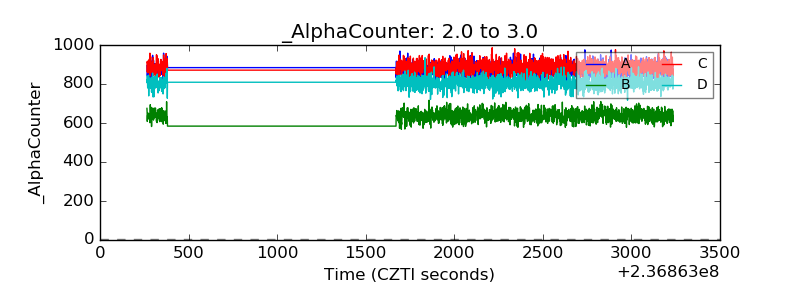 |
| _CPM_Rate | 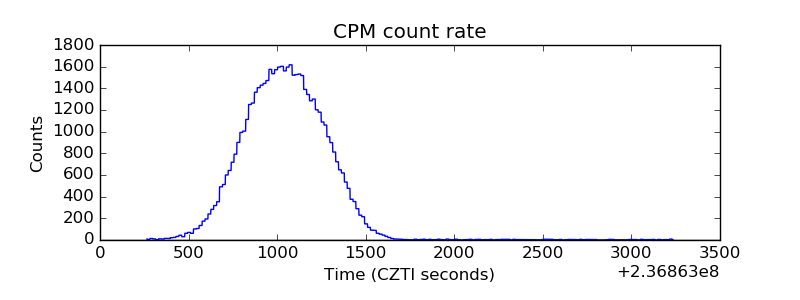 |
| CZT Counter | 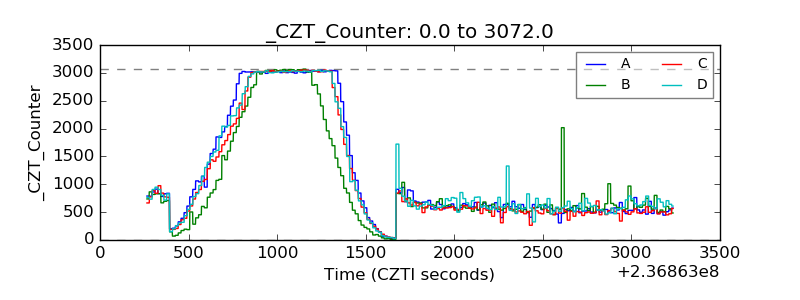 |
| +2.5 Volts monitor |  |
| +5 Volts monitor | 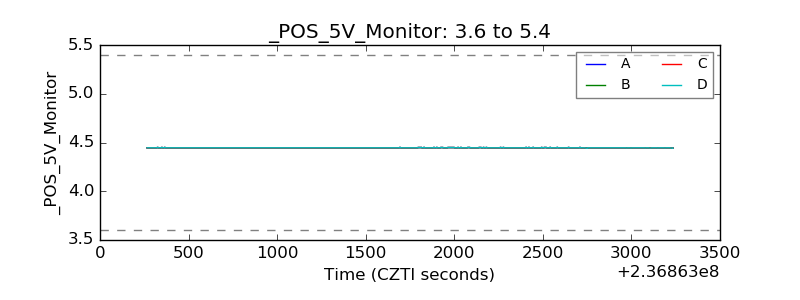 |
| _ROLL_ROT | 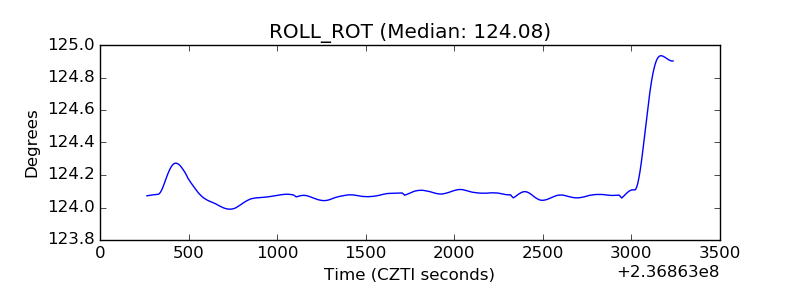 |
| _Roll_DEC | 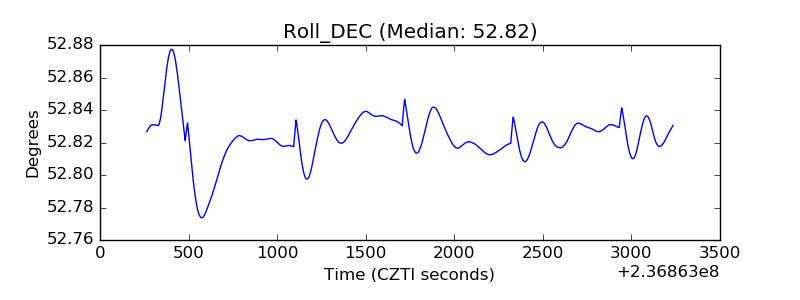 |
| _Roll_RA | 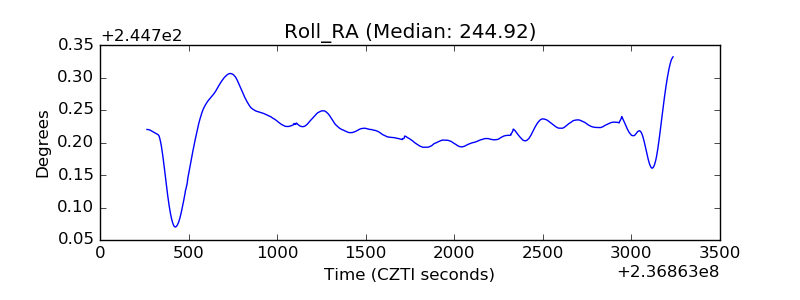 |
| Veto Counter | 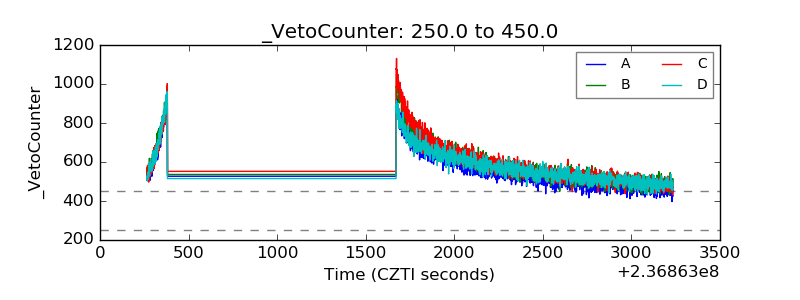 |